Introduction
Working within an industrial perspective opens offers a revelation of a million sources of variation. A factory worker may opt to manually add sulfur in the bleaching tank without using any measurement criteria but instead, rely on his/her experience. This will definitely compound the possibility of a variation with regard to ratios. On the other hand, machine operators may decide to leave a faulty machine running awaiting its ultimate failure, or due to lack of appropriate corrective appliances oblivious of the possible variations.
Variations in a manufacturing environment are not a rare occurrence. The addition of inputs into the production system is often accompanied by a number of variations. How such variations affect output quality and system efficiency is important as it plays out in the determination of the end quality of the output. Reducing variability is fundamental to the firm as it limits the latter effects felt on the output.
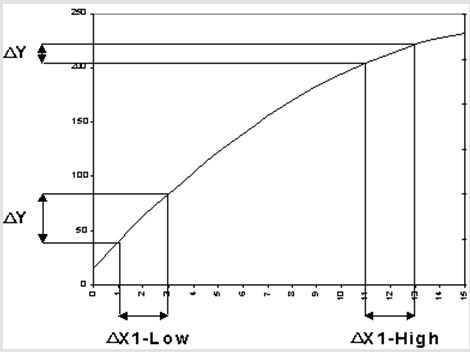
The company incorporated statistical tools in mapping of product and product performance in consideration of the input(X’s) and output (Y’s) variables (See graph above). From the diagram, it is deducible that an input variation will most often result into an output variation (Imai 1997). Such a variation will result into an output that does not meet the set specification and hence compromise quality (Burnes 2010). However, it is ideal not to have variations within a system and hence the need for limits provision.
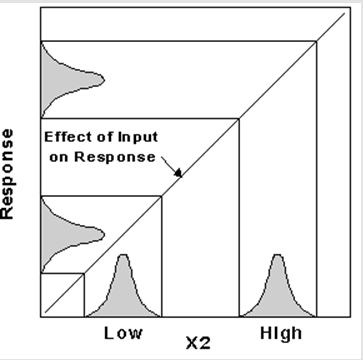
While it may be obvious that response variation reduction is a desirable outcome, the absolute response may get shifted to ranges out of specification (Batalden 2008; Hunter 2011; McLaughlin 2010). It would be logically ideal to counter such effect with introduction of another control factor. The effect of introducing control factors as a measure to counter variations is described by the diagram below;
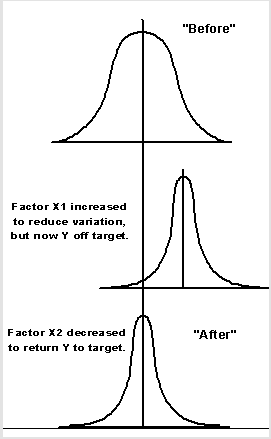
The diagram illustrates a scenario where the introduction of a control variable aimed at controlling a given variation results in another variation. A factor introduced to counter an x variation results in a y variation. However, a counter-measure is introduced that returns y to its original value.
Such illustrates the need for extensive and structured investigation before a measure is introduced with the aim of minimizing/reducing the effect of variation (Imai 1986; Gastl 2009: 23). It would be counter-productive if, in an attempt to reduce variation, a new variation that is probably more costly is introduced into the system. Such a measure would not only compromise product quality but also the company’s production ability and hence the flow of cash (Yin 2003: 234).
Types of Problems
Variations are classified as either common cause or special cause variations. Common cause variations at STARBUCKS include the key system elements that offer a process platform. They include materials, equipment used, personnel involved, the environment, and the process methodology.
The common causes offer a stable distribution over time. Special causes event are a result of non-random events that unexpectedly alters the output often process. Usually, such variations result in a non-uniform distribution over time (Gibbons 2009: 37). The special causes are given an equally special focus in order to bring the drug production process to within a stable range. Statistical control is an important tool applied in this endeavor.
While common cause variations require long-term strategies for identification, understanding, and hence reduction, special causes are inherently unnatural and require non-systematic and immediate reactionary measures (Robbins 2007). Failure to identify various types increases the likelihood of using the wrong tools in solving the problems. Often it is possible to mistake variation causes as being special while they are actually random and originate from the system (Pande et al 2000: 54).
Likewise, variations may be mistaken as being systematic when they are actually special in nature. For instance for the case of STARBUCKS tarnishing of drugs could have resulted from a system error and hence systematic in nature while at the same time, it could have only affected a given batch and hence resulted from a special cause (Pyzdek 2003; Snee R. D. & Hoerl 2005; Wosinska 2005; Yin 2003). Some researchers equate the RISE methodology to DMAIC as shown below;
- Recognition – Situation identification (Define)
- Investigate – facts gathering, identification, and verification of the root cause. (Measure, Analyze)
- Solution – best solution identification and implementation (Improve)
- Evaluate – effectiveness evaluation and knowledge transfer (Control)
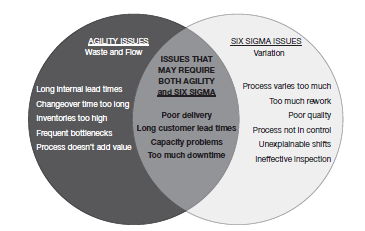
Noting the evolving pharmaceutical world, COSTACOFFEE launched an initiative aimed at enhancing its production and through increased efficiency. The initiative’s deployment involved the launch of the DMAIC six sigma projects across its organization levels (Carleysmith, Dufton, & Altria 2009: 102). On a business level, the company defined main concern issues and linked the same to its key performance indicators to allow tracking of the improvement process (see fig. below). Additionally, the diagram describes scenarios where it may be applicable to borrow a few things from other methodologies in order to increase the efficiency of the program.
Six Sigma emphasizes focusing on a small number of projects in order to make large profits. Two main approaches employed in the six sigma methodology are DMAIC and DFSS (Bellack 2012). DFSS mainly focuses on the design of new products and processes. This thesis will however focus on DMAIC used in the improvement of processes and products (Bicheno 2006: 54). Its structured approach provides a clear working structure and also creates a focus on improved processes/products implementation.
DMAIC Improvement cycle
The letters in DMAIC are designated as Define, Measure, Analyze, Improve, and Control (Antony et al 2003: 23). Improvement range through DMAIC application is rather large and can be used in the improvement of operations critical to quality characteristics, customer, process, and compliance. It has also been successfully employed in problem-solving and decision-making due to its systematic and easy-to-use methodology.
DMAIC Phases
The defined phases include a definition of the problem being encountered and the goals of the project. The critical characteristics subject to improvement are chosen and appropriately defined (Charalambous & Gittins 2008: 229). The process baseline is likewise identified and appropriately defined. Pareto charts and flow charts are the commonly applied tools in this phase. Measure phase is characterized by the identification of the factors that influence the defined problems and goals. A common measurement tool is the cause and effect diagram. Analyze phase focuses on learning more about the chosen variables. Normality plots, histograms, and control charts are used in this phase (Nunnallay & McConnell 2007: 11).
Define Phase
After the decision to investigate the cause of tarnishing and inefficiency of the drugs, a project plan was made taking into consideration the time required for each phase. The aims and scope of the project are presented in this phase. The cost-saving potential of the project is based on the risk of losing customers. The project charter was set up based on a template from Magnusson et al (2003). The charter identifies the study case and highlights the probable gains, project background, and probable constraints. The project status table is however subject to revision as the project proceeds.
The define phase also involves identification of the problem which in this case is the tarnishing of the drugs before expiry and failure of the drugs to perform their intended function. While other issues also arise, these two are identified as critical to quality variables (Halliday et al 2007: 65). This is achieved after a series of interviews with the personnel and the customers. An examination is conducted to verify if the complaints brought forth are genuine and hence if the process should undergo formal examination for areas of fault. To achieve this control charts are were used as illustrated below;
The average number of customer complaints month
The figure illustrated the average number of customer complaints per month. The latter months reveal lesser weight variation. In general, the average number of customer complaints remains within limits indicating that the weight is within the desired range. The size of a drug determines the dosage at which it is administered and hence any variations in it must be treated firmly (Zoula 2009: 59). For variations that fall out of range, the company will have to adjust variables to correct the same. Identification of these variables is thus the next challenge once the weight has been identified as an out-of-range variation.
Consistent variations are easy to track unlike spontaneous variation with no regular trend (Johnson 2006: 17). Such variations require extensive study before conclusions are made with regard to the corrective measures to be employed. The define phase generally focuses on problem identification and definition paving the way for a series of investigations aimed at mitigating its effects. This stage is critical to ‘six sigma’ as it forms the basis upon which all the other investigations are based.
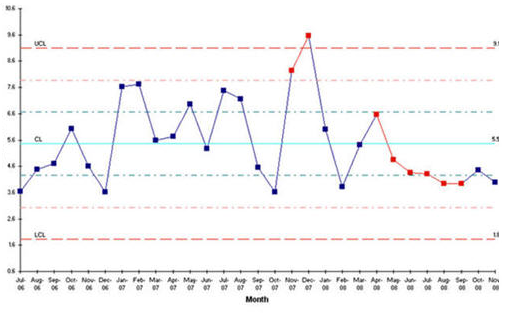
The average service time per client is also tested with the help of control charts and the obtained result is as indicated by the graph below;
The graph indicated the number of days taken by drugs before beginning to tarnish below the expected hence indicating that the process is out of control and needs to be further investigated and appropriately corrected. With the variations far exceeding the upper control limit, the company has every reason to be alarmed and hence employ measures aim to reduce the level of this variation.
Measure Phase
In this stage, the possible variables resulting in the effect (tarnishing) are identified with the help of a cause and effect diagram. The cause and effect diagram takes down to the top approach by identifying the root cause of the problem that results in the effect being investigated. All the possible problem sources are identified and listed and consequently, the problems which may result in the listed problems are likewise listed to produce an illustration diagram (Montgomery 2005; Colton 2009). These variables that cause the effect under study are the x’s while the end affects ifs the y. as initially described y is a function of q variables and the proposed x are expected to result in a y change when altered either independently or in groups.
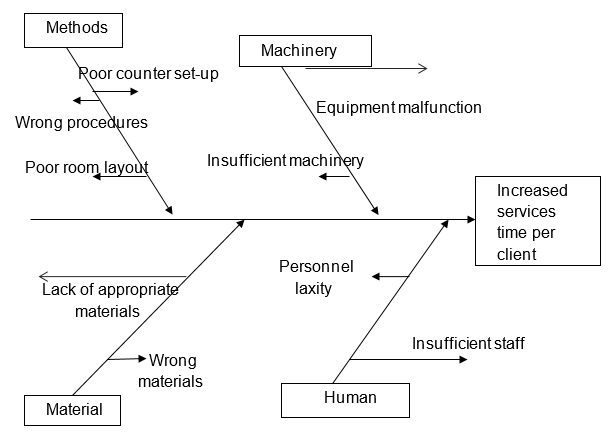
Identifying the x variables possibly influencing the end effect involved brainstorming and questioning of staff and the management team. The variables chosen from this brainstorming were to later be used in the factorial experiments at the analysis stage (Rudolph 2009; Chan & DeGroote 2009; Katzenbach 2010; Berglund 2012). However, not all the identified variables could be used in the experiment and hence there was a need to select the important variables that would effectively be used in a factorial experiment. To achieve this, a Pareto chart was developed to identify the factors that contribute a lot to the variations in production and hence poor quality drugs. The Pareto chart is shown below;
Where
- 1 poor counter set up
- 2 wrong procedures
- 3 poor room layout
- 4 equipment malfunction
- 5 wrong materials
- 6 wrong design
- 7 insufficient machinery
- 8 lack of appropriate materials
- 9 Insufficient staff
The chart assists in the identification of the most influential variables that are likely to result in the defect being investigated. From the graph poor counter set up, wrong procedures, poor room layout, and laxity of personnel are the major factors causing the process variations.
Improve Phase
Different factors were identified as having an influence on the end effect. The factors capable of reducing variation were identified. Improvement is thus the next phase and involves the implementation of solutions to correct the factors. Coating improvement is achieved by changing composition to obtain more durable finishes.
Control
The improvement is verified in this phase. The proposed changes are made and evaluated as would be expected at production. A hypothesis was conducted in order to ascertain the effectiveness of the improvements proposed/made. A level of 0.05and 95% confidence levels is chosen.
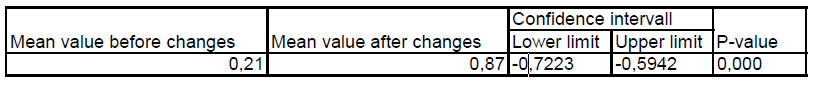
The hypothesis test indicated considerable change of tarnishing effect before and after changes given the p-value is under α. The 95% confidence level is non-inclusive of zero indicating a relatively significant mean for the dual distributions.
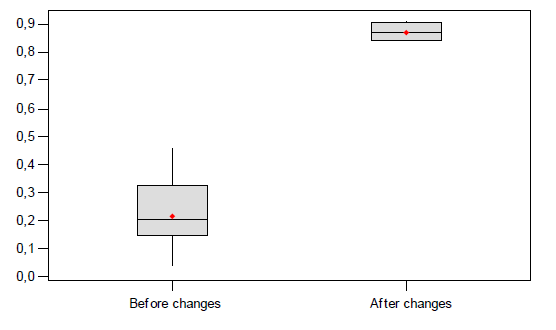
Customer average service time before and after
Results discussion
From the interviews with the staff and management team at OTSP Plc., leadership and management commitment emerges as a fundamental tool for six sigma implementation. Most respondents stressed that the leadership team needs to be aware of six sigma’s objective and hence offer unrelenting support. A number of obstacles to six sigma implementation were also identified and represented in the chart below;
Surprisingly a large proportion of the failure is attributed to the failure by management to allocate adequate resources to the processes implementation leading to its failure. A variety of successes are recorded as depicted in the performance indicator table with most of the responses confirming the findings from the literature that six sigma’s implementation has a rippling effect on all the key performance indicator areas of the corporation. Additionally, most of the staff and management represent a belief that effective six sigma implementation has a long-term effect of reducing the company’s financial standing.
The DMAIC process is additionally successfully used to identify the primary sources of variation that result in the quality problem being faced by the company. A systematic approach employing the use of various DMAIC sub-sets including Pareto charts, control charts, and Ishikawa diagrams displays an astonishing ability to sieve down the problems and hence identify the root cause of the problem as coating procedures.
References
Antony, J. et al 2003, ‘Lean Sigma’, Manufacturing Engineer, vol. 23, no. 5, pp. 40-42.
Batalden, B.P 2008, ‘Quality management and continual improvement of health care: a framework’, The Journal of Continuing Education in the Health Professions, vol. 15, no. 3, pp.146-164.
Bellack, J. P 2012, ‘Taking aim at interdisciplinary education for continuous improvement in health care’, Nursing and Health Care Perspectives, vol. 18, no. 6, pp. 308-315.
Berglund, R. G 2012, ‘Leadership: Creating the quality culture’, Michigan Quality Council, vol. 23, no. 9, pp. 234-239.
Bruttin, F. & Fraser, H (2005), The metamorphosis of manufacturing: From art to Science, An IBM Institute for Business Value executive brief, vol. 12, no. 3, pp.1-35.
Burnes, L 2010. Continuous quality improvement, Quality management journal, vol. 23, no.4, pp. 456-461.
Carleysmith, S. W., Dufton, A. M. & Altria, K. D 2009, Implementing Lean Sigma in pharmaceutical research and development: a review by practitioners”, R & D Management, vol. 11, no. 5, pp. 95-106.
Chan, Y., & DeGroote, M. G 2009, ‘Continuous quality improvement: a survey of American and Canadian healthcare executives’, Hospital & Health Services Administration, vol. 42, no. 4, pp. 525-544.
Charalambous, C. & Gittins, J 2008, Factors influencing the profitability of research, R & D Management, vol. 38, no. 6, pp. 221-230.
Colton, D 2009, ‘The design of evaluations for continuous quality improvement’, Evaluation & the Health Professions, vol. 20, no. 3, pp. 265-285.
Gastl, R 2009, CIP in Environmental Management, an Abstract of Gastl, René: Kontinuierliche Verbesserung im Umweltmanagement, vdf, Zurich.
Gibbons S. 2009, ‘Three paths, one journey’, Journal for Quality and Participation, vol. 17, no. 6, pp. 36-45.
Halliday, D. et al 2007, The allocation of resources for R&D in the world’s leading companies, R & D Management, vol. 27, no.3, pp. 63-77.
Hunter, D. L 2011, ‘Teamwork: a model for continuous quality improvement in the health care industry’, American Journal of Medical Quality, 10(4), pp. 199-205.
Imai, M.1997, Gemba Kaizen: A Commonsense, Low-Cost Approach to Management. McGraw Hill.
Imai, M1986, Kaizen: The Key to Japan’s Competitive Success, McGraw-Hill/Irwin.
Johnson, A. 2006, Lessons learned from six sigma in R&D”, Managers at work, vol. 11, no. 9, pp. 15-19.
Katzenbach J. R 2010, The wisdom of teams: Creating the high performance organization. Boston, MA: Harvard.
Magnusson, K. Krsolid, D. & Bergman, B 2003, Six Sigma: The Pragmatic Approach. Lund: Studentlitteratur.
McLaughlin, C. P 2010, Continuous quality improvement in health care, Gaithersburg, MD: Aspen Publishers, Inc.
Montgomery, D.C 2005, Design and Analysis of Experiments (6th ed.), New York: John Wiley and Sons
Nunnallay, B. K. and McConnell, J. S 2007, Six Sigma in the Pharmaceutical industry: Understanding, Reducing and Controlling Variation in Pharmaceuticals and Biologics, Quality Journal, vol. 24, no. 5, pp. 234-241.
Pande, P. S. et al 2000, The Six Sigma Way- How GE, Motorola and other top companies are honing their performance, McGraw-Hill.
Pyzdek, T 2003, The Six Sigma Handbook, Hill McGraw.
Robbins, H 2007, ‘Why teams don’t work’, Executive Book Summaries, vol. 17, no. 4, pp. 1-8.
Rudolph, J. T 2009, moving continuous quality improvement practices into higher education. CUPA Journal, vol. 46, no. 4, pp. 25-31.
Snee, R. D. & Hoerl, R. W 2005, The Six Sigma-Beyond the factory floor: Deployment Strategies for Financial Service, Health Car and the Rest of the Real Economy, Person Prentice Hall.
Wosinska, M 2005, Understanding Firm, Physician and Consumer Choice Behavior in the Pharmaceutical Industry, Marketing Letters, vol. 34, no. 9, pp. 293–308.
Yin, R. K 2003, Case Study Research: Designs and methods, London: Sage Publications Inc.
Zoula, G 2009, ‘Effectiveness of DMAIC in continuous process improvement’, Quality management journal, vol. 12, no. 4, pp. 56-62.