The theory of demand refers to the economic principle associated with the connections between the demand of customers for products and services and prices established for them. The more there are services and goods available, the lower is the demand as well as the equilibrium price. Demand theory, therefore, underlines the role that demand plays in the formation of prices while the supply theory is concerned with the availability of products in the market. As demand represents the number of products or services that people are willing to buy at a given price and a given time period, it explains why there is demand for some products while there is no demand for others.
The desire to buy is linked to the satisfaction of a customer that he or she expects to get from consuming the product or service. Utility denotes the level of satisfaction and can be different between consumers (Hirschey and Bentzen 112). The utility of a product or service depends on two factors the utility to satisfy a need or want and the ability of a consumer to pay for a good or service. Therefore, real demand is associated with the readiness’ of a customer to satisfy his or her want alongside with the willingness to pay and the general ability of individuals.
In regards to the concept of demand, there are built-in factors such as consumer preferences, choices, and tastes. Therefore, within an economy, evaluating demand is seen as one of the most important decision-making variables that companies must analyse to exhibit high levels of performance and grow in an ever-changing competitive environment. The market system is regulated through the reliance on supply and demand laws that influence the prices established on goods or services. In the case when supply and demand are equal, prices are considered to be in a state of equilibrium. When supply is lower than demand, there is scarcity in the market and prices increase. Conversely, if supply is higher than demand, there is a surplus or goods and services, making prices on them fall.
When considering demand law, it is essential to mention that it describes a negative correlation between price and demand for a service or a product. This means that when the price of a commodity rises, the demand for it lowers provided that other relevant factors remain on the same level. Also, when prices decrease, the demand for the products and services that became more affordable than they used to be increases. The demand curve shows such a relationship between demand and prices. The demand curve illustrates a negative slope as it goes down from left to right in order to show an inverse relationship between the price for goods and services and the quantity demanded by the market. A contraction or expansion in demand for product or service is the result of either substitution or income effects. In case of a decrease a commodity’s price, a person can reserve the same level of satisfaction for less money, provided that it is a normal good. In this scenario, a customer can buy more products and services on a given budget. The substitution effect is seen when customers change from one expensive product to less costly replacements that have fallen in price. With more people buying products at lower prices, the demand for them increases.
In some instances, customers buy either more or fewer products or services associated with factors apart from price. This is linked to the change in demand, which refers to the shift in the curve either to the right or the left following a change in the income, preferences, and tastes of consumers (Engle et al. 26). For instance, a consumer that has recently received a raise at work increases his disposable income and therefore spends it on various goods and services on the market regardless of whether their prices go up or down. Such a condition leads to a shift of a demand curve to the right.
Demand forecasting represents an essential component of planning for many companies as it is used for estimating probable demand for their goods and services in the near future. Companies base this analysis on past demand for their goods in the present conditions of the market. Demand forecasting is recommended to be done on a scientific basis, with all facts and events associated with predicting should be considered. After collecting data on different components of the market and demand on the basis of past information, companies can attempt to estimate future demand.
Overall, it is important to note that demand forecasting is highly useful for businesses in terms of their decision-making (Thomopoulos 152). In the conditions of highly competitive markets, there is a requirement to make correct decisions and implement planning for future occurrences associated with events such as production, sale, and others. The effectiveness of decisions made by business managers relies on the accuracy of forecasting. Since demand represents an essential aspect for achieving business objectives, a great number of companies’ decisions depend on such variables as production, staff requirements, and sales (Oeser 5). If to analyse the demand forecast presented in the diagram (Figure 1), it is worthy to mention that the trend of actual demand for the product or service coincides with the predicted demand.
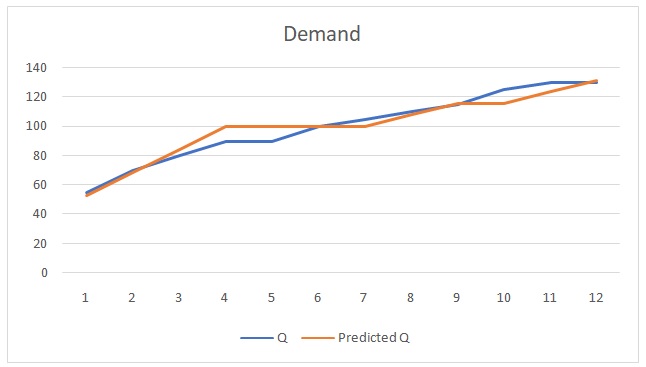
The final points in both curves met at the same indicator on the diagram, which means that the company making the prediction was effective in identifying the likely demand at the end of a time period (twelve months). At some points within the year, such as during the fourth month, the predicted demand was ten points higher than actual demand. Conversely, between the ninth and eleventh months, the actual demand for the product or service was higher by approximately five points. Overall, the demand forecasting graph presents a useful method for an organisation to plan its business activities in accordance with the demand for products or services. If implemented correctly with the help of past data, the actual and forecasted demand curves will follow a similar trend with only minor differences.
To conclude, the demand theory can develop the basis for the curve of demand, which is associated with the desire of customers to purchase various things that are available on the market. Making forecasts is necessary for companies at both international and domestic levels as the process reduces the risks associated with business activities and helps companies make effective decisions. Forecasting is even more important for organisations that manufacture their products at mass levels because good forecasting helps companies to plan better for related business goals and objectives.
Works Cited
Engle, Carole, et al. Seafood and Aquaculture Marketing Handbook. Wiley Blackwell, 2017.
Hirschey, Mark, and Eric Bentzen. Managerial Economics. Cengage Learning, 2016.
Oeser, Gerald. Risk-Pooling Essentials: Reducing Demand and Lead Time Uncertainty. Springer, 2015.
Thomopoulos, Nick. Demand Forecasting for Inventory Control. Springer, 2015.