Executive summary
With the increase in globalization, the idea international financial analysis has increased. Financial analysts handle a lot of uncertainties in the global markets. Analysts argue that the accounting the main cause of the uncertainties in the current market is the accounting standard set by different country. However, international accounting standards are improving the situation of global accounting. Generally accepted accounting principles (GAAP) offer guidance to managers when preparing financial information. GAAP allows financial managers to choose any of the accounting policies and procedures.
Some firms and financial managers employ the art of earning management to report financial results (Ortega and Grant, 2003). With these facts in mind, the question of financial analysis becomes a simple matter. This paper analyses the financial position of McDonald Company. Moreover, it provides an insight into operation of the company using the annual reports released between 2008 and 2010. Finally, a financial analysis for the rate of exchange by region will be done.
Introduction
McDonald’s Company operates using the process of franchising. The company had 31967 restaurants in 118 countries at the end of 2008. 25,465 of these restaurants were under franchisees. In the year 2009, the company had 32478 restaurants in 117 countries. 26,216 of these were franchisees. By the year, 2010 the number of restaurants were 32737 and the franchisers were 26,338. The arrangement between the McDonald’s and the franchisees required the franchisees to provide a fraction of the capital. The franchisees had to invest in equipment, signs, décor, and seats. The McDonald on the other hand owned the land and the building under which operates.
The company’s income consists of sales from subsidiary restaurants operated by franchisees (McDonald’s, 2009). The bulk of the revenue from franchised restaurants is in the form of rent, fees, and royalties. The company calculates the rent and the rates as a ratio of the sales (McDonald’s 2009). The fees paid by franchisees vary depending on the site and the amount of investment put in by McDonald Company. The fees and other rights are stipulated in the franchise contract. The contract has a lifetime of approximately 20 years (McDonald’s, 2009).
Management of McDonald Company occurs in distinct segments according to the geographic location. The segments of company that warrant reporting include the United States (US), Asia/Pacific, Middle East and Africa (AMPEA) and Europe (McDonald’s, 2009). These segments account for 95% of the total revenues received. The United States accounts for 34% Europe accounts for 40% and the AMPEA segment accounts for 21% of the revenue. However, other countries also have McDonald’s and these countries appear in the report. Countries such as Canada and Latin America have McDonald’s.
McDonald’s continue to focus their resources in developing the business. This is because there are opportunities for business growth and long-term profitability in the restaurant industry. In 2008, the company reported the highest sales growth (McDonalds, 2008). McDonald Company also rolled out new kitchen operating system in about 5000 European countries. In the same year, the Company sold the minority interest in a UK subsidiary for approximately 229 million dollars.
From the two sales, McDonalds recognized the non-operating gains. The general view we get from the Company’s financial dealings is that McDonald’s is gradually increasing its business activities (McDonald’s, 2009). This can be detected in the financial deals conducted between 2008 and 2010. These financial activities show improvement in the company. Moreover, it attests to the changes occurring at the McDonald’s Company (McDonald’s, 2010).
Background
McDonald’s is a multinational corporation that conducts its businesses in more than 117 countries worldwide. The company is well known for its franchising prowess since it has more than 26000 franchisees. In the highly competitive market, the company has managed to establish its own brand and compete with other fast food companies since 1940 (Putilina, 2010). The McDonald’s base their competitive strategy on the food prices, good services, convenience, quality of products, and menu variety. McDonalds like any other multinationals face risks. These risks include foreign exchange risk, inflation, industry regulations, inflation, and global slump.
Global slump (recession) led to the downfall of several multinational companies. Moreover, it slowed down the growth of the McDonald’s. However, in the year 2008 to 2010 the McDonalds showed a great deal of improvement (Putilina, 2010).
The McDonald’s Company is gaining a competitive advantage in the global market its net income is raising steadily and the grip on the global market is firmer. However, their stocks were trading at a lower than expected value. Examination of the McDonald’s’ financial position is important in determining the overall position of the company in the global market. Putilina (2010) compared five of the top competitors with five of bottom competitors to show the in McDonald’s’ stock prices relative to its major competitors. The following graphs shows the results obtained from Putilina’s 2010 analysis.
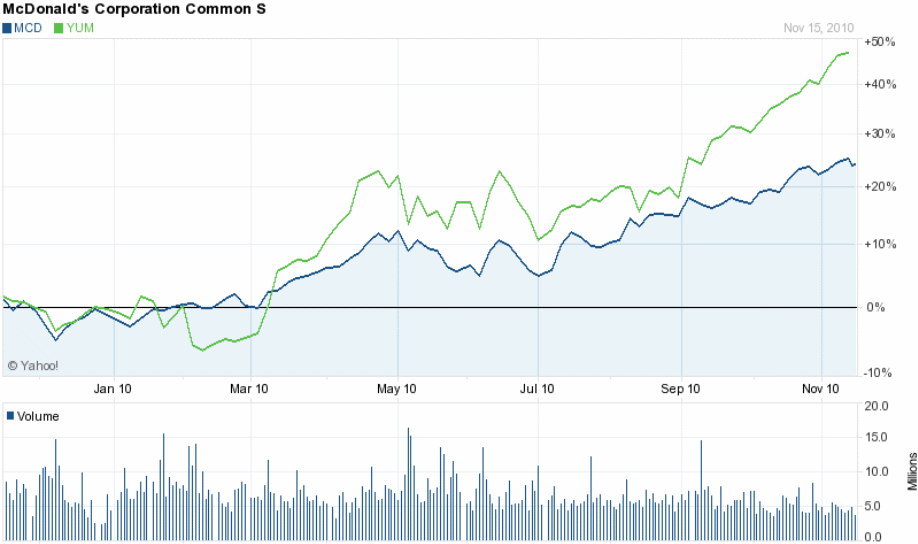
The Yum brand has five major franchisees. These franchisees include the Kentucky Fried Chicken, Taco Bell, Pizza Hut, All American Food Restaurants, and Long John Silver’s (Putilina, 2010). Despite the fact that the McDonald’s Company had a greater gain of the dollar, Yum brand had a faster growth rate than the McDonald’s (Putilina, 2010).
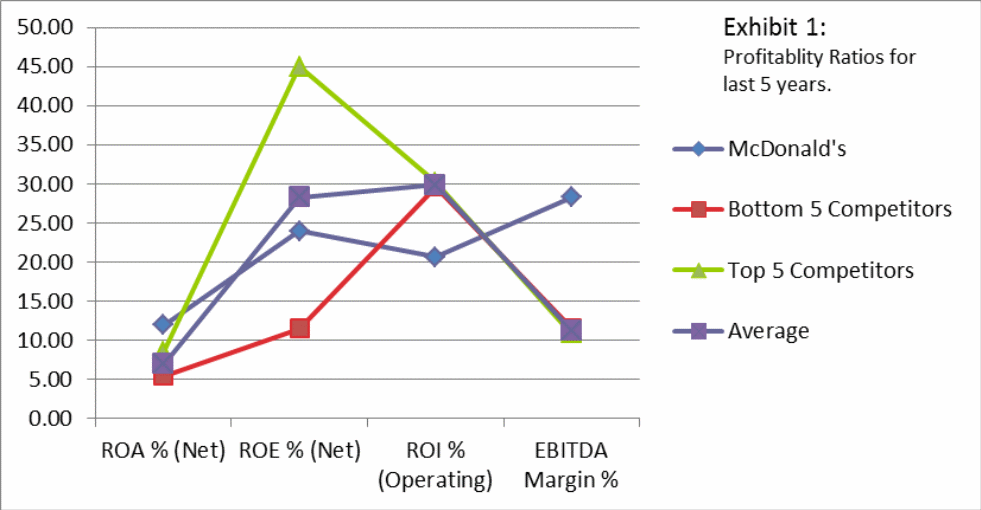
From the graph above, Putilina (2010) compares the McDonald’s with other competitors in the restaurant industry. Putilina (2010) did the comparison in respect to the profitability of each competitor. It is noticeable that McDonald’s Company is a strong competitor. However, the return on investment value of the McDonald’s Company is far less than the industry’s average value (29.9%). This value is low compared to the value of the top five competitors. Furthermore, the Company’s return on equity is lower than the industry’s value by 4.3 %. The return on investment ratio and return on equity ratios are important. Investors use these ratios in determining whether to invest capital in a company.
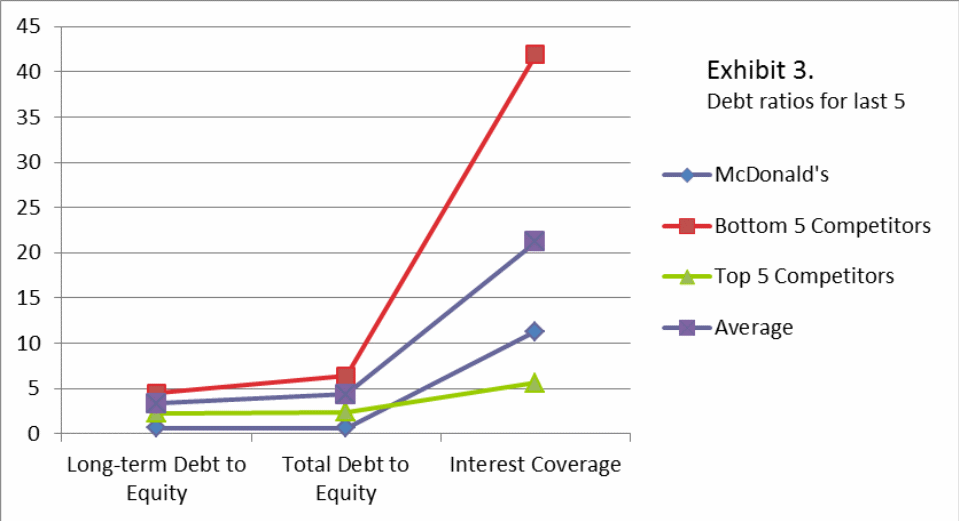
The graph above shows the comparison of the McDonald’s Company with its competitors on the ability to pay debt. This graph clearly shows that McDonald’s holds a weaker position in debt payment when compared to its competitors. Despite the fact that McDonald’s reports mentioned that the company had the ability to pay its debts, the low debt ratios portrayed discourage investors from buying stock. The quick ratio of 0.6 is a very low figure when compared to the industry average of 3.4. Similarly, when this value is compared to the top five competitors in the industry it puts the McDonald’s Company in a bad position. This ratio is likely to frighten investors from purchasing stock (Putilina, 2010).
In the United States, McDonald continued to increase the sales in 2008. Moreover, the company increased the market share of informal eating-market. In the year 2009, the United States sales grew by 2.6%. The reason for the increase in sales was due to continued focus on a classic menu favorites and emphasis on affordability (McDonald’s, 2009). The launch of new McCafe premium coffees also added to the increase in the sales value. In 2010, the comparable sales, guest counts, and market share of the United States increased for the eighth consecutive year (McDonald’s, 2010). The increase in sales was 1.2% higher than the previous year. A number of factors contributed to the increase in sales. The core menu items of the McDonald’s in the United States such as chicken and burgers contributed to the increase in sales and guest value. Moreover, additions in the McCafe beverage line also contributed to the increase in sales.
In 2008, Europe posted a record high comparable sales value. A good percentage of the countries in Europe contributed to the high sales figure. In 2009, the sales value rose by 5.2%. This increase in sales was due to the upgrade in employee and customer experience. McDonald’s corporation also enhanced the local experience. Moreover, they built brand transparency in the European region. These two strategies enhanced the record high sales seen in Europe in 2009.
The comparable sales in Europe rose by 4.4 % in the year 2010. This was the seventh consecutive year of sales increase in Europe (McDonald’s, 2010). The major contributors to the high sales during this period were France, Russia, the United Kingdom, and Germany. Sales increase in these countries was due to the change in strategy that was implemented by the Company. Some of the strategies used include the establishment of a new image for 1000 restaurants.
In the APMEA region, the positive comparable sales value continued to prevail. Countries with sizeable increase of sales include China, Japan, and Australia. China continued with its aggressive development. They opened their 1000th McDonald’s subsidiary in 2008. McDonald Corporation further enhanced the services provided in APMEA with drive through and delivery services. In 2009, the comparable sales in APMEA rose to 3.4%. The reason for the increase in sales was due to the convenience of the McDonald’s. Moreover, the momentum of business in Australia also contributed to the increase in comparable sales (McDonald’s, 2010). McDonald Corporation established multiple initiatives in Australia.
Financial Analysis and Performance
The company uses various performance measures and financial measures to analyze the business trends. Moreover, they use sales comparison and guest counts to analyze how each segment is performing. The company obtains constant currency results. The purpose of obtaining constant currency results is to reduce the effect translation from one foreign currency to another. Managers use the currency values obtained in the current year together with the prior average exchange rate in order to translate the foreign currencies. McDonald’s Company analyzes business financial results using a constant currency. Compensation plans are used to balance the financial results. These incentive compensation plans represent the company business trends better (McDonalds, 2008).
The McDonald’s Company also analyzes performance through comparison of the sales and comparing guest counts. These two elements are important performance indicators in the restaurant business. They indicate the level of acceptance in a specific country or region. Moreover, they can be used to show the consumer and local economic trends. Any increase or decrease in the comparable sales value indicates the percentage of change in the sales of the company. A change in the comparable guest value represents the percentage change in number of transactions. The comparable sales of the McDonald’s Company assume the effects of currency translation.
All McDonald’s issue their reports based on the calendar year. Therefore, comparisons between the same financial months, quarter or year is affected by the mix of days that the each subsidiary uses (McDonalds, 2009). The comparable guest and sales value depends on number of weekends in a calendar year (McDonald’s 2010). Furthermore, vacations and holidays have the tendency of increasing the number of guests which in turn increase the sales.
The impact of holidays varies according to the geographical region of the subsidiary company. Consumer spending pattern in each region is highly variable and affects the monthly comparable sales of the McDonald’s in different countries. However, the annual difference in comparable sales figure and guest is negligible. For a leap year, the extra day in the year may add the comparable sales and guest count value. For example, in 2008 the comparable sales and guest count value increased due to the extra day.
McDonald’s Company records the sales value from all the subsidiaries including the franchisees. The value obtained from all the sales figure is known as the system wide sales. McDonald’s corporation does not consider sales value obtained from franchisees as part of the company revenue (McDonald’s, 2009). However, management of the McDonald’s Company believes that the information on sales is important (McDonald’s, 2009). McDonald’s Company use sales data to evaluate the financial performance of the company. Sales and revenues act as indicators of the financial health of any given company (Dow, 2000). Therefore, in obtaining these figures the managers of the McDonald’s may use them to formulate market entry strategies (McDonalds, 2009).
In addition to the aforementioned analyses, the McDonald’s Company tracks the return on incremental invested capital (ROIIC). Management measures this value in a period of one year and after three years. Measuring ROIIC assists the management to evaluate the profitability of the company’s subsidiary or units. Financial analysts calculate ROIIC by dividing the value obtained after adding the operating income, amortization, and depreciation with the capital expenditures. This calculation of ROIIC operates on the assumption that an average exchange rate prevails for an extended period of time.
Financial analysis
A company may perform financial analysis using various methods. In this paper, I use simple accounting ratios to perform the operational financial analysis of the McDonald’s Company. The ratio I chose to use includes the current debt ratio, net working capital ratio, profit margin and the asset turnover. For each set of ratio, an in-depth analysis will be done to show how the McDonald Company performed during this period. For example, the debt ratio compares the McDonalds’ total debt with the total assets. Managers use this ratio to determine the source of finance for a given company. A low current asset ratio shows that the company does not depend on borrowings. Therefore, the debt is of such a company is low. A high ratio means that the company is dependent on loans and borrowing.
Current debt ratio
This is a brilliant diagnostic tool used to measure the ability of a business to pay its debts in a specific financial period. For a company to show that it can pay its short-term creditors, the debt ratio ought to be greater than one. In some industries like the transport industry, a debt ratio value below one is acceptable. However, in the retail and manufacturing industry a figure greater than one up to a figure of 1.6 is acceptable. The general assumption used by many financial analysts is that in business where the high inventory levels are normal the current ratio will be higher.
The current ratio of the McDonald Company was 1.3860 in 2008. In 2009 and 2010, the values of the current ration were 1.1431 and 1.4937 respectively. This figures show that McDonald Company had the ability to pay its short-term borrowings. Since McDonald is a retailing company, they are required to keep a ratio above one. McDonald’s Company maintained a ratio of greater than one throughout 2008 to 2010. Therefore, the company is able to pay all its short-term debts and there is no need for concern.
Profit Margin
It measures how profitable a business entity is. This ratio is mainly used for comparing internal records. The use of profit ratio to compare different companies is highly inappropriate. This is because different entities operate under different conditions. Therefore, these entities have different expenditure budgets. A low profit margin shows that the business has a small margin of safety. This means that any decline in the sales of the entity will lead to decline in profits of the company. Profit margin information may be use by financial analysts to determine the pricing strategies of a company. Profit margins have several benefits to a company. Managers use profit margin data to determine future pricing of a company’s product. The concept of pricing is important when formulating a strategy to use in a competitive market.
From the statistics in the table, the profit margin of the company increases from one year to the next. In 2008, the profit margin of McDonald’s Corporation was 0.2604. This value increased to 0.2994 in the year 2009 and in 2010, the value was 0.3047. These figures show that the company increased its competitive advantage in the market. Hence, McDonald’s Corporation increased its profitability in successive years of trading. The profit margin values obtained above can be used to regulate the prices of the food and therefore give McDonald’s Corporation competitive advantage over the other restaurants in the market.
Asset Turnover Ratio
This ratio is used to show the extent which a company uses its assets to earn income. Asset turnover ratio therefore evaluates the effectiveness and the efficiency of using a company’s asset. High asset turnover ratio translates to high sales in a company. Companies would generally prefer a higher asset turnover ratio. However, a higher ratio does not necessarily mean that a company is operating at a profit. To analyze profitability another ratio is used. Companies may use the asset turnover ratio to forecast future sales. Asset ratio cannot be used to compare between different companies since in different industries since different companies have different capital requirements.
From the analysis on the table above, the asset turnover ratio indicates that the McDonald’s sales are decreasing. In the year 2008, the asset turnover ratio was 0.5725. This value dropped to 0.5277 and 0.5219 in 2009 and 2010 respectively.
Using this data, we can assume that the company employed less effort in utilizing the assets to increase the sales. This is because during the same period, the value of the assets increased but the level of the sales did not increase with an equal proportion. Therefore, the effectiveness and efficiency of asset utilization by the McDonald’s is low. The McDonald’s may experience losses if they do not employ other effective methods to reduce costs. However, from the statement of financial position the company’s profits are increasing. This means that the company has employed other means to counter the effects of low asset utilization.
Return on Asset (ROA)
To calculate return on asset ratio, the company divides the net income by the average total assets of the company. This ratio is particularly useful to investors in determining whether the company is yielding profits or losses from their activities. It is important for an investor to consider the ROA ratio before financing any project. This is because the ratio provides the investor a general idea on how much he or she should expect as returns from investments.
ROA like Asset turnover ratio varies according to the industry. The distinct difference between ROA and Asset turnover ratio is that ROA is calculated using the net profit figure while asset turnover ratio is calculated using the sales figure. Therefore, ROA is as a better evaluation ratio than asset turnover ratio. This is because it factors in the aspects of company costs. Investors prefer higher ROA figures since it indicates higher profitability from capital investments.
From the analysis above it is clear that the return on capital of the McDonald’s Company is gradually increasing. From a figure of 0.1491 in 2008, the ROA of the company steadily increased to 0.1551 in 2009 and 0.1590 in 2010. This shows that the company is gaining profits from utilization of their asset. However, the use of this ratio does not show the fact that the company is losing sales as the assets increase. Therefore, to get the full picture of how McDonald is gaining and losing, managers must use both the ROA and the asset turnover ratio to analyze the company.
Financial Analysis by Comparing Net Revenue
McDonald’s is going through period of great changes when comparing the year 2008, 2009, and 2010. This becomes very clear when looking at McDonald’s Company net income among the aforementioned years. The company’s net income rises steadily between 2008 and 2010. In the year 2008, the net income is 4313.2 million dollars. This figure rises to 4,946.3 and 4,551.0 million dollars in 2010 and 2009 respectively. The increase in revenue of the McDonald’s Company is due to several factors. One of the factors is the dedication of the parent company toward establishing a recognized brand in the world.
Comparing the Operating Costs
The company shows change by the way they manage their operational cost. The operational costs between 2008 and 2009 fell by approximately 6.89%. This percentage translated to $ 1175.8 million. This is a considerable fall in operational costs. Between the year 2008 and 2010 the operation costs fell by $487 million. This figure represented approximately 2.80% decrease in operation costs.
However, between 2009 and 2010 the company experienced an increase in operational costs by 697.8 million dollars. This represented a rise of approximately 4.39%. Therefore, in terms of operational cost the company has performed well between 2008 and 2010. Nevertheless, the increase that occurred between 2009 and 2010 shows that something is wrong somewhere. It is the responsibility of management to account for the increase in operational costs (Penman, 2001).
Financial Analysis for Currency Transaction
Involvement in global business market requires the McDonald’s Corporation to use foreign currency. However, problems arise in the recording and reporting process. This is because the transactions in foreign countries require managers to measure in terms of the legal tender that is prevailing in a specific region. All transactions conducted in foreign currencies must be expressed in dollars. Managers of subsidiary companies translate the currency in dollars when preparing a financial statement. Currency translation is necessary in all global multinationals. This is because managers cannot complete useful financial statements unless they record all transactions in a common currency.
Moreover, the debtors or creditor recorded in foreign currencies are subject to increase or decrease due to changes in exchange rates. Foreign currencies experience losses and gains due to exchange rates changes. Therefore, companies resort to other strategies in order to minimize the impact of exchange rates. Hedging is a strategy commonly used to reduce the impacts of exchange rates. Hedging is necessary because it enables managers to assess the risk of exposure to foreign exchange rate change. It requires managers to estimate the sensibility of the net cash flow to any drastic changes in the exchange rate.
Financial analysts and operating managers are trained to make the estimates accurately. The use of hedging may lead to the nominal figures being different to the actual exchange rates. Therefore, firms can decide to hedge cheaply. McDonald’s are involved in the global market. Therefore, a financial analysis on the foreign currency transaction is necessary to ensure the company operates smoothly.
Means of Currency Translation
To convert currency from one foreign denomination to another, the value of currency to be translated is usually multiplied by a direct exchange rate. Therefore, financial analysts define translation as the process of converting monetary amounts stated in a specific foreign currency into the currency of the reporting organization. To complete the process of currency conversion, managers require an appropriate exchange rate.
On the other hand, the exchange rate is the ratio between two foreign currencies. This ratio converts one unit of a given foreign currency to another. Economists quote the currency exchange as a spot rate or as forward rate. Spot rate is the rate that the FOREX markets are using now. The forward rate is a future exchange value that may be used sometime in the future. Companies establish the forward rate due to the transactions or contracts that may take place in the future.
McDonald’s use a constant currency results obtained through hedging to convert the currencies procured from the different segments. This is done by obtaining constant exchange value that may be used to convert all the other currencies. The purpose of obtaining constant exchange rate is to reduce the effect caused by translation from one foreign currency to another. Moreover, it reduces the effects of fluctuations and gains from foreign currencies. McDonald’s use the currency values obtained in the current year together with the prior average exchange rate in order to translate the foreign currencies. McDonald’s Company analyzes business financial results using a constant currency. Management use compensation plans to balance the financial results. These incentive compensation plans represent the company business trends better.
Exchange Risk
Exchange risk is the gain or loss experienced due to change in the exchange rate of a given currency. Exchange rate must be unanticipated. Otherwise, it is not a risk (Kostova and Roth, 2002). In case of an exchange rate risk, there are usually gainers and losers. When the exchange rate risk occurs in a multinational like the McDonald, the loser is usually the shareholder. However, the ties between the exchange rate risk and the shareholder are usually minimal. In cases where the shareholder hold shares in different regions, the reducing impacts of exchange rate volatility in one region may be reduced by a positive impacts in another region.
Multinational corporations like McDonald’s are also face with translation exposure. Translation exposure occurs due to the need to report financial standing of the business. Translation exposure is also known as the accounting risk. This is because it occurs during the reporting process. Companies need to convert their currencies into the currency recognized by the parent company. In cases where the exchange rates have changed since the last reporting period translation of assets, liabilities and revenues from the foreign country may result in gain or losses.
Another risk that occurs due to exchange rate is known as transaction exposure. This risk occurs because of transactions that bind the company in the future. As the exchange rates change between the period the contract that was agreed upon and the period the obligations are supposed to be performed, so does the value of the associated currency (Souvik, 2006). This may lead to future losses or gains. For example, McDonald’s’ debts associated with a sale denominated in Japanese Yen or the obligation to repay a euro debt. In the future, the value of these debts will have changed and the parent company may pay more or less depending on the foreign currency exchange rates.
The last form of exchange risk is the operation exposure. Exchange rate changes can alter a company’s future operations (Souvik, 2006). Companies whose operations are affected by exchange rates have operating exposure. Moreover, if the exchange rates affect the levels of revenue in a company, the company is in a weak position. Both the operating and transaction exposure are combined to come up with an exchange risk known as economic exposure (Souvik, 2006).
Recommendation
I suggest formulation of a strategic plan in order to improving McDonald’s position in the market. McDonalds are only present in one hundred and seventeen countries. This means that they have not exploited other potential markets. Therefore, the strategic plan formulated by the Corporation should take into account the idea of entering new markets. Looking at the financial analysis data, there is a possibility that the company may be slipping. In 2009, the company’s operational costs were lower than that of 2010.
Therefore, the strategic plan should include a means to penetrate new markets. This strategy would ensure that McDonalds increase their market share. Another element of the strategy that the company should consider is improving the image of their restaurants around the world. In some countries, McDonalds are not reputable. Therefore, management needs to consider the strategy used in Europe in 2009. This plan led to very high sales in Europe.
If well implemented, the strategy may work for other markets. The company is already maintaining a good current ratio. Therefore, in the new plan they must ensure that this trend is maintained. In the case of pricing, the company should use the profit margin ratio to determine the most competitive prices they can offer while maintaining the profitability of the company. Foreign exchange risk has escalated in recent years. Therefore, McDonald’s corporation needs to “insure” themselves against risk that may arise due to exchange rate fluctuations.
Conclusion
Increase in globalization encouraged the idea financial analysis on a large scale. Financial analysts handle many uncertainties in the global markets. Risks such as foreign exchange risk leads to companies using hedging as a means of protecting themselves from losses. Analysts argue that the accounting the main cause of the uncertainties in the current market is the accounting standard set by different country. McDonald’s Corporation is a multinational that operates using the franchising process.
The company has established various branches in different parts of the world. When compared to other competitors McDonald’s Company is performing extremely well. McDonald’s continue to focus their resources in developing the business. This is because there are opportunities for business growth and long-term profitability in the restaurant industry.
Managers use financial ratios and comparisons to analyze the performance of the McDonald’s. The current debt ratio is a brilliant diagnostic tool used to measure the ability of a business to pay its debts in a specific financial period. This ratio is achieved my managers through the division of current assets and liabilities. Profit margin is the measures how profitable a business entity is. Analysts use this ratio for comparing internal records.
The use of profit ratio to compare different companies is highly inappropriate. Asset turnover ratio is a useful tool for managers. It shows how companies use its assets to generate revenue. Asset turnover ratio evaluates the effectiveness and the efficiency of using a company’s asset. Return on asset ratio is particularly useful to investors in determining whether the company is yielding profits or losses from their activities. It is important for an investor to consider the ROA ratio before financing any project.
Apart from the financial ratios, McDonald Corporation must consider the risks involved in exchange rate. Exchange risk is the gain or loss experienced due to change in the exchange rate of a given currency. Exchange rate must be unanticipated. Otherwise, it is not a risk. Multinational corporations like McDonald’s face translation exposure. Translation exposure occurs due to the need to report financial standing of the business. Transaction exposure occurs because of transactions that bind the company in the future. As the exchange rate changes between the periods the contract ratification and the period the obligations are supposed to be performed, so does the value of the associated currency.
References
Dow, D 2000, ‘A Note on Psychological Distance and Export Market Selection,’ Journal of International Marketing, Vol.8 No.1, pp. 51-64.
Kostova, T. and Roth, K 2002, ‘Adoption of an organizational practice by subsidiaries of multinational corporations: Institutional and relational effects’, Academic Management Journal, Vol. 45 No.1, pp. 215–233.
McDonald’s :Annual Report 2008. Web.
McDonald’s: Annual Report 2009. Web.
McDonald’s: Annual Report 2010. Web.
Ortega, W and Grant, G 2003, ‘Maynard manufacturing: an analysis of GAAP-based and operational earning management techniques’, Strategic Finance, Vol. 15 No. 7, pp. 50-6.
Penman, S 2001, Financial Statement Analysis and Security Valuation, McGraw-Hill/Irwin, New York.
Putilina, I 2010, ‘A Financial Analysis of McDonald’s Corporation’ , Economic Research Center, Vol. 14 No. 12, pp. 1-6.
Souvik, D 2006, Case Studies on Market Entry Strategies, ICFAI Books, Nagarjuna Hills.