Introduction
The preparation of financial statements is an activity that takes place in organizations of all sizes in order to report about the performance of the enterprise. However, it is not sufficient in itself, especially for purposes of decision-making. Financial analysis thus becomes necessary in order to produce information to managers and other stakeholders for the purposes of making decisions regarding their future engagements with the company.
The most common financial analyses performed on financial statements are the horizontal analysis, vertical analysis and ratio analysis. This essay focuses on the ratio analysis of the financial statements of P & F Industries, Inc. For comparison purposes, ratio analysis has also been performed for the company’s major competitor, Stanley, Black and Decker, Inc. The growth potential of P&F Industries has also been analyzed. A recommendation has been made to the company’s CEO based on specific weaknesses identified from the analysis.
Ratio Analysis
Ratio analysis is a way of quantifying relationships between variables in the income statement and the statement of financial position of a company (Ross, Westerfield, & Jordan, 2013). Ratios are computed in order to interpret the financial statements for decision making purposes. There are different types of ratios that include profitability, liquidity, financial leverage, turnover and market value ratios. The ratio analysis of P & F Industries is discussed in the following section:
Liquidity Ratios
These ratios measure a company’s ability to meet its maturing obligations as they fall due (Gibson, 2009). The liquidity ratios of P and F industries for the five years to December 2013 are as follows:
The current ratio indicates that P & F Inc. has been liquid throughout the five years. However, the quick ratio initially showed insolvency, but the trend has been towards solvency as shown by a positive ratio in the year 2013.
Profitability Ratios
These ratios show the management’s effectiveness in utilizing assets to generate sales. The profitability ratios of P and F industries for the past five financial years are as shown in the table below:
The company’s profitability as shown by most of the ratios above has a positive trend, beginning with a loss in the year 2009 and moving towards profitability, except that it declined sharply in the year 2013.
Financial Leverage Ratios
These ratios measure a company’s financial leverage as indicated by the proportion of debt in the company’s capital structure. The key leverage ratios for P and F industries for the five years ended December 2013 are as shown below:
The ratios show a trend towards a reduced proportion of debt, which is desirable for the company. If asked to give credit to the company at present, I would agree to do so because the company is not highly geared as shown by the quick ratio as well as the debt-to-equity ratio.
Turnover Ratios
These ratios measure a company’s ability to utilize its assets in order to generate sales. For P and F industries, the turnover ratios for the five years ended December 2013 are as shown in the table below:
The inventory turnover shows that on average, the company has been replenishing its stocks two times a year, although the frequency increased to three times during the year 2013. The total asset turnover ratio also showed an increasing trend towards year 2013, showing that the company promises better returns in the future.
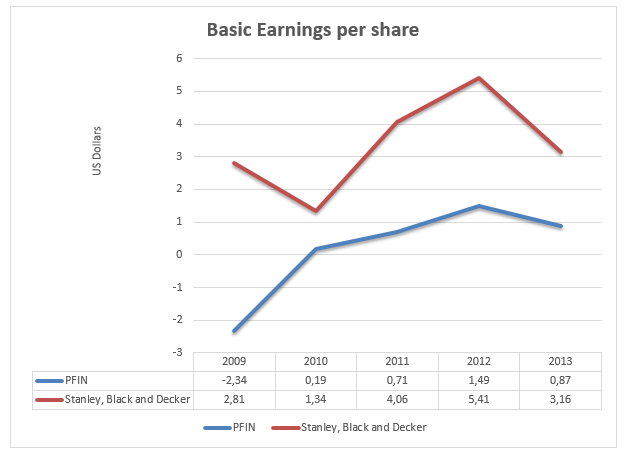
However, compared to its main competitor, Stanley, Black and Decker Inc., the latter has recorded a better performance in the same period as measured by the earnings per share as shown in appendix 2. If I were an investor, I would purchase the shares of PFIN as the earnings per share have shown a general upward trend over the five years.
Conclusions and Recommendation
In general, PFIN has shown a positive trend in performance as depicted by most of the ratios calculated above. The liquidity, profitability and leverage ratios show a high probability that the company’s general performance shall be positive in the future accounting periods. However, I recommend to the CEO of the company that the company should ascertain the optimum stock levels and maintain it at this level so as to minimize holding costs and further improve the liquidity position of the company.
References
Gibson, C. H. (2009). Financial Reporting and Analysis: Using Financial Accounting Information. Mason: South-Western Cengage Learning.
Ross, S., Westerfield, R., & Jordan, B. (2013). Essentials of Corporate Finance. New York: McGraw-Hill Higher Education.
Appendices
Appendix 1: Ratio Analysis for Stanley, Black and Decker, Inc.
Appendix 2: Basic Earnings per Share Analysis of PFIN and Stanley, Black and Decker, Inc.