Company Profile and Financial Highlights
“Asos.com is the credit crunch defying brand” (Esquire, 2010)
ASOS Plc. started its journey as an online fashion providing company in the year 2000. The company rolled out its online e-commerce site having three different language options. The idea was struck as a success immediately and the company was able to acquire a huge client base. The company went on to become a public limited company in 2001. The company’s product profile comprises more than 36,000 external brands and a few home-grown brands as well. In 2010, the company recorded almost 3.6 million registered customers with 1.6 million active members in 167 countries. The company is majorly targeting younger clientele who are between the age of 16 and 34. Since the company has its business model based on low operational costs offering one of the widest varieties of brands in different product lines, the company is considered to be one of the most favored businesses to meet up the challenges of the present financial crisis.
The company has 75% of sales in the UK; whereas, 25% comes from its international sales. The company’s market capitalization is £387 million in 2010. Over the last year, the company has posted a 20% increase in its UK sales while on the other 95% increase was recorded internationally. The company’s sales figure rose sharply from £165 million in 2008/09 to £222 million in 2009/10. The company’s website received more than 900,000 orders in 2009/10 and the average sale per order was more than £23 per transaction. Although, the company experienced a great deal of growth in its business over the last few years, at the same time its costs of operations also increased as a rise in payroll, marketing, and administrative expenses was recorded by the company. The company has not paid dividends over the last few years as it continues to reinvest funds into its expansion programs and it predicts further stronger business in the coming years.
Financial Statement Analysis
The analysis of the financial performance of ASOS Plc is based on past financial figures reported in its annual reports from 2007 to 2010. The analysis is categorically carried out to form opinions regarding the company’s liquidity, profitability, solvency, and investment positions. For this purpose, financial ratio analysis has been performed and the findings from this analysis are provided along with this report as Appendix I. The working clearly shows formulas for calculating these ratios and also financial figures that make up different financial elements as reported in the annual reports.
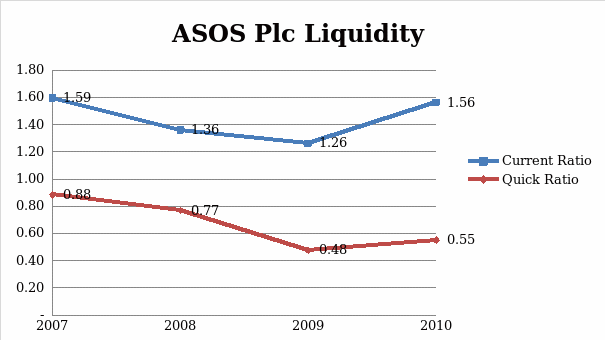
Evaluation of Liquidity
Liquidity ratios are those which are aimed at evaluating the ability of a business to meet its current obligations. These obligations could arise from the creditors or lenders of short-term borrowing (Stice, Stice, & Skousen, 2007). Three different ratios have been calculated for assessing the liquidity position of the company. The current ratio value of the company was 1.59 in 2007 and it declined for the next two years to values of 1.36 in 2008 and 1.26 in 2009. In 2010, it climbed up again to 1.56. The current ratio value is more than once over the last four years suggests that the company is less likely to have problems meeting its current obligations. The company’s cash position has become quite strong as well from only £5.3 million in 2007 to £15.6million in 2010. However, the quick ratio that ignores the value of inventory from the calculation is below one. It implies that the company is holding large volumes of inventory throughout the four years which is resulting in a quick ratio value of less than one for all years. The outcome of the current ratio is supported by the results of net working capital, which remains positive and it has an increasing trend over the last four years. It was reported £4.789 million in 2007 and it increased by 341% in 2010 to £20.934 million. The following graph illustrates values of both current and quick ratios.
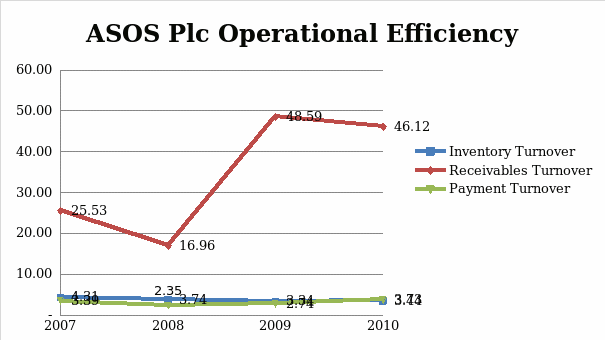
Evaluation of Operational Efficiency
Assessment of the operational efficiency determines how efficiently the company is making use of its assets (Baker & Powell, 2005). The receivables turnover is 46.12 in 2010 as compared to 25.53 in 2007, which has resulted in a lower number of days of receivables pending in the last year ended. This implies that the company can convert its receivable into cash quicker than early years. The inventory turnover has weakened over the last four years from 4.31 in 2007 to 3.44 in 2010. This is mainly due to the higher volume of credit provided by suppliers to the company. This has also raised the number of days that the company holds its inventory. Last year, it was 106 days as compared to 85 days in 2007. Finally, the company’s efficiency to pay its creditors is evaluated using a ratio payment turnover that reveals that the company is quite weak in its payment to creditors as the ratio value remained very low suggesting that the company is taking a very long period to pay off its creditors. The following graph depicts receivables turnover, inventory turnover, and payment turnover.
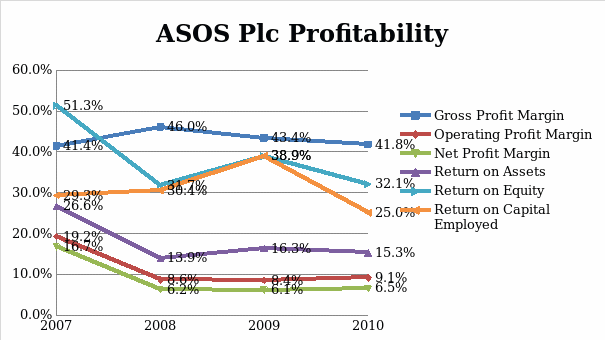
Evaluation of Profitability
Profitability ratios attempt to provide the varying perspective of the company’s ability to generate sufficient turnover and profits from its operations. Different measures could be used for carrying out this analysis (Stice, Stice, & Skousen, 2007). The appendix shows that the company is operating at a higher gross profit margin. Over the last four years, the gross profit margin of the company is well above 41%, which is quite healthy. The highest level was achieved in 2008 when the gross profit margin reached 46%. The company’s operating margin has declined significantly since 2007 when it was 19.2% and in the year 2010, it is only 9.10%. This is mainly due to the inclusion of brands in the company’s product line that has input costs for the company thus, pushing the cost of sales higher. Furthermore, the profitability assessment of the company indicates that the net profit margin has also declined sharply from 16.7% in 2007, 6.2% in 2008, 6.1% in 2009, and finally 6.5% in 2010. Return on assets (ROA) was the highest in 2007 i.e. 26% however, like other ratios the value of ROA also declined over the years i.e. 13.9% in 2008, 16.3% in 2009, and 15.3% in 2010. Shareholders can expect a higher return on their investments as the ROE is quiet for the company over the last four years. From a level of 51.3% in 2007, ROE has declined to yet a reasonable level of 32.1% in 2010. Lastly, return on capital employed is a ratio that seems more relevant to shareholders which leaves out the current liabilities of the company from the calculation of the ratio. The findings may suggest the return that shareholders can expect on the capital employed in the company. ROCE was 29.3% in 2007, 30.4% in 2008, 38.9% in 2009, and 25% in 2010. Such a sharp decline in ROCE has been mainly due to a significant rise in the noncurrent assets.
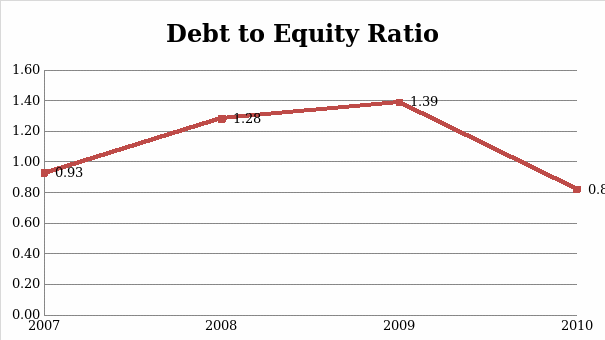
Evaluation of Solvency
Evaluation of the solvency position of ASOS Plc forms an opinion on the long-term perspective of the company’s ability to meet its obligations under debt or credit covenants. Under this category, the debt to equity ratio has been calculated and for this ratio, total liabilities including current and non-current liabilities are used (Stice, Stice, & Skousen, 2007). The debt to equity ratio calculated for the last four years implies that the company is highly financed by external debt. The ratio value was 0.93 in 2007; however, it weakened for the next two years as the ratio value went above one being suggestive of the suppliers’ significant value of credit granted to the company. One positive sign is that the company does not have any non-current liabilities. The debt to equity ratio value in 2010 has declined to 0.82 however, it stays significant. A graph to illustrate debt to equity ratio values over the last four years is provided below:
Evaluation of Investment
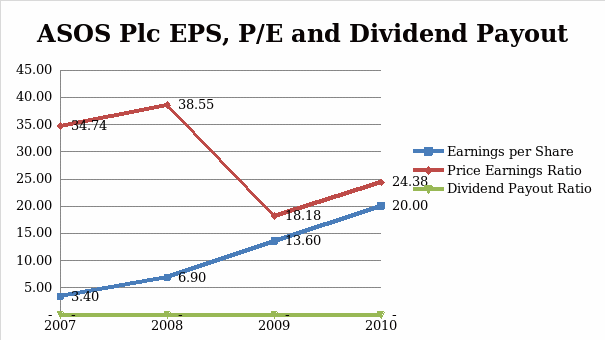
Investment ratios such as EPS, P/E, and Dividend Payout are used for drawing important findings regarding the potential of investments into the company’s stocks. These ratios provide a shareholder’s perspective to the analysis and are important for setting out expectations regarding capitals or returns shareholders can have from their investment in the company’s stocks (Baker & Powell, 2005). Appendix I indicates that the company’s EPS has been increasing over the last four years. In 2007, it was just £3.40; whereas, in 2010 it was up by almost 500% to £20. The shareholders can expect a further increase in the value of the company’s stock as the P/E value is quite high in 2010 i.e. 24.38. Higher P/E over the years that the market is viewing company’s operations positively and the company’s stock is likely to experience further gain in value in the coming periods. The company has not paid any dividends in the last four years. The company makes a claim to support its decision of not paying dividends by suggesting the company needs to reinvest its earnings into improving and expanding its operations. This claim is supported till present as the company has experienced a sharp increase in its sales and earnings over the last four years. A graph representing EPS and P/E ratio values is provided in the following:
Stock Price Trend
The company’s stock prices have been recorded for a period starting September 1, 2010, to December 13, 2010, and are provided in a table appended to this report as Appendix II. The descriptive analysis of the stock prices over six weeks suggests that the variation in the stock prices remains significant. The mean value of the stock price is £1,244p. The standard deviation of the recorded stock prices is £162.6p on either side of the mean value. The company’s stock has been trading within a range where £955p was its minimum and £1618p was its maximum value (Yahoo! Finance, 2010). The minimum value was observed on September 2, 2010, whereas, the maximum was observed on December 13, 2010. The trend in the company’s stock price is illustrated in the following graph:
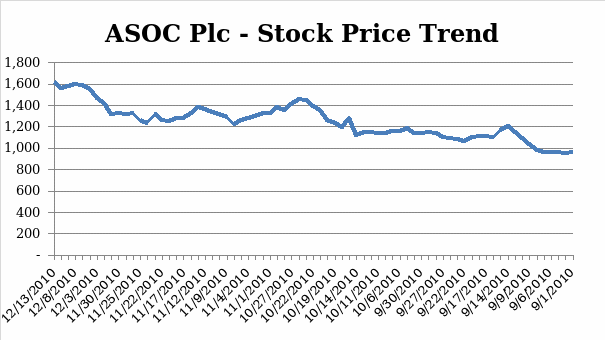
From this graph, it could be suggested that the company’s stock price has an increasing trend that could be observed in the last six weeks. The observed values of the stock prices suggest that the lowest value has not been tested by the market, which could mean that the stock prices although, in a rising trend can test out the minimum value of the stock price to consolidate capital gains made by shareholders on their holdings. On certain dates, some consolidation in the price could also be observed but generally, the price is increasing and on the last day of observation the same trend is predicted.
Conclusion
From the above financial statement analysis and trend analysis of the company’s stock price, there can some important conclusions regarding the company’s financial performance and investment possibilities available to shareholders. The company’s liquidity position seems to be distorted by high values of inventory stock which the company maintains at all times. The analysis of the operational efficiency has contrasting results. The company seems to be efficient to converts its receivables into cash, however, its inventory management and payments to creditors seem to be inefficient as the company is taking a longer period to convert its inventory into sales and pay its creditors. The company’s solvency position is quite strong as the company has not availed any long-term borrowing for funding its operations therefore, it seems reasonable to conclude that the company is less likely to face any financial problems in the long term.
Furthermore, the profitability position of the company has weakened over the years but this could be ignored as the company is attempting to expand its business and attract a larger client base from all around the world, therefore, it is likely to adopt a profit strategy that is acceptable to customers in different countries. Moreover, as the company seeks out high street brands to be sold via its website, therefore, the cost of sales is likely to go up and shrink its gross and net profit margins. The return that shareholders can expect from their investment in the company’s stock is quite high as the company is generated sufficient EPS. The continuously high P/E ratio suggests that shareholders can expect a further increase in the company’s stock price that is also reflective of a rising trend depicted from the last six weeks’ data. One major concern that shareholders could have is that the company has not paid any dividends so far; therefore, it is recommended that the company makes such an offering in the coming periods.
References
ASOS. (2009). ASOS Plc Annual Report & Accounts. London: ASOS Plc.
ASOS. (2010). ASOS Plc Annual Report & Accounts. London: ASOS Plc.
ASOS. (2008). ASOS Plc Annual Report & Accounts. London: ASOS Plc.
Baker, H. K., & Powell, G. E. (2005). Understanding financial management: a practical guide (Vol. 38). London: Wiley-Blackwell.
Esquire. (2010). About ASOS. Web.
Stice, J. D., Stice, E. K., & Skousen, K. F. (2007). Intermediate Accounting. Mason, OH: Thmson Higher Education.
Yahoo! Finance. (2010). Asos Plc (ASC.L). Web.
Appendix I: Financial Ratio Analysis
Appendix II: ASOS Plc – Stock Prices
Source: (Yahoo! Finance, 2010)