Introduction
Edison International (or “EIX”) is part of the electric utility industry. It is presently the holding company for three companies including California Edison Company (SCE), Edison Mission Energy (EME), and Edison Capital. Although the company operates through three segments including that of electric utility operation segment, a power generation segment and financial services segment under separate three companies as stated earlier in the same order respectively, EIX could be safely categorized in the main business of being an electric utility for the purpose of this paper and other business segments could be viewed as supporting its main business (Reuter, 2011a).
This paper seeks to do company ratios analysis, trend analysis and competitors’ analysis for EIX whether the company’s stock is worth investing in compared with competitors. Under the company ratio analysis, liquidity ratios, leverage ratios, coverage, asset utilization ratios, operation ratios, management performance and other relevant ratios are computed as bases for evaluating the company’s liquidity, leverage, profitability and efficiency of the company for the past three years and said ratios will be compared industry averaged primarily. Under the trend analysis, this paper will comment on the important trends as bases for the company’s valuation and determine the future funding needs of the company. This will also involve determining positive trends and their negative implications for EIX and the impact of these trends on the ongoing success of EIX. Under the competitor analysis, the company ratios as identified earlier will be compared with some of its named competitors in the industry and thus the company’s strengths and weaknesses based on ratios will be identified and explained accordingly and to validate preliminary findings made earlier.
Analysis
Company Ratio Analysis
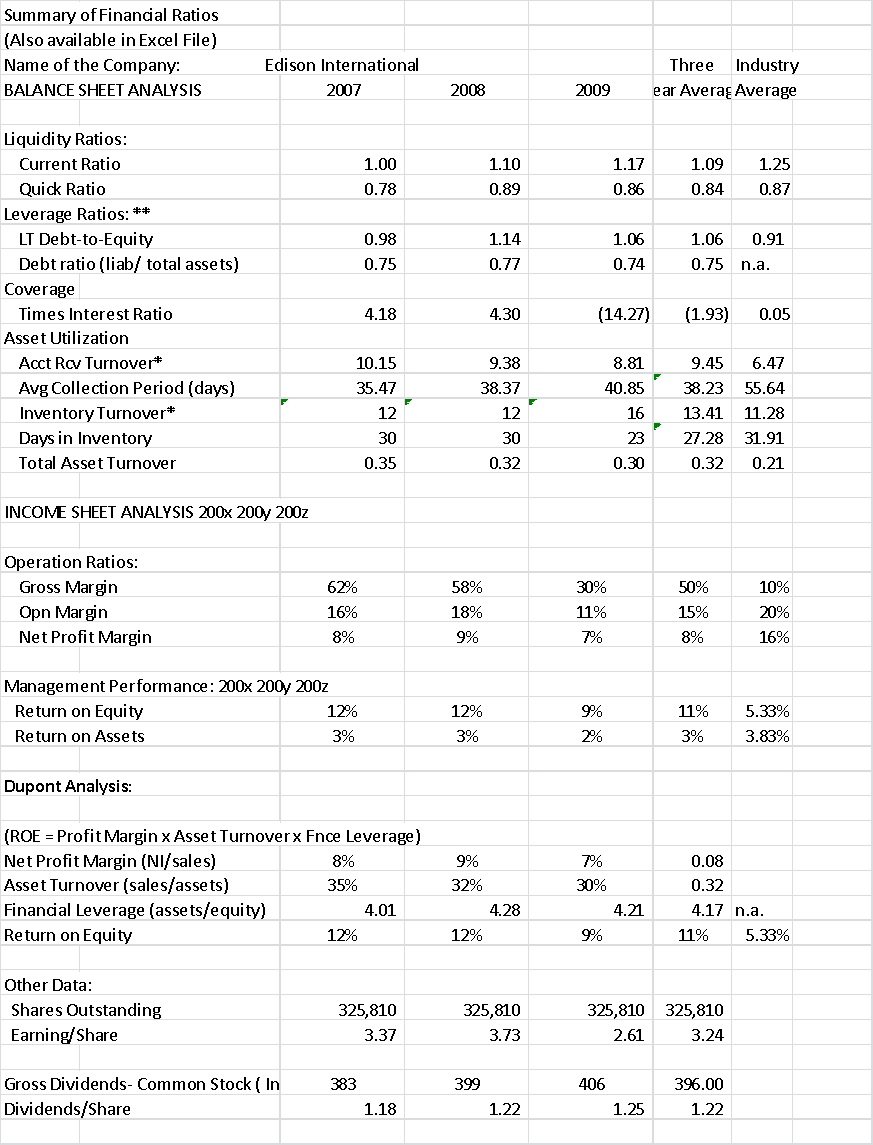
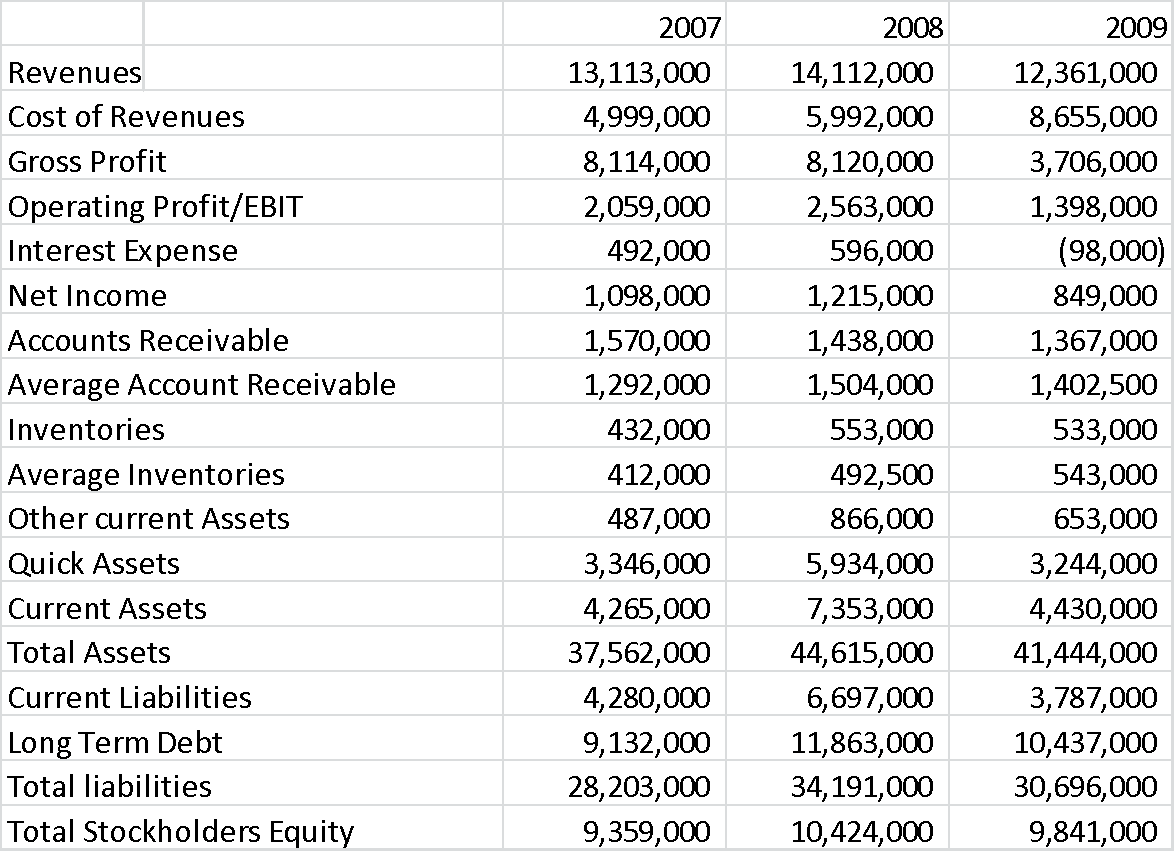
Appendices A and A-1 show the summary of relevant company ratios and the summary of financial data from which the ratios are derived and are should refer to for this part of the analysis.
Liquidity
Under EIX’s liquidity which should indicate its ability to meet a company it’s currently maturing obligations as measured using the current ratio and the quick asset ratio, the company could be generally described as liquid (Helfert, 2001). The latter section of this paper will compare the company with some of its named competitors but its average ratios for the last three years could be generally compared with industry averages to determine the relevant position of the company.
EIX’s average current ratio for the last three years is 1.09 is lower than the industry average of 1.25 while its average quick ratio was reflected at 0.84 against the industry average of 0.87. Both ratios for EIX show a slightly inferior position than industry averages but it can still be asserted that a current ratio of at least 1.0 can be still considered liquid as its current liabilities are still matched by the current assets of the company.
Leverage ratios
Leverage ratios measure EIX’s long-term capacity to keep up its stability over the long term and they can be measured using long-term debt to equity ratio and debt asset ratios (Helfert, 2001). The three-year-average long debt to equity ratio of EIX is 1.06 as against the industry average of 0.91. A higher leverage ratio solvency ratio makes the company riskier than the industry average and would mean that the value of investments from its stockholder is weaker for the company as against its competitors in the industry. It could indicate a higher leverage capital structure for EIX that could endanger its funding needs to make further expansions in the future since this could put the company into a more risky position than present competitors. It could mean less capacity to manage its long terms risk so that lower profitability and efficiency may affect its success for future projects and even its liquidity position and provision of dividends to investors on a regular basis.
Profitability and Management Efficiency
This part uses coverage, asset utilization ratios, operation ratios, management performance and other relevant ratios to measure the financial performance of EIX. Interest times earned for 2007 and 2004 were higher than 4.0 respective which may indicate the company’s capacity to pay interest expense on time but 2009 data for interest expense was negative which indicates a net interest income and not expensive for the said year; thus, the ratio was negative. Compared with the industry average of.05, EIX may be considered capable to pay to cover its interest expenses on time. The average asset utilization ratios are higher compared to industry averages. EIX had both faster inventory turnover and fasted accounts receivable turnover and also faster total asset turnover as against the industry. Even when translated into a number of days of its inventories and receivables, the company’s asset utilization. Hence it would mean better efficiency for the company.
EIX using average gross margin under operation exhibited a significant advantage compared to the industry but its operating and net profit margin averages for the last three appeared otherwise. This would mean that the bottom line ratios or the latter ones are more important and would mean that company is less profitable than the industry average. This finding appears not supported however by the management performance ratios where the company had a higher average return on equity than the industry. The company’s having a lower return on assets may be countered by the fact that the company had higher asset utilization ratios. As further supported by the DuPont analysis, it would be more correct to infer better profitability and better efficiency of the company than the industry with higher return to equity than the industry average.
A three-year average return on equity (ROE) of 11% of EIX shows better superiority about its past performance in relation to the industry average of 5.33%. It must be noted that an average of about 11% return on equity definitely attracts investors, as it would mean that for every 100 US dollars, the investors expect returns of about 11 dollars. These rates could be viewed as something unusual for a company like EIX given the problems in the economy in 2009.
When said average ROE is compared to an average rate of 0.25% if money was invested in a bank, a finding of more than thirty-fold is evident. Given the difference, it must be something not easy to find for investors. The 0.25% is the US base rate of the Federal Reserve Bank is the equivalent of the risk-free-rate investment in the US and could be used as the minimum bank rate (Housepricecrash, 2011).
Trend Analysis
The company’s revenues declined in 2009 compared with 2008 revenues after it had increased from 2007. The decline in revenues was matched with a decline in total assets for the same year. The decline in total assets is reflected in the decline in current assets and quick assets in 2009 from 2008. The receivable and inventory levels for 2009 only slightly declined; thus, the biggest decline came from cash and investment in short-term securities.
The decline in total assets in 2009 was also matched by declines in total liabilities, total stockholders’ equity and current liabilities. It would mean therefore a lesser level of operation in 2009 which may be caused by the economic recession. Such decline in revenues and assets could uncertainty in the near future on whether the decline could continue or not. See Appendix A.
For purposes of valuation and determining the future funding needs of the company, this would mean that the company’s prospects in the future depend much on how the economy performs. When the economy grows because of higher demand for production, the demand for electricity would follow as a result and this would mean better business for the company.
The positive trends identified from EIX financial data and company ratios include the fact that despite the decline in revenues in 2009 compared to 2008, the company was able to produce higher profitability than the industry. This would mean resiliency despite problems in the economy. This would also imply flexibility despite the nature of its business which is basically capital intensive as a public utility. One weak aspect as identified earlier was its weaker leverage ratio compared with the industry which could make it riskier for the company to expand should the economy recover.
Valuation and future funding needs of the company
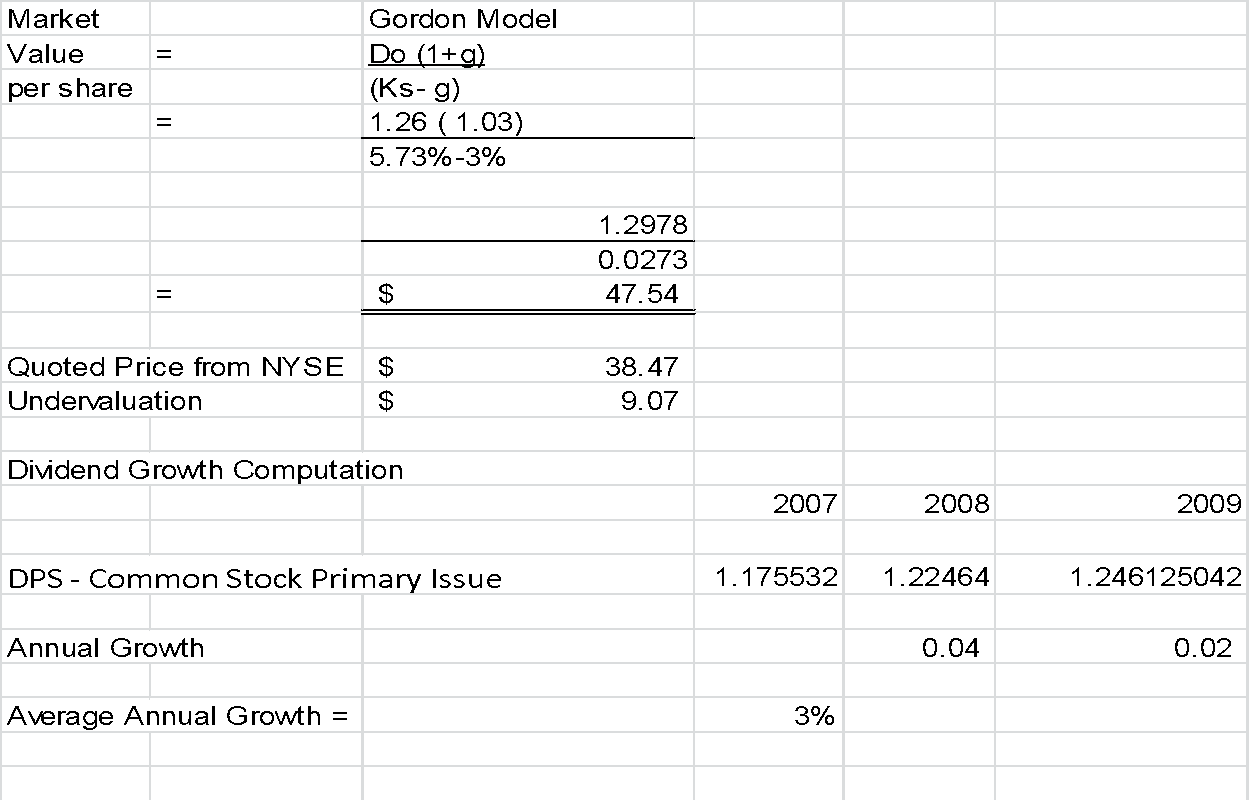
To make a valuation of the stocks EIX requires an estimate of its cost of capital to serve as the discount rate. One way to estimate the cost of capital is to get the reciprocal of the price of the industry price-earnings ratio. The price-earnings ratio is calculated by dividing the average market value per share of industry stock by the average earning per share (Brigham and Houston, 2002). This ratio is an indication of the willingness of investors to buy a share of stock for every level of earnings per share in companies in the utility industry. Using the reciprocal of its latest industry P/E ratio may also produce an estimated cost of capital of 5.73%, which is computed by dividing 1 by the P/E ratio of 17.45.
The computed valuation EIX using the constant growth model (Brigham and Houston, 2002) with a determined growth rate of the dividend per share at 3% per year as computed together estimated cost of capital estimated at 5.73% using the industry’s PE resulted in market value per share of $47.54. This is higher than the present quoted stock price of EIX from the New York Stock Exchange at $38.47. This means that the company’s stock is undervalued and this proves the company profitability despite higher leverage ratios of the company as against the industry. See Appendix B.
Competitor Analysis
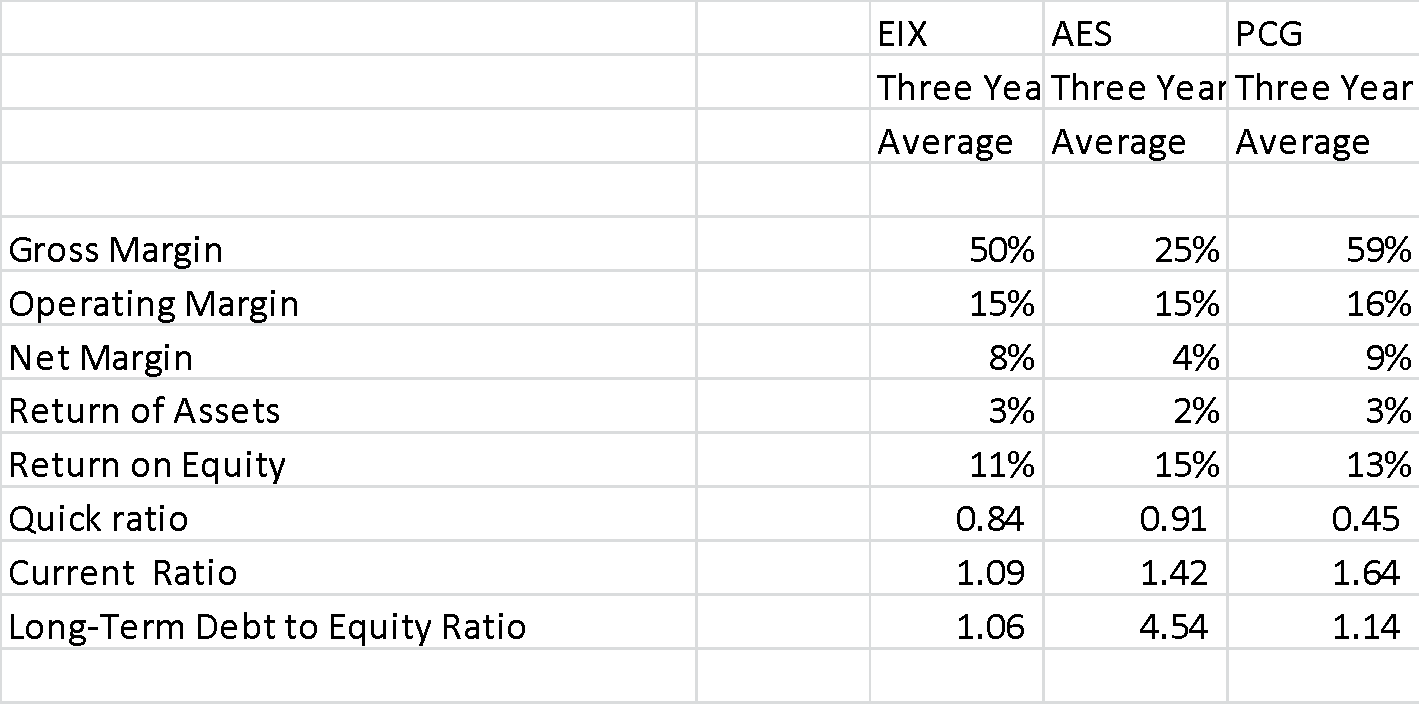
EIX financial ratios were compared generally with the industry earlier but this part will look at two of the company’s two competitors -The AES Corporation (AES) and PG & E Corporation (PCG) and see where the company could be strong or weak based on their comparative ratios.
In terms of their average liquidity for the past three years, the EIX appears to have the lowest current ratio among the three companies with PCG having the highest ratio. But in terms of quick ratio, EIX became second and stronger this time than PCG. Overall, the company is still generally liquid as found earlier since its average current ratio is still above 1. In terms of leverage ratios, the company appears to have the lowest long-term debt to equity ratio among the three. This was despite earlier findings as against the industry that it had a higher ratio. This could make therefore its leverage still acceptable and valid as found in the valuation of its stocks.
In terms of profitability and efficiency, EIX was confirmed to have the highest ROE and one of the highest ROA compared with the other two companies. The detailed comparison, therefore, validates earlier comparison with the industry averages. See Appendix C.
Conclusion and Recommendation
Given EIX’s higher profitability, management efficiency and acceptable liquidity, there are good reasons for investing in the stocks of EIX. With generally high profitability and average efficiency, maintaining the liquidity of the company becomes easier and that may further keep the company stable by eventually reducing its slightly higher leverage position. The results of the valuation using the dividend discount model revealed undervaluation at the present price of $38.47.25 and this is despite declined sales in 2009 and higher leverage ratios than the industry. This paper, therefore, recommends investing with the company company’s stock or holding and any present investment for eventual selling of the same in the near future when the correct price is revealed due to undervaluation as the market corrects itself.
Appendices


References
Brigham and Houston. (2002). Fundamentals of Financial Management, Thomson South-Western, London, UK
Helfert, E. (2001). Financial Analysis: Tools and techniques: a guide for managers.
McGraw-Hill Professional Housepricecrash.co.uk. US Base rate, (2011). Web.
Reuters.com (2011a). Company Overview. Web.
Reuters.com (2011b). Industry ratios. Web.
Yahoo Finance (2011a). Financial Statements. Web.
