Introduction
The analysis of the company is in three aspects financial performance, projection and recommendations. First its financial performance is assessed by reference to its ability to generate income. Ratios of financial efficiency in this respect focus to generate between income and sales and income and assets employed. Second, its financial performance may be assessed in terms of the value of its shares to investors.
Ratio Analysis
I have calculated the following ratios from the financial statement.
Table 2
Using the ratios calculated above, one will make following observations for the management.
Profitability Ratios
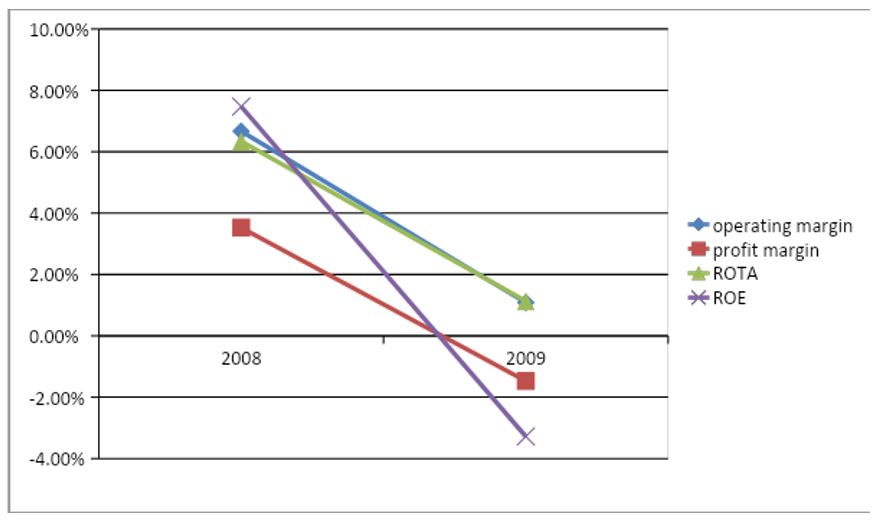
Profitability ratios have shown a downward trend. There is a decline in operating profit from 2008 to 2009 i.e. just 1.67% to 1.08%, also the profit margin has declined to a negative that is from 3.53% to -1.47% this was possible because of an increase in operating expenses. Management has not been able to keep the operating expenses low which means that efficiency reduced. The operating expenses ratio has also gone up which suggests that operating costs are not under control.
Every investment is made with the expectation of a return but so far net profit to proprietary is has gone down from 7.47% to a negative of 3.28%. This means that there is a loss of shareholders’ wealth. The ratio of return on total assets has also gone down from 6.34% to 1.13%. This means that the assets are not well compensated.
Liquidity Ratios
The company under consideration is facing a liquidity problem. I have analyzed both long-term and short-term liquidity ratios and observed that the company is in a very tight liquidity position. The short-term liquidity ratios are concerned is a decline from year to year. The reflection of the current ratio is that the company’s liquidity has ¥ 1.17 for every ¥ 1 liability but it is at decreasing trend. The year 2008 it decreased from 1.23 for 1 liability available. Looking at the calculated quick Ratio shows a downward trend where it is 0.96 for 1 liability which is very dangerous after decreasing from 1.03 for one liability. This ratio reflects that the company does not have quick funds to pay off its current liabilities. Since the quick ratio is less than one in 2009 and is at decreasing trend then the company is facing liquidity problems. Again company’s reliance on cash to offset short-term liabilities is itself worrying and that is the reason that the structure of current assets.
Solvency ratios
In the case of Long Term liquidity whereas company’s debt to total assets ratio are just reversed in the previous year i.e. 52.86% from 55.06% while the ideal debt should comprise less than 50% of the total assets,i.e. for every 1 unit of debt there should be twice assets. The interest time’s component slightly declined in the year 2009 from 2.12:1 to 0.42:1 but it is not sufficient to gain credit facility from the banks. Management has to think about some long-term debt like debentures if bank finance is not available and have to keep the cost of debts reasonably less so that the profit available to proprietary after meeting financing cost is kept genuinely.
Efficiency Ratios
There is a decrease in return on total assets to the tune of 5.21% from 2009 which suggests that the company is earning with a negative growth rate of nearly 5.21% which implies that the capital employed is not earning well. At the same time assets turnover is at a low rate of 1.05 which suggests that the average assets are performing 1.05 times for the year 2009. Similarly, the overall operational efficiency is less than 1 as we know that return on total asset gets diluted if the asset turnover is not in the same trend. Consequently, the return on proprietary gets lower down. Inventory turnover has more or less been the same. In fact, it reduced and now it has reached back to the condition what it was 1 year before. The company needs to work on it because higher inventory turnover will mean the goods are moving at a faster rate. The company needs to work on its demand forecasting methods so that only optimum inventory can be kept and this will lead to lower inventory carrying costs.
The company has earned profit less than the previous year. Not only the absolute profit has decreased but the profitability and rate of return also have decreased over the previous year. As well as the most important aspect of the conversion of profit into liquidity has failed as has been reflected by all the liquidity ratios. Not only the current ratio is weak but the acid test ratio is less than one and there is heavy dependency on one source i.e. cash which may incur a huge cost. Coffee Inventories have a very long holding period – considering the nature of business, blocking the current funds. Moreover, there has been a huge investment in goodwill during the year whereas there has been just a decrease intangible long-term assets which suggest that the management has spent short-term funds on long-term assets which have further resulted in problematic liquidity of the company. T.O of non-current assets is not very impressive and it will take years together to take a turn over from long-term assets. Consequently, there has been a working capital problem. The Company cannot sell the non-current assets to fund the current requirements. The bankers have evaluated the same and are reluctant to fund further. The company is not in a position to generate funds from additional capital as the existing holders do not want to dilute the present holding ratios and the existing holders are not in a position to infuse funds due to their own business position. In such circumstances, if the company wants to survive and to improve the liquidity the management must take the following action (Palepu, 78):
- The company should issue lower interest rate 3-5 years debentures to infuse immediate liquidity.
- Improve the assets turnover ratio.
- Inventory turnover has to be improved drastically and carrying cost has to be reduced as well as the quick conversion of stocks into sales has to be followed.
Budgeting is necessary for estimating the income and expenditure of a business or a part of a business over a specified period of time. Budgeting plays an important role in the success of organizations, and it is vital for a business to have a good budget because it helps the organization in a variety of situations.
A budget is a detailed plan and outline of what the organization wishes to achieve using figures and detailed action plans. It is such a formalized system of planning, forecasting, monitoring, and controlling the use of resources, which managers use to achieve the company’s objectives both in the public sector and private sector because the main responsibility of a manager is to plan for the future and decide what should be done and how it will be achieved. After having a set task, managers can perform better by performing their individual roles. The following is the forecast of the financial performance of Pudong coffee shop for the year 2010.
Projected Income Statement
For the Pudong Coffee Shop
Projected Balance Sheet
For the Pudong Coffee Shop
Projected Cash Flow Statement
For the Pudong Coffee Shop
Assumption
I have made the following assumption while preparing the 2010 budget:
- The sales price per unit is not given to be ¥ 1. Then sales volume equals sales.
- The loan repayment amount remains constant as well as the interest value of the loan is the same.
- The error made in the unaudited accounts of 2009 in the cash balances remains unadjusted.
- Depreciation remains unchanged
- Goodwill will not be amortized for the time being.
- Cost of sales will only be adjusted based on volumes sales and prices remains the same.
Recommendations and conclusions
The manager of Pudong coffee shop should evaluate the capacity of the shop and probably increase the capacity as well as different the products. The capacity decision will have an impact on the ability of Pudong coffee shop to meet future demands; capacity essentially limits the rate of output possible. Having the capacity to satisfy demand can allow Pudong coffee shop to take advantage of tremendous opportunities. Coffee is a popular drink and during the cold seasons, the management may not be able to keep up with demand. Capacity decisions will also help to evaluate operating costs. Capacity and demand requirements will be matched, which will tend to minimize operating costs. Capacity is usually a major determinant of the initial cost. Typically, the greater the capacity of a productive unit, the greater its cost. This does not necessarily imply a one-for-one relationship; larger units tend to cost proportionately less than smaller units.
The main purpose of the existence of Pudong coffee shops is to serve their customers as well as increase the owner’s wealth. Through effective and efficient satisfaction of the customer, the Pudong coffee shop’s performance will increase and this may reflect an overall increased market share. For Pudong coffee shop to attain a competitive edge within its operating market, it has to understand the likes and dislikes of its consumers. Consumer’s decision to patronize Pudong coffee shop is after a thorough intensive analysis of similar shops which are offering coffee. Consumer decision-making can be reflected by his or her behavior which dictates how he or she view the product or service being offered. Consumer behavior is much influenced by various elements such as personal likes and dislikes or individual perception, social status, cultural taboos among other factors. A marketer should understand how to handle these factors through the provision of a product or service which can satisfy their needs or wants appropriately.
Pudong coffee shop has utilized various concepts from consumer behavior to attain a competitive edge within the broadcasting sector. It has embraced the market research concept to determine the current and future needs of the consumer. Through market research, they get information on how to improve and deliver their services. They also get to know who their customers are on matters such as age, gender, social and economic status among others. This enables them on how to retain their customers. Pudong coffee shop knows that today’s needs and wants of a customer cannot be similar to those of tomorrow hence they always run in front of customers in terms of service delivery. Through this, Pudong coffee shops will retain a large market share within the coffee industry (Johnson, Scholes and Whittington, 129).
It can be said that the marketing function supports other functions, and makes sure that the organizational goals are accomplished by providing a detailed analysis of opportunities for growth, and also by offering a proficient approach to selling in well-defined market segments. The strategies of Pudong coffee shop should be created on the basis of its strengths and market-oriented opportunities. For an organization to frame such strategies, the right kind of planning is required. The owners should set realistic objectives that are in tune with the organization’s specific capabilities should be set. These in turn would reflect the performance and success of Pudong coffee shop. It is highly recommended that Pudong coffee shop strongly consider the approach used in operating their business (Hill and Gareth, 78).
The ever-dynamic global market will determine how far the industry will advance. The prediction about how the performance of the industry will proceed is particularly tricky because of the volatility of the global market. The coffee industry will significantly improve because coffee is a beverage that is loved by many. The price does not affect the quantity of the product but the qualities of the coffee consume. The people with extra individuals will continue consuming coffee if they have to because they need it. The price of the raw coffee will affect the pricing of the final drink.
References
Hill, Charles & Gareth, Jones. Strategic Management: An Integrated Approach. New York: Houghton Mifflin, 2007.
Johnson, Gerry, Scholes, Kevin and Whittington, Richard. Exploring Corporate Strategies: Text and Case. New Delhi: Prentice Hall, 2008.
Palepu, Healy, Bernard. Business Analysis & Valuation. New York: Cengage Learning, 2004.