Introduction
This report presents the consequences of disclosing accounting information to the public; the report analysis BHP Billiton stock market prices and the effect of releasing the accounting information to the public plus it also shows how investors reacted to good or bad news. The BHP Billiton’s competitors; Ampella Mining Limited and Altura Mining Limited share prices are analyzed to find out their returns and cumulative residuals which are compared to the BHP Billiton. The announcement was good news to the investors as the cumulative residuals were positive resulting in to increase in share price. The announcement incorporated an increase in earnings which was a result of the company’s ability to control its costs plus it was also efficient in the utilization of the investor’s fund meaning that the company met its major objective of maximization of shareholders’ wealth. It is the recommendation of this report that the company tries to be more efficient in order to generate more returns to both speculators and investors by taking more risky projects which will generate more return in terms of dividends and high capital gains as a result of high fluctuations of share prices.
Objectives
The main objective of this report is to show the consequences of making accounting information on profit known to the public; this is by indicating how BHP Billiton Limited accounting linked information has an effect on the investor or investor behavior through share prices. In addition, it will demonstrate the impact of other factors when evaluating the causal relationships as well as the firm-specific aspects behind the company’s performance.
Company overview
BHP Billiton Limited is an international mining, gas and oil firm with headquarters in Melbourne (Australia) and its main management office is in London (United Kingdom) (Bhpbilliton.com, 2011). The company is the largest mining firm in the world based on generated income and since February 2011, it became the third-largest firm in the world in terms of market capitalization (Answers.com, 2011).
The firm was formed in 2001 with the merging of Anglo-Dutch Billiton Plc and Australian Broken Hill Proprietary Company Limited (BHP) which resulted in a dual-listed firm (Bhpbilliton.com, 2011). In spite of the merger Billiton and BHP carry on with their operation as separate entities, in Australia, BHP Billiton Limited has the majority partner and it is listed on the Australian Securities Exchange (ASX) and is the largest firm in Australia in terms of market capitalization (Bhpbilliton.com, 2011). In the United Kingdom, BHP Billiton Plc is listed on London Stock Exchange and it is part of the FTSE 100 Index; BHP Billiton is also listed on New York Stock Exchange (Answers.com, 2011).
The company deals with coal, aluminum, ferroalloys, copper, titanium, iron ore, diamond, silver and nickel mining sectors, plus gas, liquid natural gas, and oil markets (Bhpbilliton.com, 2011).
In 2004, the company earned income of approximately $25,000 million; it main activities’ are partition into five main divisions, BHP Minerals, BHP Copper, BHP Petroleum, BHP Services Companies and BHP Steel (Answers.com, 2011). BHP Billiton looks up to be the best internationally recognized company in terms of resources. The firm brings together distinctive mixture of competences to connect technologies and resources to the communities and customers advantage worldwide. The company is devoted to the growth of employees, constantly bringing benefits to the clients, adding to the surrounding society and taking care of the environment; it also values honesty, excellence and safety in whatever it do (Bhpbilliton.com, 2011).
BHP Billiton’s main competitors include A-cap resources Limited, A1 Minerals Limited, ABM Resources NL, Abra Mining Limited, Accent resources NL, Adelaide Brighton Limited, Adelaide Resources Limited, Altura Mining Limited, Ampella Mining Limited and other companies operating in the Mining industry (Bhpbilliton.com, 2011). The industry deals with minerals in which there are producers and explorers involved at all levels in all the major minerals such as gold, base metals, precious metals, diamonds, mineral sands, steel and iron ore (Bhpbilliton.com, 2011). This study will only consider Altura Mining Limited and Ampella Mining Limited (Answers.com, 2011).
Altura has created considerable base of precious metals and minerals commodities from exploration and close to production stages; its portfolio ranges from lithium, iron ore, uranium, Zinc, lead, copper, silver and gold plus industrial garnet (Alturamining.com, 2011). Ampella on the other hand, focuses on becoming the number one gold producer in the close future after persistently exploring its portfolio (Ampella.com.au, 2011).
Announcement
The company announced its half year report for the year that ended December 31st 2010 on February 16th 2011which included consolidated report of the BHP Billiton Group, consisting of BHP Billiton Plc and BHP Billiton Limited plus these results were compared to the half year results for the same period in 2009 (Bhpbilliton.com, 2011). The report was prepared in compliance with International Financial Reporting Standards (IFRS) and presented in US dollars (Asx.com.au, 2011).
The company announced that the earnings before interest, tax, depreciation and amortization (EBITDA) had increased by 60% to $17,300 million and the earnings before interest and tax (EBIT) was up by 74% to $14,800 million-plus attributable profit was $10,700 million up by 88% (Asx.com.au, 2011). The announcement also included returns and margins declaration that mirrored an increase to 46% in the basic EBIT margin and to 41% in return on capital (Bhpbilliton.com, 2011). The constant employment of capital in the direction of high-quality development schemes earned half a year of production records crossways five businesses and three commodities. $12,200 million of the functional cash flow and unlevered balance sheet maintains an important investment in the development of organic that is anticipated to surpass $80,000 million in the next five years. The firm also announced an interim dividend of 46 USD cents and an increase of 10% a share (Bhpbilliton.com, 2011).
Expected impact of the announcement
As a result of the announcement made by the company the share price was expected to go up because the investors received the good news of the increase of EBITDA, EBIT as well as an increase in profit by 60%, 74% and 88% respectively.
In addition, the increase in dividends declared may also have contributed to the increase in the share price. The investors both speculators and long-term investors who seek dividend payment were motivated in buying the shares of the company and this resulted into a further increase in demand for the shares thus pushing share price upwards.
Stock Market report
On January 17, 2011, the stock of BHP Billiton Limited was at a high of $45.83 and a volume of 8,854,561 worth of stock was traded closing the day at a price of $45.30 (Tradingroom.com.au, 2011). The lowest price that was earned by the company stock between January, 17 to February, 15 was $44.25 and the highest that was attained was $47.36 this means that the price varied with $3.11 which implies that if a speculator bought one share at a price of $44.25 on January 31, 2011, and sold it on February 15, 2011, he or she would have earned a capital gain of $3.11 (Tradingroom.com.au, 2011).
On February 16, 2011, when the announcement was made the share opened at a price of $46.92 and earned a high price of $47 and a low of $46.41, the stock closed the day at a price of $46.59 with a trading volume of 17,002,700 (Tradingroom.com.au, 2011). On February 17 the stock opened at a price of $46.66 and closed at $46.64 with the highest price of $46.80 and trading volume of 9,144,588 (Tradingroom.com.au, 2011). From February 17 to March 17 the highest and the lowest closing price to be attained was $47.25 and $42.97 respectively this may imply that there was a lot of trading activity that was taking place as speculators were selling their shares and other were buying them thus lowering the price to $42.97 (Tradingroom.com.au, 2011).
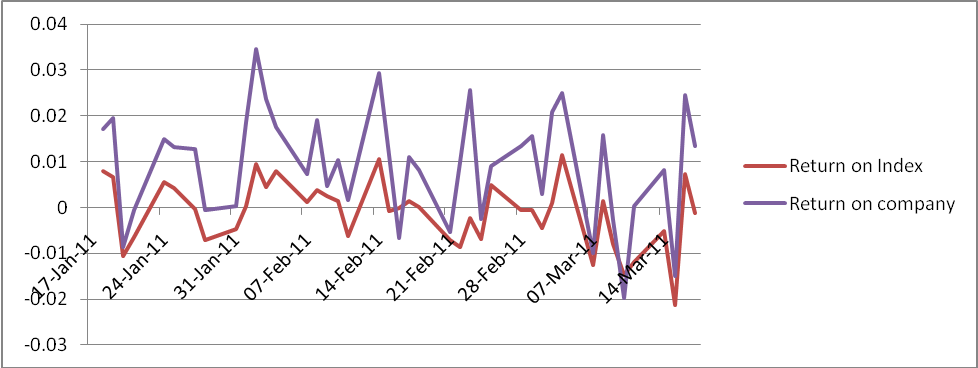
The graph below shows the rates of return for the BHP Billiton and the market, it indicates that the company stock is moving in the same direction with the market relative to their individual means over time.
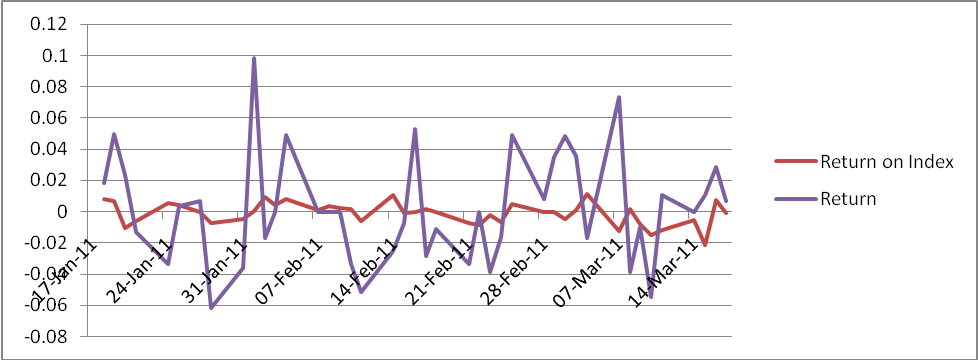
On the other hand, the returns on the company’s competitor Ampella Mining indicates that the competitor’s returns movement relative to the market was not as much as was the case for BHP Billiton, as shown below.
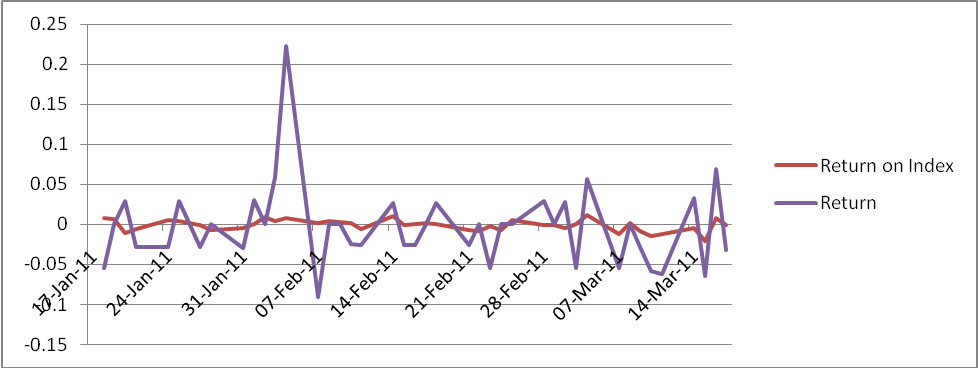
Just like Ampella Mining, Altura Mining returns movements relative to the market were not strong and not as that of BHP Billiton, as shown below (Tradingroom.com.au, 2011).
The above return movements of the competitors can be attributed to low profit made by the companies, which make the investors not invest in them and in reality these two companies do not pay dividends to their long-term investors whose primary motive is to earn dividends. Therefore, there is a possibility that only speculators were buying their shares, besides that the companies may be financing long-term growth and that may be the reason why they do not currently pay dividends. Weighing Ampella Mining and Altura Mining against BHP Billiton, which pays dividends to its shareholders, implies that it may consist of a huge proportion of long-term investors and that is why the company returns movement relative to the market is strong. Based on their covariance between each company’s return and the market they all show a positive relationship meaning that their returns move in the same direction that is, they are above their averages at the same time. But a negative covariance is more preferred than positive covariance which in this case Ampella Mining (0.00003) has almost zero covariance compared to BHP Billiton (0.00007) and Altura Mining (0.00016) (Tradingroom.com.au, 2011).
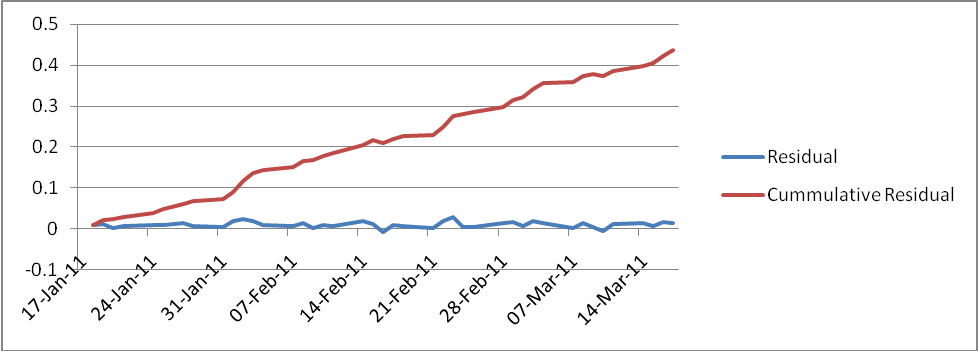
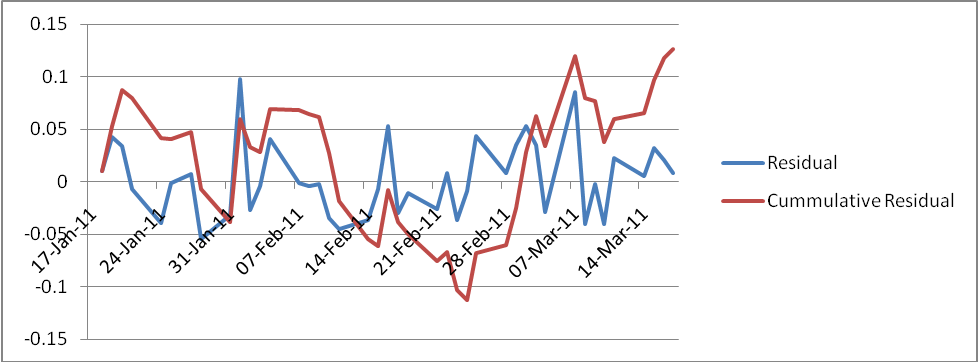
This implies that Ampella Mining may be moving slightly in the opposite direction relative to the market, while BHP Billiton is on average compared to the two competitors. Therefore, investors investing in Ampella Mining are earning more capital gains compared to BHP Billiton and Altura Mining with BHP Billiton’s investors earning average returns. The graph below shows the cumulative residual of BHP Billiton which indicates a positive trend of the residuals implying that the announcement was received by the investors positively as it was good news to them. In addition, it also indicates that the company returns were not random as the cumulative residual did not end with a zero.
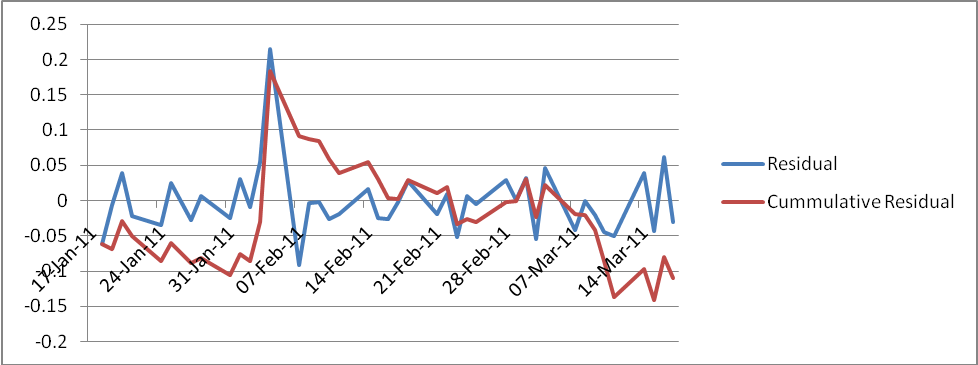
In contrast, Ampella Mining investors may have received some bad news announced by Ampella Mining during the course of its operations, probably from January 20, 2011 to March 3, 2011 which resulted in negative cumulative residuals in that period. The returns of this company are not randomly distributed since the cumulative residual did not end with a zero.
Graph 6 shows Altura Mining cumulative returns, it indicates that the investors of this company reacted to the bad news they received from the company to almost the entire duration of six weeks plus the company’s returns were more or less randomly distributed.
Financial ratios
In 2010, BHP Billiton had a current ratio of 1.93 which means that the company can cover current liabilities 1.93 times more than in 2009 which has a ratio of 1.9. This implies that in 2010 the company was more solvent than in 2009; in 2010, the company was more efficient in using its asset as measured by return on assets as it had 14.32% compared to 7.46% of 2009 thus the investors earned more returns in 2010. The company was also able to control its cost of sales, operating, production and financing cost in 2010 as it shows a net profit margin of 25.99% compared to 11.70% in 2009.
BHP Billiton was efficient in utilization of the owners supplied funds to generate a return to shareholders and the higher the ratio the higher the profitability of the firm; in 2010, for instance, the company had a return to equity ratio of 26.22% which was higher compared to 2009 of 14.71%.
In both years the company is not highly geared as the debt ratio is below 50%, but in 2010, the firm is less geared with a proportion of 29.80% of debt compared to 33.27% in 2009. This means that the firm may have paid back part of the debt owing to the external providers of funds. In 2010, the company generated a lower level of sales through the utilization of its fixed assets as measured by the fixed asset turnover ratio, this means that the efficiency with which the company uses its fixed assets to generate sales had dropped by 0.06 times to 0.83 times.
Conclusion
BHP Billiton stock prices are performing averagely in the market compared to its competitors such as Ampella Mining and Altura Mining, furthermore, the announcement made on February 16, 2011 was good news to the investors as many investors were attracted to buy and sell more shares of the company. The announcement incorporated an increase in earnings which was a result of the company ability to control its costs such as operating, cost of sales, production and financing cost plus it was also efficient in utilization of the investor’s fund meaning that the company met its major objective of maximization of shareholders’ wealth. The company should try to be more efficient in order to generate more returns to both speculators and investors this is by taking more risky projects which will generate more return to the investors in terms of dividends and high capital gains as a result of high fluctuations of share prices.
References
Alturamining.com. (2011). About Altura. Web.
Ampella.com.au. (2011). Company information. Web.
Answers.com. (2011). BHP Billiton. Web.
Asx.com.au. (2011). For Announcement to the market. Web.
Bhpbilliton.com. (2011). About us. Web.
Stockanalysis-on.net. (2011). Financial statements. Web.
Tradingroom.com.au. (2011). Quotes and charts. Web.