Executive Summary
The aim of this report is to give an examination and assessment of the current and potential profitability, and fiscal stability of Telstra Company. Using this we intend to present a recommendation of how we believe Telstra can increase their production. The information includes background information of the Company, industry analysis, market analysis, share analysis, Management team and financial information.
Company Summary
Telstra Corporation Limited is an Australian principal and the largest telecommunications and media Company, supplying “fixed-line, wireless, internet and data communications services to the majority of Australians” (Careerone.com, 2010). It is a global Company that is a major player in the telecommunication industry which provides “telecommunications services and solutions” (TelstraCorporation.org, 2011). Telstra with its various global subsidiaries and distributors supplies a market share that is in over two hundred countries in such continents like Asia Pacific, America and Europe.
Company overview
Since Federation in 1901, Telstra Corporation limited has evolved into many forms to be the global giant that it is today; initially it started as a “Postmaster-General’s Department” that had the mandate to undertake routine postmaster duties such as postal services and telephone operations among others which it gradually graduated from (Careerone.com, 2010).
Initially it was owned by the administration of Australia and has been privatised in phases since late 1990s. In 2000 the company created a coalition with Pacific Century Cyberworks (PCCW), a Hong Kong telecom giant, contributing $3.5 billion for its takeover, creating CSL which was a mobile unit which owned 60% and another subsidiary named Reach which is a worldwide cabling firm (Careerone.com, 2010). In 2002 the remaining 40% of CSL from PCCW was acquired by Telstra and it is here that Telstra came into global limelight. Telstra is headquartered at Telstra Corporate Centre in Melbourne (Careerone.com, 2010).
- The company’s vision: “The partner of choice for the provision of Asia Pacific, European and American communication solutions to the world’s leading Companies and exceeding our customers’ needs by demonstrating exceptional value, service and innovation” (TelstraCorporation.org, 2011).
- Mission statement: “We are committed to delivering customer service excellence and we understand and demonstrate value to our customers” (TelstraCorporation.org, 2011).
- Company Objectives: “We leverage our world class Global Next IP networks, operational excellence and Tier 1 status and provide managed network solutions to larger communication users in America, Europe and Asia Pacific (TelstraCorporation.org, 2011).
Company services
Telstra Corporation offers several services to its customers. These services include; international Roaming capability, mobile phone coverage, automatic switching to Telstra and Telstra plus premium support (TelstraCorporation.org, 2011).
Services description
International roaming – through this services the clients are able to be connected to the network anywhere in the world once they subscribe to Telstra international roaming services. Other services that Telstra offers to its customers include voice calls, short messaging services, multimedia message services, video calling, internet connections among other (TelstraCorporation.org, 2011).
Mobile coverage services of Telstra covers specific regions of the country and cell phone broadband coverage mostly covers the major cities of Australia. It supplies clients with coverage maps for the country depicts cell phone coverage across each State and other regions. Mobile coverage is enhanced through switching to “Next GTM mobile” and shore or offshore coverage when navigating or operating abroad (TelstraCorporation.org, 2011). The other service is described as “Moving Home”; through this services the client does not need to move physically in order to access the service and Billing contacts are updated and new connections given.
Switch to Telstra; this service offers a chance to clients of other Companies to subscribe to specific services of Telstra like house phone, cell phone, internet, and FOXTEL (TelstraCorporation.org, 2011).
Telstra plus premium support; this is a specialist in-house and technical phone support that include wireless net, operating system advancement or personal computer restoration; this service also offers distant support sessions (TelstraCorporation.org, 2011).
Company locations and facilities
Telstra runs one hundred and fifteen branded supplies and one hundred and fifty three licensed shops situated throughout Australia. In addition, Telstra offers a 242 conference hub with superior facility and A/V expertise which can accommodate ceremonies, corporate proceedings, conferences and training seminars among others (TelstraCorporation.org, 2011).
Management summary
The management team of Telstra consist of high quality professionals. The executives and the board of directors are the key figures in the organisation and have various responsibilities allocated to them as far as management of the Company is concerned.
The management team formulate strategies and oversees their implementation by middle and lower level management.
Organisation structure
The company organizational structure consists of “Telstra Retail, Telstra Mobile, Telstra Country Wide, Telstra Wholesale, Telstra International infrastructure Services and Network and Technology Group” (TelstraCorporation.org, 2011). As per the governing body, the centralized regime owns 50.1% of the firm whom are the majority shareholding (TelstraCorporation.org, 2011).
Management team
Telstra board of directors consist of eleven directors and they include “David I. Thodey (CEO), Catherine B. Livingston( The board Chairman), Geoffrey A Cousins, Russell A. Higgins, John p. Mullen, Nora L. Scheinkestel, John V. Stanhope , John M. Stewart, John W Stocker, Steven M. Vamos, and John D. Zeglis (TelstraCorporation.org, 2011).
The Company also has managerial officers consists of; Bruce J. Akhurst , Gordon Ballantyne, Paul Fegan, Paul Geason, Will Irving , Stuart Lee, Kate Mckenzie, Robert Nason, Brendon Riley, Tarek A. Robbiati and Deena Shiff (TelstraCorporation.org, 2011).
Industry analysis
Telstra is part of the Telecommunication services supplier and an Australian giant in the telecommunication industry. It is a key player and has a large market share compared to other players such as Optus, Vodafone and Hutchison merger etc (Reportlinker, 2011).
Market sector
The telecommunication sector in Australia engages in supplying and utilization of electronics equipment and services such as TV, Radio, personal computer and phone for communication. Telstra control a significant market sector since it is already established and has been a monopoly during its early years. The other providers of telecommunications products and services include Optus which is a Singapore Telecommunications company, Powertel and AAPT both of which are from New Zealand, Vodafone and Hutchison, and finally Soul (TelstraCorporation.org, 2011). As we can see there are various players in the telecommunication industry in Australia division because of the fast expansion and technological advancement that has occurred over the last few decades.
Competitors
Optus is Telstra main competitor and Australia’s second biggest telecommunication firm. It’s a Singapore Telecommunication subsidiary which owns other subsidiary such as Virgin Mobile Australia and Boost Mobile, Uecomm and Alphawest (McNamara, 2011). Optus owns and run its net infrastructure and also utilizes the services of other providers of network services such as Telstra Wholesale. Optus offers broadband, dial-up connections and wireless services to the end users and other service providers very similar to service products that Telstra provides. The current Optus market capitalization is $946 million while Telstra is $32.6 billion (McNamara, 2011).
Strategic Alliance
Strategic alliance refers to a covenant between two or more companies to commit funds or asset in order to attain a common aim (McNamara, 2011). In November 2008, Telstra and Microsoft publicized an alliance which was to improve Unified Comms (Optus.com, 2003).
Optus has formed many strategic alliances which are meant to increase efficiency and to surpass Telstra Company; Telstra has the largest market shares. In February 2003 Optus signed an agreement with Transaction Networks Services to build up the subsequently invention of EFTPOS net services (Optus.com, 2003). In June 2005 it partnered with Ninemsn in order to provide innovative internet and cell phone services (Optus.com, 2003). In March 2008 Optus and Google publicized an improved strategic alliance; the alliance was to supply Optus clients with simple access to information and data services (Optus.com, 2003).
Market Analysis
Market analysis means analyzing the figures and determining the pattern or predicting future trends based on financial figures. To a marketer, it involves looking at the marketplace to decide on policies that will assist the firm attain high market share (McGuigan, 2010).
Market capitalisation
To obtain the market capitalisation Telstra shares outstanding are multiplied by the present market value of one share. Telstra Company issued shares capital is 12,443,074,357 and the price per share as per 25th March 2011 is $2.7. Therefore, the market capitalisation is equal to (12,443,074,357 * $2.7) $33,596,300,764 (Fairfaxdigital.com, 2011)
Market segmentation
Market segmentation is dividing a market into sub-segments; this allows the firm to focus on the sub-segments and offer quality products or services. Telstra segments its market with an aim of comprehending and fulfilling its clients wants. This is because Telstra serves an extensive demographic of clients which means it is paramount to segment their products and services as well. Individual persons, families, businesses, small enterprises and big Companies are currently the segments that the Company have (TelstraCorporation.org, 2011).
Share and dividend overview
Earnings per share
The earnings per share are calculated by dividing Net profit with total number of shares. Telstra earnings as per 25th March were $0.26 per share. This means that the investors will earn a dividend of $0.26 for every share held. Dividends are used in calculating price earnings ratio and it shows the profitability of the Company (TelstraCorporation.org, 2011).
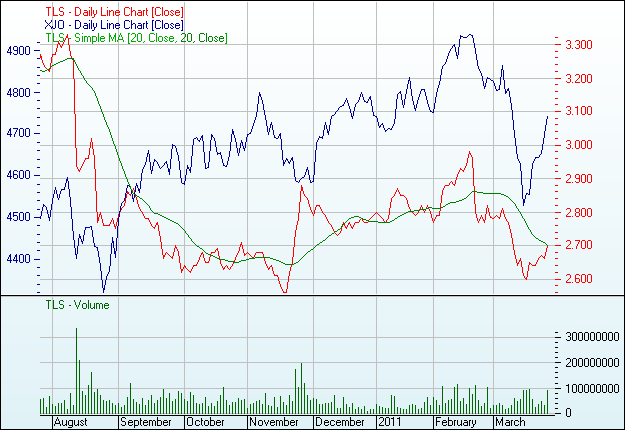
Share price
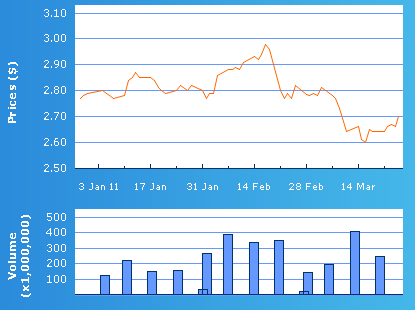
As seen from the share price graph the shareholders engaged in much buying which then started declining in March; thus it a bear market meaning that the price of the shares went down in mid March, as a result of more shares being sold.
Share price history
Telstra share price history for approximately eight months up to 25th March 2011.
From the graph it can be seen that Telstra Corporation Limited shareholders were selling the shares at the beginning of March 2011 and at the end there was a high demand of shares as the price had gone down; thus, the shareholder resulted in more buying than selling.
Share outstanding
The balance sheet extract is for the New Zealand Exchange
From the balance sheet extract shown above it can be seen that Telstra limited, has maintained its common stock at NZD 5,793,000 from 2007 to 2010. This would mean that the company has not issued the right issue to its shareholders in order to raise more capital.
Debenture and other loans outstanding
The above balance sheet extract shows the long term liability not yet paid. But the amount for the year 2011 has decreased due to prepayment of the long term debt.
Financial analysis
The financial analysis consist of data for four years
Balance sheet
Long term loan has decreased meaning that the Company has paid some of its liabilities. The Company has sold some of the asset thus decreasing the amount in 2010. The current asset has increased due to the Company holding much of the inventory, more debtors, cash and cash equivalents.
Profit and loss statement
From the above income statement the net profit for year 2010 has decreased compared to year 2009. This is as a result of increase in cost of operating such as promotion, advertising, etc., it may also be due to increased costs associated with buying and supplying.
Business ratio
The following table shows Telstra ratios for 4 years from 2007 to 2010
From the above figures return on asset has decreased by 2010 from 17.4% to 17.3%, this has resulted in decreased revenues in 2010. Return on equity has also decreased; this is as result of decrease in revenue. The number of times earnings that cover the cost of financing was high in 2007, reduced in 2008, and then increased in 2009; in 2010 there was an increase. This implies that revenue has decreased and debt has increased. The debt equity ratio has also reduced in 2010 as a result of paying back the amount of debt owed.
Conclusion and recommendations
Telstra has a large market share in the Australian market and is a global Company operating in many countries. It has a market capitalisation of $33,596,300,764 and its market price as per 25th March 2011 was $2.7.
Telstra revenues streams in from various sources such as selling products like mobile phones, networks, internet connections, investment in treasury stock etc. In order to increase its revenues the first thing it needs to do is reduce the expenses such as the promotion expenses and also transport or supply cost.
It should also invest in R&D of upcoming technology that will facilitate design of new products and services to attract new customers. It can do this by introducing other services such as send and receive money through mobile phone.
References
ASX. 2011. Telstra Corporation limited. (TLS). Web.
McGuigan, B. 2010. What is market analysis. Web.
CareerOne. 2010. Company profile: Telstra. Web.
Fairfaxdigital. 2011. Telstra corporation Limited. Web.
McNamara, M. 2011. Australia’s Telecommunications Leaders. Web.
Reportlinker. 2011. Australia – Telco Company Profiles – Telstra and Optus. Web.
TelstraCorporation. 2011. Telstra Corporation Ltd Ord.. Web.
Optus. 2003. About Optus. Web.