Financial ratios analysis is a fundamental requirement in every business organization, the most important ratios are profitability, liquidity, gearing and activity or ratios. Profitability ratios are used to determine whether the organization is achieving its’ profitability objective.
In 2010/03 analysis the gross profit margin was19.4%, pre-tax profit margin was1.4%, interest coverage was 8, return on investment 0.8% and return to assets 0.6%. The analysis show the company has high ability to reduce cost of sale (19.4%) and minimal ability of the company assets to generate profit (Thomson, 2009, p. 1). The entire profitability ratio is positive; this indicates the company ability to generate profit. The larger the value, more the organization is profitable. The current ratio was 1.2 and quick ratios 1.0, both are liquidity ratios. They are used to indicate organization working capital position. From the calculation it shows the organization is in a position to meet all their current liability with the assets the organization possesses.
The leverage ratio are used to measure ratio is 2.9 and debt equity ratio is 0.68 for the company. Gearing ratio is used to measure to what extent an organization is funded by internal/owners and external/borrowed funds. It is clear that only a very small part (0.68) of the organization investment is funded by borrowed money. Inventory turnover was 10.9, asset turnover 0.6 and the receivable turnover was 3.2 (Thomson, 2010, p. 1).
The ratio is referred to as the activity/efficiency/turnover ratios, they measure the company efficiency level in carrying out its’ main business. From the computed results it is clear the company is efficient in carrying out its’ activities. Financial analysis is important to every organization, they help in comparisons between firm’s performance, assist in estimation of future company performance by developing projection models and also help determine whether a company is in too much debt.
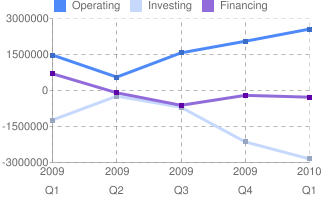
Quartely Trend Analysis
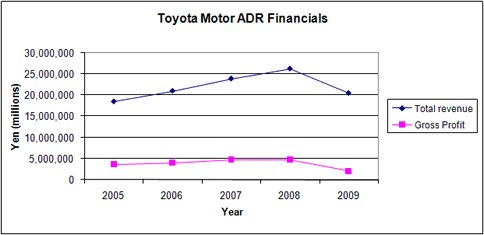
Annualy Trend Analysis
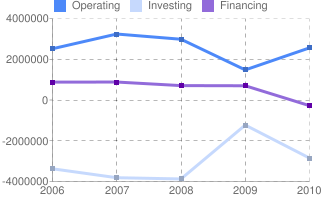
Trend analysis is a statistical terminology, which is used to refer to the act of using past information or variable to identify existence of a tread or identifiable behavior in the information. It is very essential to corporation, as it is used to predict future stock movement using past information. Financial trend analysis is specific type of trend; it uses past financial information to predict future corporation financial status. This help the corporation to plan its’ activity objectively in order to achieve its’ main objectives. Financial trend analysis ensure the corporation understands its’ current financial position, hence undertake corrective or maintenance measures of their financial position (Liraz, 2010, p. 1). It is vital to determine whether the corporation financial status is improving or worsening with time.
Tread analysis is also referred to as the financial horizontal analysis of the corporation. Based on quarterly cash flow trend analysis, the cash from operating activities decreased in the first quarter of 2009, since then it has been increasing for the last four quarters in 2010 (Thomson, 2010, p. 1).This entails the actual corporation undertaking as they relate to the main revenue generating activities off the corporation. Persistent increase in the cash from operating activities means the corporation is operating profitably.
Cash flow from financing activities, decreases in the first two quarters, and increase for one quarter, then becomes almost constant in the last quarter. Financing cash flow activities result from changes in composition and size of equity capital. This means there was change in ownership composition of the corporation for the last four quarters. Investment cash flow activities changes results from disposal or acquisition of long term asset by the corporation. This is a good indicator of whether the corporation asset base is expanding or being depleted. From trend analysis it is clear the asset base is being depleted with time.
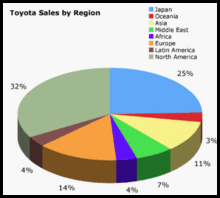
The motor industry is becoming more and more competitive as new and more advance technologies are being discovered. Motor making corporation have to be on their toes always, this helps to maintain a competitive edge over their competitors, as they try to outdo each other. Toyota Motor Corporation has been able to main a cutting edge in sales over other motor corporation. Last year Toyota was the leading selling brand world wide. This was attributed to the diversification of their products to suit and satisfy the varying customers’ requirements. Toyota has more brand than any other automobile maker; they range from classy and expensive to cheap and affordable brands (Liraz, 2010, p. 1). This one of the well exploited strategy by Toyota motors to maintain the lead, ahead of other motor corporations.
Toyota Financial Comparison With Other Competitive Firms
Toyota Motor Corporation undertakes two major sectors in automobile industry, motor vehicles assembling and vehicle bodies. From the analysis Toyota has the highest revenue collection compared to its’ competitions. In the year the company generated US$159.54 billion twice the amount of its’ closest competitor. Contrary to the competitor Toyota has diversified their activities to include several sectors; motor vehicle sales generated 73% of their collection while the remaining 27% was generated from bodies sectors and spare parts. Most of heir competitor rely more on motor vehicle sales alone, hence Toyota having an edge over them. Also due to its’ wide market range spanning world wide, Toyota has been able to outdo other automobile maker in the market.
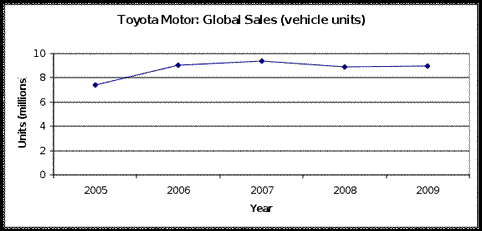
Toyota motors has its’ own share of financial down tread in the recent past, like the rest of motor corporations it was not spared in the effect of 2008 credit crunch. Although it was not extensively affected like some of the other corporations, it experienced a down tread in its’ sales. As the financial markets and institutions suffered the effect of the credit crises, the effect were passed on to other industries including automobile industry. This leads to decline in consumer purchasing power, as a result the sale of Toyota brand declined significantly. This was attributed to the reduced financial liquidity in the market, and financing a loan become expensive.
Recently, recall of one of their brand due to a sticky accelerator and steering control malfunction has negatively impacted on its’ financial status especially in America. The sale of the brand has plummeted and it had to recall some of the vehicles already sold out to rectify the error (“Financial Ratios”, 2002, p. 1). This has necessitated the corporation to embark on research to the causes of the malfunction and rectify it to avoid further problems. Safety and quality assurance initiative have been rolled out to curb the escalating situation as more models are being recalled. The drive is meant to assure the Toyota customers their vehicle is safe and do not pose a threat to their life. Most the recent financial crises have been attributed to the fast growth rate of the corporation.
All in all, Toyota has managed to fully establish itself as the leading motor corporation and stick to their slogan “The car ahead of you is always a Toyota”.
Reference List
Internet Center for Management. (2002). Financial Ratios. Web.
Liraz, M. (2010). Financial Ratio Analysis. Web.
Thomson, R. (2009). Toyota Motor ADR: Financial Statement. Web.
Thomson, R. (2010). Toyota Motor Corporation Financials. Web.