Introduction
The objective of this report is to apply theory of corporate finance to a real organisation and this paper selects Domino’s Pizza Enterprises. However, Domino’s Pizza is recognised as the world’s leading pizza delivery company – its proficiency and fervour of offering delicious and appetizing pizzas has provided the business with loads of awards and the reliability of billions of pizza enthusiasts throughout the globe.
Domino’s Pizza Group Limited has fully owned by the Domino’s Pizza UK & IRL plc that has quoted on the main market of the London Stock Exchange; moreover, the company’s first UK store initiated in 1985 and the first Irish store initiated in 1991, which now sells and supplies pizzas under the Domino’s Pizza brand name all over the world.
Being founded in 1960, Domino’s was headquartered in Ann Arbor, Michigan, which turned out to be so successful that it now operates through a network of 9,351 company-owned and franchise-stores in fifty states and approximately in 65 international-markets – pioneering the concept of efficient delivery of made-to-order pizzas, it is part of innovations that have significantly impacted the delivery industries. However, this report will only concentrate on the Domino’s Pizza Australia to analyze risk profile, the sources of risk and the risk management strategies, capital structure and dividend structure of the company.
The Risk
Product development of the Dominos Pizza earnestly follows continuous improvements including innovative food items to uphold their market leadership in the Pizza Industry. Contributing best efforts to satisfy consumers are not always risk free but Dominos has treated these allied risks as an effective tool to shine their products lines, and hence delight their consumers better than earlier.
Risk profile
According to the requirement of the paper, the risk profile of Domino’s Pizza Australia has assembled through three components namely, share market features, capital structure and finance through debt and equity. 16 May 2005, Domino’s Pizza has enlisted in the Australian Securities Exchange (ASX) as DMP.AX and at the beginning of their listing, they has able to prove them as a perfect stock though they are not blockbuster in the Australian Security Market.
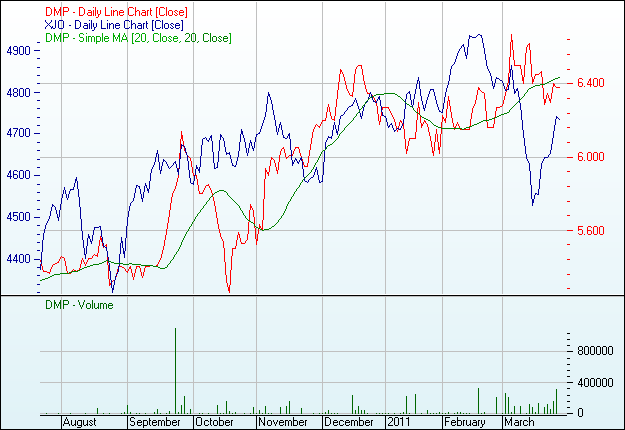
For instance, at the end of five years of their listing during 31 May 2010, share price of the Company increased about 146.0 % and according to the ASX 200 Accumulation Index report, Dominos gained about 34.0 %. In short, high returns of Domino’s investment make them one of the successful stocks and hence provide excellent opportunity of reinvestment. Besides reinvestment opportunity with high return, risk profile of the Domino’s Pizza Australia has attributed through several features they are –
- reinvestment opportunities with low return stock where Domino’s cost of capital can able to earn small amount of margin as well as low organic growth but positive return has capable to neutralise risk variables.
- Small number of reinvestment scopes with high return.
- Lots of reinvestment opportunities with high return where Domino’s Pizza Australia has conducts international operations through exporting, for example, trade–off with USA, Europe and New Zealand (Howitt, 2010).
Deloitte (2009) identified the most prominent risk concerned with Domino’s Pizza Enterprises has exposed to managing its bank , banks are less willing to provide financing for its franchising outlets and such non-cooperation from bank has generated another dimension of risk. Moreover, the socks of global financial crisis and decreasing revenue generation in 2009, reducing corporate owned outlets from 150 to 80 have furnished the indication of the company’s risk profile for further expansion or investment.
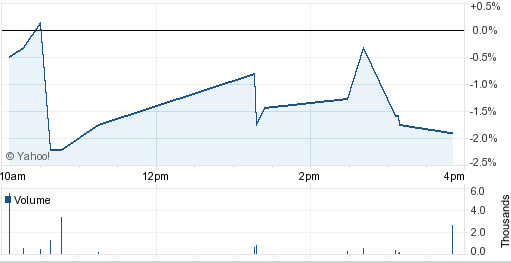
On the other hand, satisfactory debt return as well as self–financing growth of the Company has enriched their investment volume though recent global recession has influenced to reducing their capital sources as well as equity share compared to the previous fiscal year. For more clarification, here is the chart of recent Domino’s Pizza Australia share market profile (Yahoo Finance, 2011).
Debt and Equity Report
Despite tough economic downturn and natural calamity in Netherlands, Domino’s Pizza Australia has successfully able to hold + 3.68% sales growth during first half of 2010 and at the end of 2010, aggregate growth rate of the Domino’s was + 1.75%. Alternatively, earning growth was 15.10 % greater than in 2010 compared to 2009.
For instance, in 2010 Domino’s EBITDA was about AUS $ 32.50 million and consequently, for last three years Domino’s cash surpluses as well as satisfactory earning growth conveyed a stronger net debt position. Point should to notice that, Domino has classified their debt and equity as a tool liability as well as an organ of the business operation deed. To illustrate debt and equity profile, Domino’s has termed these two organs as a tool of their liability.
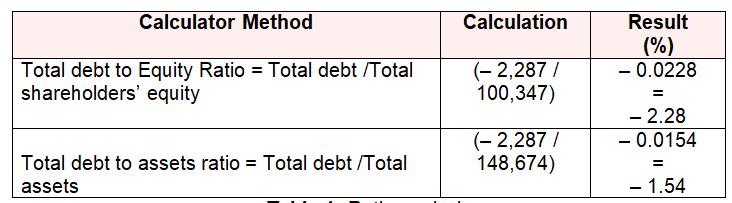
Conversely, equity is an instrument of deed where residual interest required attaching in the entire assets of the Domino after deducting entire Company liabilities. Here is the calculation of debt to equity ratio and debt to asset ratio of Domino’s Pizza Australia at the end of 2010 (Drake, 2011) and Domino’s Pizza (2010).
Here,
Total Debt = AUS $ – 2,287
Total Shareholders’ Equity = AUS $ 100,347
Total Asset = AUS $ 148,674 (In order to define Domino’s self-financing ability compare to their equity holders contribution)
The Sources of Risk
The Dominos is a famous multi–domestic entity and therefore, it has required coordinating both domestic and international financial resources as well as diverse risks components. Following are the most significant sources of risks of the Company. (Domino’s 2010)
Capital Risk
Deficient of balanced capital structure and incompetent to harmonise debt and equity sources of the firm for a handsome return to their stakeholders are the chief reasons of capital risk. Domino’s capital structure has formed through respectively as debt, cash, cash equivalents, refundable equities towards stakeholders, reserves and retains earnings. To mitigate capital risks Domino’s consolidated entity has not authorised to acknowledge externally imposed capital deed.
Market Risk
Domino’s market risks have consists of three attributes namely, foreign currency, fair value of interest rates and price variables. Fluctuation of these attributes has severely hampered financial operations of the firm and sensitivity analysis is the most common method of Dominos to exposure of market risks and policies.
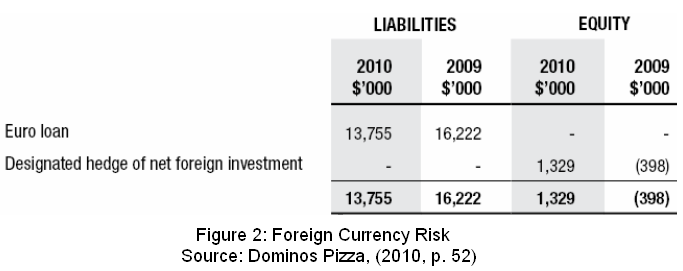
Foreign Currency Risk
Principally, Dominos Australia has transacted through Australian dollars (AUS $) as a result, DPE has featured through numerous currency exchange risks during conducting their domestic business operations as well as financial transactions. Conversely, in order to neutralise DPE currency crisis associated along with the transaction risks and also smoother business transaction with the European and New Zealand markets, Dominos preferred both Euro (€) and New Zealand dollar (NZD)
Interest Rate Risk
Common attribute of interest rate risks are always erratic against investment borrowed from the stakeholders and for this reason, Domino’s risk policies are to taking swap contract as well as application of hedging operations and strategies in order to neutralise interest risk variables and additionally, for an shock free cash flow report. Conversely, Domino’s has avoided the interest rate risk by reducing interest expenses along with practise of several interest rate circular flows.
Credit Risk
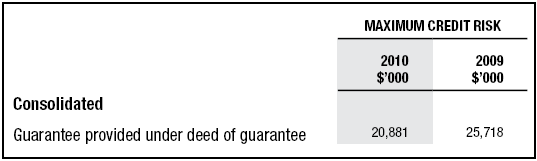
Credit risk is a default position of a franchisee due to financial loss against the deed of a business operation. In order to neutralise credit risk as well as financial defaults financial institutes like bank or other investment company’s has followed several policies whilst dealt with the creditworthy partners. Domino’s Pizza Australia has mostly followed impose limit on the credit exposure repeatedly.
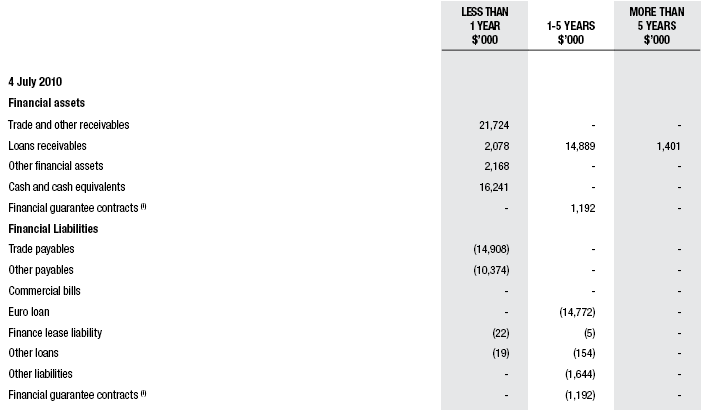
As a result, high credit rating banks as well as correspondence international agencies cannot get any scope to derivative financial tools of the Domino’s Pizza Australia. Maximum level of credit risk of Domino’s Pizza Australia has plotted in following table.
Liquidity Risk
Perison, et al (2006, p.187) stated that the term liquidity risk involves in the crisis of cash or cash equivalents and Domino’s Pizza Australia manages their liquidity risks through preserving sufficient cash reserves, bank loans, and reserve of shareholders’ equity. Alternatively, Domino’s has more conscious on monitoring and evaluating actual cash flows regularly and additionally, construct a balance profile among matured values of Company assets and liabilities. On the contrary, Domino’s Pizza Australia has expert to list of additional indrawn resources for reducing future liquidity risks as well as Company disposal.
Major financial risks are included liquidity risks, interest rate risk and credit risk. Turmoil in share market mobilise liquidity risks and frequently is a cause of liquidity crisis, volume of capital structure required to emphasise on interest rate where lower interest rate make healthier capital volume and conversely high interest rate hampered investment process and finally debt and equity financing has influenced through credit risks where debt liability minimise possibility of equity return.
Hypothetically, profitability has a key focus on firm’s total asset, total sales and total expenses. Sound sales volume and lower expanse boosts profitability therefore asset volume of a company also magnify accordingly. Conversely, downturn in profitability has also negative impact on share market as well as future earning. Moreover, low profitability is also a fact of liquidity crisis in terms of share capital as a result cost of capital increase and make obstacle-financing sources.
The Risk Management Strategies
In the light of previously mentioned sources of risks, Domino’s business operations have rationally required to deal with several classes of risks like business risks, entrepreneurial risks as well as operational risks. Being a market leader and proactive decision maker Dominos has constructed a Board to perform strategically to mitigate risks and hence pursued following principles. (Domino’s 2010)
Firstly, whilst Dominos has determined to start of new projects or amendment of current business strategies, Risk Management Committee or Board has justify whether common risks factors of the Company would be either fruitful or brought loss and hence formulate risks minimising strategies to modify those risks.
Secondly, for a specific risk dynamics, other than internal Board discussion Chief of the Board has also discovered external strategy estimation areas to utilise sensibly best resolve methods for any of the Company crises.
Third, for the financial risks management joint effort of the Domino’s CEO and CFO (Chief Executive Officer and Chief Financial Officer) have earnestly examined all of the financial reports and statements and subsequently ensured that all of the financial reports are fairly verified before submit to the audit committee.
Four, another effective strategy of the Company during risk management is to harmonise risk mitigation strategies through assist of appropriate insurances. Additionally, Company has encourage strategic recommendation of the brokers and insurers in order to resolve unusual Company risks those critically hampered or fluctuated regular flow of the Company’s performance (Howitt, 2010).
Finally, to more effectively implement risk management strategies as well as review internal functions, Domino’s has published an annual report aside from the risk management Board. Moreover, the Business Operation Management Body of the Company has recommended reviewing risk management strategies for best practice of every single part of the business operations by avoiding material business risks.
On the other hand, internal control of the Dominos has structured in accordance with the Section 295A of Company Act where all of the financial reporting has rigorously required performing entire material issues with the assurance and declaration of the CEO and CFO to overcome or manage liquidity risk, interest rate risk, credit risk and foreign currency risk.
The Capital Structure
Capital structure of Domino’s Pizza Australia has consisted of six components and point should to notice that Domino’s has not yet authorised any capital requirements those imposed through externally. Principally Domino’s is a self-financing company and investment policy of the firm has not yet allowed any external influence and enforceability on investments. Domino’s capital components are
- debt capital including borrowings,
- cash and equivalent cash resources,
- attributable shareholders’ equity,
- issued capital,
- reserves and
- retain earnings.
Since a multi-domestic entity Domino has primarily designed their capital resources throughout their subsidiary companies from the establish market segments as well as their international trading partners. Here are Domino’s composition style and capital tools preference method. (Domino’s Pizza, 2010)
Composition Style
Domino’s Pizza (2010) reported that principally, Domino’s Pizza Australia composed their capital profile in terms of acquisitions of subsidiaries where business segment’s reports are also required to utilise this module. The Consolidated Group of Domino has taken policies to quantify and effective their acquisitions at the beginning date of transaction like acquiring assets, incurred liabilities, issue of share capital or any other exchange of capital resources.
Entire costs associated during acquisition have also noticed in defining annual profit or loss. Alternatively, cost of acquisition has also expressed through an adjusted value of fair value of exchange rates during analysing profit and loss account. Composition manner of Domino’s has also required adjusting fair value of interest rates during acquisition where prior complete income of the company should to reclassify and additionally, disposed interest rates are also required to follow the manner.
On the other hand, Domino’s borrowing are treated as a temporary capital component and key attribute of this source is to deduct borrowings costs from all of the quantifying assets as an expenditure while capitalisation. Moreover, lease payments also treated as a financial expanse, which has required deducting from liability segment of Domino’s.
Currently, weighted average capitalisation rate (WACR) of the company is annually 4.90 %, which has effective on borrowing amounts and recent fiscal year has not yet required paying any depreciation expense against their asset costs. Finally, issued shares to grow capital of the firm is now 68, 407, 67 shares in terms of ordinary share capital. The capital composition is acquisition of subsidiaries, issue of share capital, and acquires new assets, and significantly consideration of fair value of interest rates.
Preference Method
According to the Domino’s (2010), preference modes of capital structure of Domino’s Pizza Australia has drawn through several policies where every components financial resources are termed distinctively during reporting income and expense profile. Preference method of Domino’s categorise tax payment, distribution of dividend and debt maturity repayments as an operating cash flow and borrowings in a certain financial period preferred issue of share capitals to meet demand of potential Domino’s financial requirements.
At the end of capital preference method, it has noticed that balance of entire capital resources though dividend distribution, issue of share capital and either issuing debt or current debt rescue and Consolidated Group of Domino’s Pizza Australia has essentially acknowledged all of risk factors as well as capital costs.
The Debt /Equity ratio = Total Liabilities/ Shareholders’ Equity
= 32,017/ 125,038 – 32,017
= 0.34419096 or 34.419%
The Debt /Equity ratio Domino’s Pizza 2010 = 0.34419096 or 34.419%
This indicates that for every AUS $ of Domino’s Pizza owned by the shareholders, Domino’s Pizza owes $0.34 to creditors.
Above calculation demonstrates the debt-equity ratio of Domino’s has been fluctuating for last six years, which is directly concerned with the profit and dividend policy, for the earning fluctuation as a result, polughing back of profit fluctuates. On the other hand, while the Domino’s adopted conservative dividend policy, the retained earning increased, and debt-equity ratio of Domino’s decreases, meanwhile the competitors of Domino’s. However, the financial data of the competitors of Domino’s are not available in the Internet or local database resources, thus this researcher may not be able to compare their financial ratios.
In conclusion, Domino’s Pizza is adopted capital structure because financing decisions are reactive, and the aim of the company to be successful in long run along with rising funds to finance their activities; so, it is important to maximise the use of the funds more easily in difficult economic condition.
The Dividend Structure
Hypothetically, dividend is the monetary benefit that recognised and provided by the Consolidated Group of an organization against their shareholders’ investment. In another word, it has also defined as the dividend revenue crafted from the stakeholders’ investment. At the end of 2009–10 fiscal years, Consolidate Body of Domino’s Pizza Australia felt delight to announce of 17.80 cents for every share since, its i-Phone ordering application carried high return against their investment.
Amazing offer of i-phone ordering application has dramatically boost Domino’s sales volume as a result sound sales after profit enable them to issue more dividend compare to previous fiscal year. Conversely, during fiscal year 2008–09, Domino’s Pizza Australia paid only 8.0 cents against every share where 30.0 % corporate income tax was required to pay by the shareholders.
In case of interim dividend payment, Domino’s Pizza Australia announced to pay 6.0 cents for every fully paid ordinary share along with 30.0 % corporate income tax. Finally, at the end of June 2010, Consolidated Body of Domino’s Pizza Australia declared to pay 11.80 cents for every fully paid ordinary share consisting 30.0 % corporate income tax. (Domino’s 2010)
Yield
In simpler form, yield or dividend is quantified required rate of return from a predetermined year (Netessine and Shumsky, 2002). There have a strong affiliation among yield, interest rates and present value of an investment. Increase of interest rates is cause of reducing future value or yield of investment and conversely, low interest rates carried higher rate of return or yield (Netessine and Shumsky 2002).
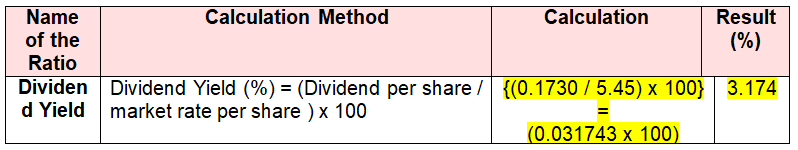
Utilisation tools of an effective yield; Domino’s Pizza Australia has capable to appraise their resources whether it is expensive or economical in generating profit margin as well as return of their entire debts. Since of satisfactory required rate of return Domino’s Pizza Australia has occupied 43.50 % greater NAPT than previous year. Here is the calculation of dividend yield of Domino’s Pizza Australia at the end of 2010. (Domino’s 2010)
Dividend Per Share = AUS 17.30 cents or AUS $ 0.1730
Share Price = AUS $ 5.45
Payout Ratio
Payout ratio is the most significant tools of an organization to quantify profitability during a fiscal year and hence, it has rather easier for an organisation to identify investment areas. Payout ratio is also termed as dividend cover technique through which dividend payment as well as stable and sustainable profitability has easily discovered.
Higher dividend cover or payout ratio refers that scope of company’s future reinvestment is limited as well as dividend payment is also difficult for the fiscal year. Conversely, low payout ratio occupied larger reinvestment scope along with handsome dividend payment.
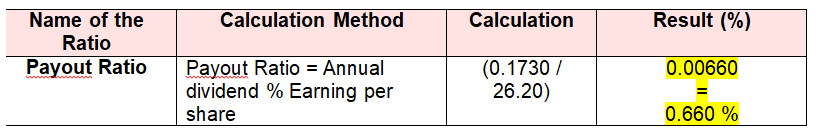
In short, low payout fraction of an organization represents safer company position in the industry market with satisfactory dividend payment potentiality (Block & Hirt, 2005). Here is the calculation of payout ratio of Domino’s Pizza Australia at the end of 2010 that refers low reinvestment scope in future since of high payout ratio (Domino’s Pizza, 2010).
Annual Dividend = AUS 17.30 cents or AUS $ 0.1730
Earning Per Share = AUS $ 26.20
Competition among Industry Rivals
Zeitner (2001, p.12-13) provided a comparison chart for the Australian fast food industry considering sales, and number of outlets –
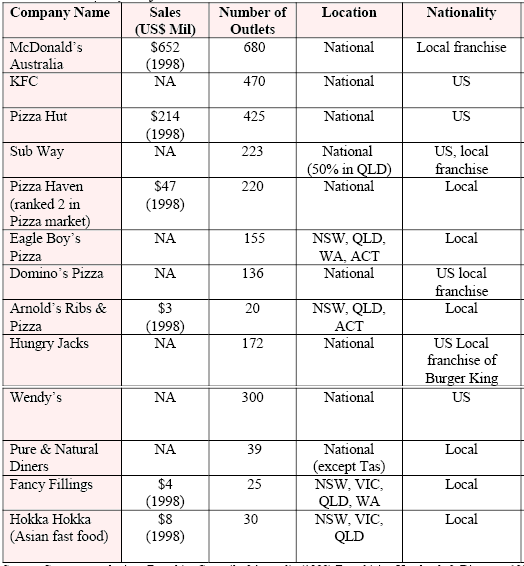
However, in order to brief this comparison among Domino’s and its major five rivals (Whitbread PLC, McDonald’s Corporation, Domino’s Pizza UK & IRL PLC, Mitchells & Butlers PLC and Restaurant Group (The) PLC), this part has assembled several competitive attributes of namely, current market share price, change in share price, market capital and finally, price earning ratio. However, these companies have taken into consideration as these have presence in the Australian market, which help to observe the market. Here is the comparison table of Domino’s Pizza Australia and its rivals. (Yahoo Finance 2011)
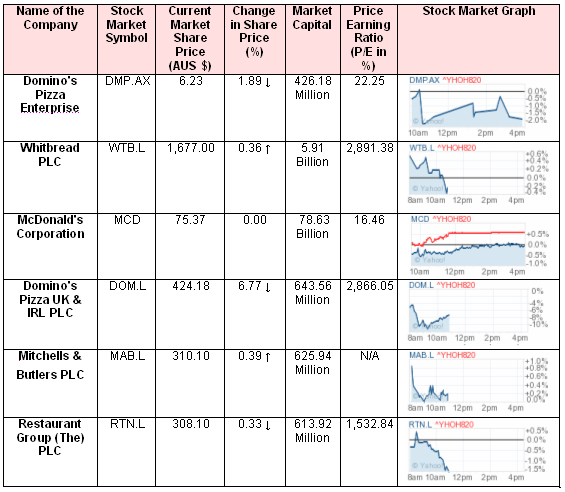
In the light of above comparison table, firstly, it has noticed that Domino’s has ranked in the sixth position in accordance with their current market capital as well as their current market share price. Secondly, change in share price demonstrated downturn value while their another rival the MCD holds neutral position precisely, no significant change but WTB.L and MAB.L has kept upward growth in market share price. It has well known that P/E ration is the most effective tools of deciding whether a company’s share would buy or not.
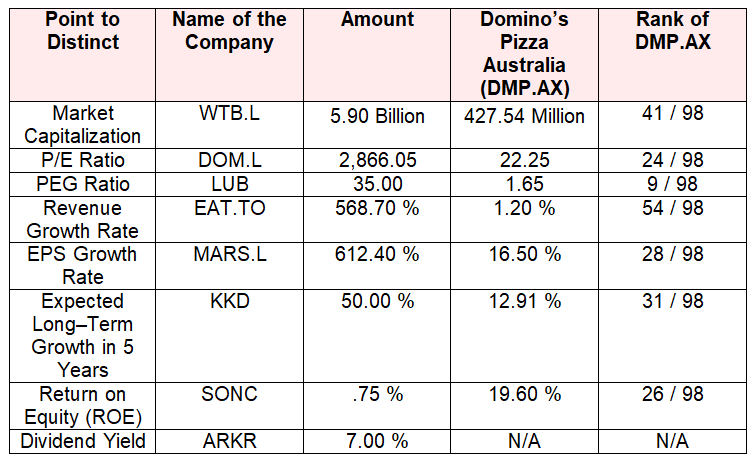
In the light of this hypothetical view and relevant data from the above companion table, it has affirmatively declared that despite the MAB.L, Domino’s and its associated rivals are proficiently able to hold strong P/E ratio. As a result, they have definitely positioned in a tough competition where five rivals among six carried positive return value as well as handsome share price. Here it has to point that P/E ratio has also involved in comparing market position of these firms in the Australian restaurant industry. For more clarification, here is the comparison table of current restaurant market leaders versus Domino’s.
Key Findings
Considering all of the financial attributes of Domino’s Pizza Australia following are key financial status findings of the company (Adkins, et al., 2010).
Revenue
For last five years, Dominos’ has capability to keep reasonable revenue growth though global recession influenced to fluctuating revenue status and currently, annual revenue growth of the firm is 5.50% in accordance with their franchises.
Major Financial Ratios
At the end of third quarter of 2010, total asset of the firm is about AUS $426 million where as their aggregate liabilities is about AUS $1.667 billion. As a result, Domino’s has currently suffered from deficit of shareholders’ equity amounted AUS $1.242 billion. Circumstances of the current capital structure are quite shocking and alternatively, debt to asset ratio and debt to equity ratio respectively as – 1.54 % and – 2.28 %. Consequence of these data it has noticed that excessive debt burden is the chief reason of such defaults of Domino’s.
On the other hand, annual equity return of the firm is 6.60 % along with 27.80 % and asset turnover of Domino has numbered 3.57 though presently they has carried small amount of short term liability and succeed to hold surplus amount of working capital by AUS $ 104.10 million with current ration of 1.65. Analysing all of the financial attributes it has quite difficult to quantify correct profitability of Domino’s Pizza.
Stock Market Profile
Even though lower market capital, Domino’s Pizza Australia has able to satisfactory return on their shareholder’s equity. Presently, share price fluctuates towards downturn but compare to prior fiscal year Domino’s has declared to pay greater dividend per share.
Conclusion
This paper has instructed to focus on an application of corporate finance models for Domino’s Pizza Australia in order to analysis financial areas of the firm. To illustrate key requirements of the paper, Domino’s Pizza Enterprises Limited (Australia) has examined in the light of three major corporate financial areas
- aggregate risk profile,
- capital structure, financing resources and growth rate and
- at last the dividend structure.
Additionally, bedsides corporate finance tools, the paper have also drawn a competitive profile among major industry rivals of the company and at the end of the paper focused on key findings. In the light of key findings, Domino’s has now in crisis of larger debt burden though their pricing strategy and equity profile is satisfactory. Key success factor of Domino’s is that they have available chain stores, franchises as well as online order placement and deliver service.
As a result, debt burden of Domino’s cannot hamper their revenue growth as well as stock market success. During the last quarter of fiscal year 2010, Domino’s share price has move towards slightly downturn but this attribute is not yet fluctuate their reinvestment projects as well as positive price-earning ratio. At the end of this paper, it has assumed that by recovering debt burden Domino’s Pizza Australia will be competent to improve their market positioning as well as profitability.
Reference List
Adkins, T. et al. (2010) Domino’s Pizza – Integrated Company Analysis. Web.
ASX (2011) Domino’s Pizza Enterprises Limited Price History Chart. Web.
Block, B. S. & Hirt, G. A. (2005) Foundations of Financial Management. 11th ed. Boston: McGraw-Hill Irwin.
Deloitte (2009) Queensland Stock Exchange Index Issue 65. Web.
Domino’s Pizza (2010) Domino’s Pizza Enterprises Limited Annual Report 2010. Web.
Drake, P. P. (2011) Financial ratio analysis. Web.
Howitt, K. (2010) What makes the perfect stock?. Web.
Netessine, S. & Shumsky, R. (2002) Yield Management. Web.
Perison, G., Brown, R., Easton, S. & Howard, P. (2006) Business Finance. 9th ed. Sydney: McGraw-Hill Irwin.
Yahoo Finance (2011) Domino’s Pizza Enterprises Limited (DMP.AX). Web.
Zeitner, R. (2001) Australia: HRI Food Service Sector. Web.