Introduction
This paper seeks to compare the financial statements of Wm Morrison Supermarket (MRW) and Sainsbury’s (SBRY) in the food retail industry using ratio analysis, horizontal and vertical analysis. This will compare the performance of the companies in terms of stock performance in relation of profitability, efficiency, liquidity and solvency. This will also therefore identify and compare financial ratios and establish recommendations that can be implemented in order for the companies to remain successful in food retail. This will also determine which of two companies is stronger and which should be chosen for investment purposes.
Analysis and Discussion
Brief Summary of companies’ activities and any exceptional recent events that could impact on the financial statements
MRW is a united Kingdom-based company engaged in the operation of retail supermarket stores. Its business is mainly related to food and grocery. The company’s wholly owned subsidiaries include Bos Brothers Fruit and Vegetables BV, Farock Insurance Company Limited, Farmers Boy Limited, Wm Morisson Produce Limited and Neerock Limited. During the fiscal year February 1, 2009, it had 382 stores and 12 distribution centres. The fiscal year 2009 also saw the company opening nine stores at various placed that include Gorleston, Giffnock, Clifton, Northallerton, Blandford Forum and Holyhead Granton and Kidderminster. Among other recent developments with MRW includes its announcement about its financial outlook for the year which remained unchanged.
SBRY, on other hand, is engaged in grocery and related retailing. It had its business organized into three divisions:
- Retailing, which consists of supermarkets, convenience and online;
- Financial services which include Sainsbury’s Bank joint venture;
- Property investments which comprise the British Land joint venture and Land Securities joint venture.
As March 31, 2009, the company had reached a number of more than 500 supermarkets and almost 300 convenience stores. Developments during 2009 included the company having opened 13 new supermarkets that, had two replacement stores, and accomplished more than 20 supermarket extension and 13 refurbishments. It was also during 2009 when SBRY has announced its acquisition of 24 stores from the Co-operative Group which consisted of more than 20 Somerfield branded stores and two Co-operative branded stores. During the same year it has acquired Town Centre Retail (Bicester) Limited.
Comparative Performance Summary and any trends identified
This section compares the stock performance of the two companies in relation their profitability and financial position.

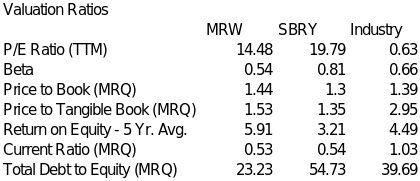
It appears that MRW has been performing better than SBRY in terms higher price to book ratio at 1.44 as against SBRY’s 1.3. This higher stock price in relation to book value of MRW may show some contrast to the higher P/E ratio for SBRY which means that investor are more than willing to take risk in relation to the earning capacity of the company. However, the better market position in term of price to book value ratio for MRW is supported by better profitability in return on assets and return on equity, and better solvency in terms of debt to equity as will be discussed in the next subsection.
Comparative Ratio Analysis
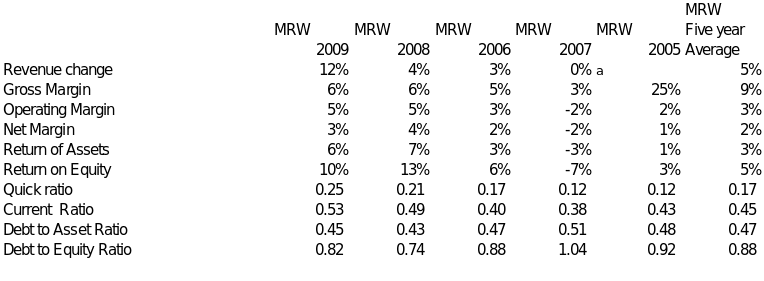
To get a better picture of better performance of MRW and SBRY require comparative ratio analysis by using their financial ratios as summarized in Tables 2A and 2B and below. This part is segmented into, liquidity, profitability and efficiency and solvency ratio analysis for the past five years.


Short-term Liquidity and Efficiency
A company’s liquidity should show its capacity of the company to meet its currently maturing obligations and the same could be measured by the quick ratios and current ratios. MRW’s quick ratios showed 0.25, 0.21, 0.17, 0.12 and 0.12 for the years 2009, 2008, 2007, 2006 and 2005 respectively or an average of 0.17 for the last five years against the SBRY’s quick ratios of 0.28 0.32 0.45, 0.62 0.43 for the same years respectively or an average of 0.42. See Tables 2A and 2B above. Quick asset ratio, which is derived by dividing quick assets by the total current liabilities, yielded better results for SBRY for all years and on the average thereby indicating more capacity to pay to creditors.
The same behaviour of the company’s liquidity may be observed in terms of current ratios. MRW’s current ratios reflected 0.53, 0.49, 0.40, 0.38 and 0.43 for the years 2009, 2008, 2007, 2006 and 2005 respectively or average of 0.45 as against SBRY’s current ratios of 0.54, 0.61, 0.70, 0.79 and 0.58 for the same years respectively or an average of 0.64. See Tables 2A and 2B above. The better liquidity for SBRY as against MRW is evident.
To compare quick ratio from current ratio, quick ratio, generally, is a better measure for liquidity since the same excludes inventory in the composition of the quick assets. As to what causes liquidity, there is a need to look the profitability of the company which should normally generate funds for the company. Other sources may come from additional investments from stockholders since additional borrowing which are payable currently may not necessarily provide liquidity as the same should also be paid in the short-term. This makes important the issue of profitability, which will be discussed in next section very important.
For a company to have a good liquidity, the ratio of current or quick assets to current liabilities should be at least one since this would mean that a company must be able to match 1 pound sterling from its current assets to pound sterling of its currently maturing obligations. Failure of a company to do could mean bankruptcy and may force the company to stop operation or become bankrupt. This must be so since the salaries of its employees which must come every payday cannot wait longer for people need to have their living expenses. The ready quick assets of a typical company to match maturing obligations include cash, marketable securities, short term investments, accounts receivable and notes receivable. To make quick assets into current assets, one may just add inventory and other current assets from the listing.
Using the principles discussed in the case of the MRW and SBRY, quick ratios for both companies for all of the past five years were less than 1.0; hence there is evidence to conclude the both have weak liquidity particularly that of MRW which had both liquidity ratios of even below 0.50. The two companies have less 1.0, both may be considered to need improvement in their liquidity, although SBRY is better between the two.
Even if compared with industry averages for current ratio of 1.03 and quick ratio of 0.89, the two companies are still definitely less superior which indicates need for improvement.
Profitability and efficiency
MRW’s profitability is slightly higher than SBRY. Based on averaged returns of equity (ROE) for the past five years, both have company shown 5%. But on 2009 and 2008 ratios, it would appear that MRW had performed better than SBR in almost all of the profitability measures. See Tables 2A and 2B above. This means that if the increase will continue MRW would continue to perform better. The better profitability for the last two years is evident terms of ROE using ratios for the latest trailing twelve months (See Table 1), return on assets (ROA), and gross margin and in net margin. See Tables 2A and 2B. Aside from profitability, it is also interesting to measure efficiency of management. By comparing their ROA ratios as measure of efficiency and ROE as measure of profitability, MRW is more profitable and efficient than SBRY.
Solvency
Solvency like liquidity, also measures the ability of an enterprise to pay its debts with available funds like cash which is presumed to exist. However, this time it is different from liquidity as solvency addressed long term or the financial stability of the company to survive based on sufficient investment from stockholders to match long term debt of the company together with currently maturing obligation. To apply the principles in the case of the companies, long term debt to common equity ratios for MRW had an average of 0.88 while SBRY has reflected debt to common equity ratios averaged 1.54 for the past five years. The MRW ratios are still better than that of SBRY because the MRW has lower ratios and lower ratios means lower risk this time See Tables 2A and 2B..
Horizontal and Vertical Analyses
Horizontal analysis refers to the comparison on per year basis of any item in the financial statement accounts. It can be asserted that the same was partly applied in the preceding subsection since prior period are being compared with other periods. This was evident in the case of profitability ratios for 2009 and 2008 which appeared better for MRW as compared with SBRY and vertical analyses in this section refers the trends and on a per year basis. Horizontally it appears that MRW reflected higher increase in revenues for the past five years.
Vertical analysis on the other hand may be applied by considering accounts or subtotal of accounts in the financial statements and relating the same to their total amount. This was therefore applied in the case of net profit margin where net income was being divided with total revenues. As found earlier, MRW was more profitable in terms of net profit margin. To expand the application of the same in this part, total liabilities may be divided to total assets and the ratio may be properly called debt to asset which has the same sum of total liabilities and total equity ratio. As may be found in Tables 2A and 2B, MRW has lower debt to asset ratio and hence it is less risky than SBRY.
Conclusion
Given the higher profitability level, better solvency, MRW is better than SBRY for investment purposes. Although SBRY is more liquid slightly and has better P/E ratios, the mentioned advantages of MRW could provide a more solid evidence of sustaining higher stock values for purposes of making a choice on which to invest between the two companies. But since the main purpose of this paper is also how to improve the performances of two companies, there is a need to increase still the profitability of SBRY to match of MRW which performed better than the industry. Both companies must also improve of their liquidity ratios in order to be at par with the industry in order to lessen the risk of bankruptcy. SBRY is also recommended to improve its solvency to match that of MRW or that of industry average. See Table1.
Bibliography
Brigham, E. and Houston, J. (2002) Fundamentals of Financial Management, Thomson South-Western, US.
Meigs, R,. Meigs, W., & Meigs, M. (1995) Financial Accounting, McGraw-Hill, New York, USA.
Reuters. (2009a), WM Morisson: Company Profile.
Reuters. (2009b), Morrison- Key Developments.
Reuters. (2009c), Morrison Income statements, 2005 to 2009.
Reuters. (2009d), Morrison’s Balance Sheet 2005 to 2009.
Reuters. (2009e), Sainsbury Company Profile.
Reuters. (2009f). Sainsbury Income Statements, 2005 to 2009.
Reuters. (2009g). Sainsbury Balance Sheets, 2005 to 2009.
Reuters. (2009h), Financial Ratios.
Sainsbury (2009) Company Website.
Weston and Brigham (1993) Essential of Managerial Finance, Dryden Publishers, London, UK.
WM Morisson (2009) Company Website. Web.
