Executive Summary
Based in South Africa, Aveng Limited is engaged in construction and steel beneficiation. The Company is functioning at a global level with its subsidiary companies.
“The Company’s business segments include construction and Processing, which consists of Grinaker-LTA, McConnell Dowell Corporation Limited, and Processing and Projects Company (E+PC). McConnell Dowell Corporation Limited is engaged in civil and marine, electrical, mechanical, pipelines and tunneling. Grinaker-LTA is engaged in building, civil Processing, concessions, mechanical and electrical, mining, property developments, roads, and earthworks. E+PC is engaged in minerals processing and industrial, sulphuric acid and gas handling, chemical and petrochemical, environmental services, power and energy, and metallurgical operations” (Reuters, 2011).
The objective of this paper is to examine the financial standing of the Group at the end of the financial year June 30, 2010, from a share investment perspective. The paper looks into the profitability and other related areas to make a suitable suggestion on the investment in the stocks of the group. Although the term “Company” is used in the paper, it denotes the “Group” as the financial figures are presented for the Aveng Limited Group.
The group has evolved financial and non-financial objectives as stated in its annual report for the year 2010 and the group was unable to achieve the financial objective of maintaining the earnings within 7% to 9% as the net income of the group was affected due to poor performance of its Manufacturing and Processing segment. The performance of the group in this segment and other segments given the global economic conditions has been the key constraint to achieving its financial objectives.
The earnings of the Company during the years 2009 and 2010 show a decline given the sluggish demand caused by the global economic recession. Nevertheless, the Company maintains a comfortable cash reserve position. The performance of the group has surpassed the indices of the industry and the sector in which it is operating in many areas. For instance, the current and quick ratios of the group are much better than that of the industry and the sector.
Similarly, the investor ratios are comparatively better than the industry and the sector. The Company is geared at a low level with a lesser amount of borrowings as compared to the total equity. The gearing ratio of the group is much less than that of the industry/sector. WACC of the Company is calculated at 10.14% based on the assumption that the average cost of its debt in South Africa is 15%.
The group has evolved an effective risk management plan and the board monitors the execution of the plan to protect itself from exposure to different risks. The company manages its cash position comfortably and its exposure to operating and financial leases is minimal.
Based on the financial analysis, the advice for investment in the shares would be to wait and see whether the company improves upon its profitability However, the analysis finds that the company enjoys a comfortable financial situation as judged from the cash and other reserves and the capital gearing of the Company. For investment in the stock of Aveng Limited, there should be a marked improvement in its profitability and the suggestion is that the stock may be watched until the end of the III quarter in March 2011 for making the investment decision.
Introduction
Aveng Limited is one of the leading infrastructure development companies in the world. The company’s products include a wide range of construction and infrastructure-related Processing products and services. The company is based in South Africa and it employed around 34,500 people around the globe during the year 2010 including 21,000 employees in South Africa. The annual turnover of the company for the year 2010 was R 33.981 billion and the company earned a net operating profit of R 2,079 billion for the year 2010. This paper examines different aspects of the financial position of Aveng Limited using the financial statements and annual reports of Aveng Limited for the years 2009 and 2010. The broad objective of the paper is to examine the financial status of the company from an investment perspective.
Financial and Non-financial Objectives
The main financial objective of the company is to show double-digit annual revenue growth. The company has the other objective of achieving operating margins, which range between 7% and 9%. The company wishes to maintain a maximum debt-to-equity ratio of 25%. These financial objectives are likely to have a significant influence on the investment, financing, and dividend policy choices of the Company.
For instance, to manage the debt-to-equity ratio of 25% the Company may have to make suitable adjustments to its capital structure and such adjustments can be made by varying the amounts paid as dividends to the stockholders or by issuing new capital or returning the amount invested by them to the stockholders by repurchasing. Therefore, the financial objectives can be said to have a strong impact on the dividend and financing policy choices of the Company. Similarly, for achieving the required operating margins, the Company may have to incur additional capital expenditure, which will have an impact on the investment policy choices of the Company.
The non-financial objectives of the company include:
- Reinforcing the Group’s leadership position in selected areas of infrastructure market in South Africa;
- Consolidating its position as a first-tier player in Australia and
- Expanding its portfolio by further exploiting the infrastructure value chain internationally to produce added-value services and solutions
The achievement of the above non-financial objectives will affect the capital structure decisions of the Company and thereby the dividend policies. These objectives will also influence the investment decisions of the Company.
Apart from the above objectives, the company commits to meeting the long-term well-being of the communities, which is one of the key external stakeholders of the company. According to the claim in their annual report, this commitment of the company goes far beyond its financial considerations.
Key Constraints on Financial Strategy
One of the major constraints in the financial strategies is the ability of the Company to achieve the expected profit margins from all the business sectors. For instance, according to the review of the financial performance of the Company by the Financial Director, there has been a decline in the gross profit margin during the year 2010 because of a tighter operating environment. Similarly, the Manufacturing and Processing segment has shown a reduction of 13% in the turnover, which was because of lesser demand for many of the Company’s products and services and a decline in the realization of steel products.
Reduction in the steel business within this segment has affected the gross profit margin of the Company. “The contribution to operating profit of the Construction and Processing: Australasia and Pacific segment declined by 25%, which was primarily due to material losses on two pipeline contracts.” Therefore, potential changes in the global economic conditions will have a strong impact on the proposed financial strategies of the Company.
Overview of the Financial Strategies
Aveng Limited has the financial strategies of improving the revenue and operating margins up to certain limits. This calls for a drastic increase in the operational efficiency of the Company so that the Company can minimize its cost of products and services and increase the operating margin. However, achieving the financial strategies of growth in revenue and operating margins both depend greatly on the potential changes in the global economic conditions and consequent changes in demand for the products and services of the Company. As an aftermath of the financial crisis, the Company has experienced a tighter operating condition during the year under review.
To accomplish its financial objectives, the Company has to ensure that it performs a strategic review of the poor performance of the Manufacturing and Processing segment and takes necessary corrective actions to reduce costs and improve the profitability from that segment. The Company has obtained authorization for the repurchase of its shares from the existing shareholders, to achieve the desired financial objective in respect of its capital structure.
Performance of Aveng about the Industry
Aveng group has recorded an impressive financial performance during the year 2010 with gross revenue of R 34 billion, which accounted for a 1% increase over the last year. The analysis of the financial performance of the Company is carried out by studying different aspects of financial performance.
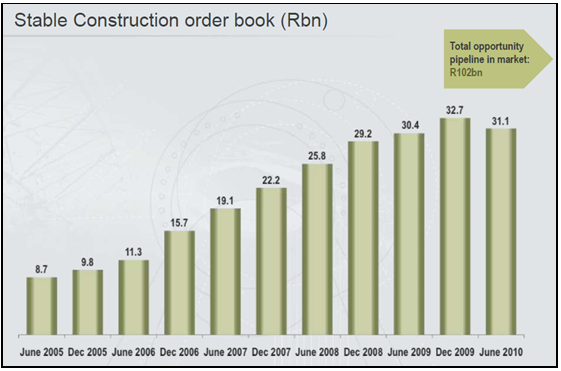
Growth
The Company has been performing consistently in a better way over the past years. This is evident from the following figure, which shows the increase in the order booking of the company over the last five years. Because of the consistent increase in the order booking of the company has registered a uniform growth in the total revenue, which is exhibited in the figure showing the revenue growth.
Although there has been a consistent growth in revenue, the profitability of the Company has shown a declining trend over the past three-year period. This is evident from the declining percentages of gross profit and operating profit margins during 2009 and 2010 as compared to the year 2008. Changes in the global economic conditions and the resultant increase in the costs of materials have caused a decline in the profitability of the Company.
The following table shows the profitability of the Company over the period. From the table, it can be observed that the Company was unable to meet its financial objective of maintaining an operating margin of 7% to 9%. Aveng Limited has maintained a consistent return on capital employed over the past three years. However, there is a decline in the return on equity because of the reduction in the net income during the last two years.
Table: Profitability Ratios of Aveng Limited.
The Company has performed less efficiently in the profitability areas as compared to the industry but better than the sector. However, the return on equity for Aveng Limited is much higher than the industry and sector.
Capital Expenditure
The relation between the increase in the capital expenditure, addition to the Property, Plant, and Equipment (PPE), and the investing cash flow can be analyzed from the following information presented in the table:
Table: Capital Expenditure Compared to Revenue and Cash Flows.
The ratio of PPE to the total turnover indicates how effectively the company has utilized its PPE to generate more revenue from the investments made in these assets. Manufacturing industries have to spend more quite often heavily on properties, plants, and equipment to meet the challenges from the increased competition. On the other hand, Companies in the construction sector may not spend much of their revenues in accumulating fixed assets.
Nevertheless, the more times the PPE generates sales it is good the company and the PPE/Turnover indicates this relation. The consistency in the fixed assets turnover rate or a progressive increase thereof shows signifies a positive balance sheet investment quality. In this case, the PPE ratio to turnover has shown a decline in the years 2009 and 2010 as compared to the year 2008. Hence, it can reasonably be stated that there has been sluggishness in the utilization of the fixed assets to generate revenues in the last two years.
As regards the relationship between the operating cash flow and the investment in the capital expenditure, the percentage of capital expenditure to the total operating cash flow has been consistently good during 2009 and 2010. However, the increased capital expenditure may sometimes result in a cash crunch situation for meeting the current liabilities; but in the case of Aveng Limited, since the Company has accumulated reserves this situation may not arise. Where necessary, the company may have to resort to short-term borrowings in the form of overdraft to meet the current obligations, which is a usual practice for Companies in the construction sector.
Liquidity of the Company
Liquidity ratios are the best predictors of the future success of a business. Liquidity ratio is defined “as a class of financial metrics that are used to determine a company’s ability to pay off its short-term debts obligations. Generally, the higher the value of the ratio, the larger is the margin of safety that the company possesses to cover short-term debts” (Investopedia, 2011). Liquidity Ratios are the ones that exhibit the short-term liquidity of the company.
To get adequate knowledge on the financial soundness of a company, the investors make use of the current ratios and this ratio helps the investors to minimize the risk in stock market investments. A lower current ratio signifies that the firm does not have enough resources to meet its short-term financial obligations. Failure to meet the short-term obligations will result in the bankruptcy of the company. The liquidity of a company is exhibited by the current ratio and quick ratio. The current ratio is worked out by dividing the current assets by current liabilities.
The liquidity of Aveng Limited is analyzed using the following ratios.
Table: Liquidity Ratios.
Aveng Limited has a better short-term financial position in the current ratio and quick ratio as compared to the industry and sector.
Current Ratio
Aveng Limited is maintaining a reasonable current ratio throughout the three years. Especially in the year 2008, the company had a strong current ratio implying that the company had a very strong current assets situation that will enable the company to meet its current liabilities without any problem. However, there is a gradual reduction in this ratio during the years 2009 and 2010. Normally a current ratio of one and above is acceptable; but with a current ratio of two, the company is considered to have a sound short-term liquidity position. Since the current ratio of Aveng is less than two the company can be regarded as having only a moderate sound short-term financial soundness.
Acid Test Ratio
Over the three years, the acid test ratio of the company Aveng Limited has decreased from1.36x in 2008 to 1.31x in 2010 implying that the company’s quick assets (accounts receivable plus cash) have decreased. This situation is due to the reduction in cash and cash equivalents of the company over the period. However, the situation is not alarming since the company’s current ratio is strong enough.
Long-Term Solvency Ratios
The ability of a company to meet the interest obligations on its borrowings can be judged by the long-term solvency ratios. The ratio of borrowed funds to the firm’s capital is exhibited by the gearing ratio.
Gearing Ratio and Interest Cover.
The capital structure of Aveng Limited is extremely good with very lower total debts when compared with the industry and sector indices. The Company’s sound financial position as far as the interest cover is concerned is found to be much better than the industry and sector.
Gearing Ratio
The gearing ratio explains the relationship between the long-term debts of the company and its equity. The company should be able to maintain a correct balance between the debt and equity so that the company can ensure a good return for the company’s shareholders. In the case of Aveng Limited, it may be observed that the gearing ratio of the company for the year 2010 has shown a decline from the year 2009.
This reduction in the year 2010 shows the company has grown to a strong financial position by decreasing the debt content in the total capitalization of the company. With a sound cash flow position, the company should be able to maintain the debt-equity at a low level. However, the Company can consider revising the capital structure by increasing the debt content, so that it can make use of the taxation benefits on the interest payable on borrowings.
Interest Cover
This analysis exhibits the ease with which the company has been able to pay off its interest liabilities out of its earnings. From the figures, it is observed that Aveng Limited is in a strong position as far as the interest cover is concerned since the company could cover up to 39.74 times during the year 2010. However, this index is less as compared to the position of the company for the year 2008 when it stood at 178.9 x.
Shareholder Investor Ratios
When the investors look at the financial statements of the Companies, in the stocks in which, they would like to invest, they may suffer information overloads, as there would be different financial values such as revenue, gross and operating margins, and other balance sheet figures. To simplify this investor evaluation process, the investor ratios are calculated.
The following are some of the shareholder investor ratios.
Table: Shareholder Investment Ratios.
The most common investor ratio is the price to earnings ratio, which compares the current price of shares to the number of earnings it generates. The purpose of this ratio is to provide a quick idea to the investor as to the amount they need to pay for each $ 1 of earnings. In the case of Aveng Limited, the price-earnings have come down from 14.5 in 2008 to 7.7 in 2010. This might be due to the reduction in the share price from 5800 in 2008 to 3445 in 2010.
The dividend yield is the financial ratio, which shows the amount of dividend that a company pays out each year about the price of its shares. The dividend yield is the return on investment for a particular stock. The dividend yield for the year 2010 has increased as compared to the earlier years. This might also be due to the decline in the share prices as of the end of 2010. The dividend yield of Aveng Limited is better compared to the industry and sector. The price of the shares of Aveng appears to be high when comparing the earnings that the shares could generate because the industry and sector have a higher Price to Earnings ratio.
Capital Structure
Aveng Limited has an authorized capital of R 44.1 million comprising of 862,034,263 ordinary shares of 5 cents each Out of the authorized capital the company has issued 389,988,186 shares as of 30 June 2010 valued at R 19.5 million. This implies that the company can alter its capital structure in the future by issuing additional ordinary shares if it likes to increase its capital. To reduce, it’s ordinary share capital the company has repurchased 8,066,821 shares during the year 2009 and held these shares in trust by creating Aveng Limited Share Purchase Trust. However, the value of these shares has not been reduced from the total issued capital. The market value of these shares as of June 30, 2010, was R 210.6 million. The Company has not issued any other types of shares such as preference shares or shares having varying voting rights.
The amount of premium collected on the issue of ordinary shares amounted to R 1981.0 and this amount is shown as a share premium account in the Consolidated
Statement of Financial Position of the Company as of June 30, 2010.
The Company had total borrowings of R 366.9 million as of the end of the financial year 2010, on which the Company had to pay interest. Out of the total amount of R 366.9 million, R 197.3 million represented overdrafts from banks. Other interest-bearing debts of R 141.2 represented the current portion of short-term borrowings including restructures of a finance lease liability.
The short-term borrowings of the company are secured and the liability because of secured loans for the next year 2011 is R 141.2 million and for the year, 2012 is R 28.4 million. The Company has not obtained any unsecured borrowings either during the year 2010 or in the previous year. The interest rate on the borrowings varied from 6.1% to 15%.
The Company generally follows a capital management policy in which the Company will maintain a strong credit rating and healthy capital ratios, which will support the business of the Company effectively. The Company manages its capital structure efficiently and makes frequent adjustments to it to keep up with its capital management policy. The adjustments to the capital structure are made by changing economic conditions.
The Company maintains or adjusts its capital structure by suitably modifying the dividend payments to shareholders returning capital to shareholders or by issuing new shares. However, the Company has not made any changes to its “objectives, policies or processes” to significantly affect its capital management policy either during the year ended 30 June 2010 or in the previous year ended 30 June 2009. The Company monitors its capital structure using a gearing ratio.
The gearing ratio is calculated by dividing the net debt by the total capital of the Company plus net debts. The Company has the policy of maintaining the gearing ratio at 20% or less. “The Group includes within net debt, interest-bearing loans and borrowings, trade and other payables, less cash, and cash equivalents, excluding discontinued operations. Capital includes equity attributable to the equity holders of the parent of R12 214 million (2009: R10 865 million).”
Leasing Operations/Activities and Justifications
During the year under review, the Company has some operating leases in the area of its property, plant, and machinery. Any company of the size and nature of that of Aveng will use the opportunity of leasing some of its machinery and equipment in the process of conducting its business by considering the relative merits of entering into operating leases. The Company has made proper disclosures of its obligations on operating leases. Out of the total value of R 9131.9 million of Property, Plant, and Equipment, the value of the leased plant, equipment, and vehicles amount to R 105.4 million only. Similarly, the long leasehold value of land and buildings was only R 50.6 million as against the value of owned properties of R 876 million.
The value of leasehold property, plant, and equipment was not significant and therefore the lease holding can be justified. The financial commitments of the Company in respect of operating leases are shown below. Considering the comfortable financial position of the Company, the above future commitments on account of contracted leases cannot be considered significant and the lease commitments are within justifiable limits.
The future minimum lease payments under non-cancellable operating leases are:
Table: Commitments of Aveng Limited on Operating and Other Leases.
Cyclicality of Cash Flows and Cash Management Strategy
The company was able to maintain a strong position in its cash generation during the year. The cash generation recorded a 7% increase, with R 3.2 billion generated from operations. The cash generated from operations for the previous year was R 3.0 billion. The increase in cash generation was despite the difficult trading conditions, which had a severe impact on different business areas. Book debts of the Company were maintained at R 6.9 billion (2009: R 6.3 billion) with no reporting of any significant impairments, although the business of the Company faced tough trading conditions.
The net cash position of the Aveng Group was at R 7.5 billion which more or less equaled the cash position in the last year. Out of the total cash surplus, 57% remained in South Africa and the balance in Australia. The total cash included an unencumbered cash component amounting to R 3.5 billion (2009: R 2.9 billion). The encumbrance in net cash arises mainly because of advance receipts and over claims from contract debtors as well as cashback guarantees given by the Company. “The maintenance of good cash reserves is complemented by positive movements in working capital payables and inventories, cash generated from operations and deferral of capital expenditure.”
Weighted Average Cost of Capital
The capital structure of a company is comprised of both debt and equity. Lenders and equity shareholders expect a certain rate of return on their investments and WACC enables the lenders and investors to know the rate of return that they can expect by investing in a particular company. WACC, therefore, is the opportunity cost of taking the risk of investing their funds in the stocks of a company. WACC is the minimum rate of return that a company produces to enhance the value for its investors. When the return from the company is more than its WACC, it implies that the company can produce more value for investments into the company.
One of the most important elements in financial analysis and valuation is the Weighted Average Cost of Capital (WACC). WACC is the discount rate, which is applied to convert the expected future cash flow into its present value. In its practical usage, WACC presents the cost of raising another dollar of capital for any firm. This cost is calculated as an average cost for raising the capital in the form of either equity from the investors or as borrowings from financial institutions or other lenders.
“The cost of equity can be defined as the minimum rate of return that a company must earn on the equity-financed portion of its investments to leave unchanged the market price of its stock. Most companies use the Capital Asset Pricing Method (‘CAPM’) to calculate their cost of equity capital. In the CAPM definition, the cost of equity is equal to the return on risk-free securities plus the company’s systematic risk (beta) multiplied by the market risk premium,” (Financial Modeling Guide, 2007).
The cost of debt on the other hand is the minimum after-tax return that a company must earn on the debt portion of its capital so that it can leave the market price of the shares unchanged. WACC is an important measure for finance managers, as it would help them to plan the capital structure of their respective companies.
Possible Influence of World Economic Crisis
The recent global economic crisis might have affected the financial performance of the Company in several respects because of sluggish demand for Processing products and services, as most of the countries could not proceed with their anticipated capital expenditure projects, for want of adequate capital. This would have affected the financial performance of Avenge. Reduced demand might have affected the revenue of the Company by lesser business in many of the business segments of the company, which ultimately might have affected the expected growth of the Company. The Price to Earnings ratio would have been affected as the market prices of most of the multinational companies declined heavily.
Combined with this there has been a decline in the operating margin of the Company, because of the tighter trading conditions faced by the Company. The downward changes would have affected the company’s β greatly. Less contribution by the Manufacturing and Processing Segment because of difficult business conditions after the economic crisis would affect the expected return of the Company. The gearing ratio of the Company might have been affected, as the Company would not be in a position to repay some of its non-current liabilities as planned because of lesser cash generation from investing activities.
Management of Finance and Treasury Functions
Simon Scott, the Financial Director of the Company oversees the finance function of the Company. During the year 2010, the company established a centralized Group treasury to look after the management of the treasury functions. Group Treasury is entrusted with the function of coordinating the “operational treasury functions” to provide sustain the “growth strategy” of the company. The objective of mandating the Group Treasury to control the treasury activities is “to ensure consistent standards, processes, and controls.” Based on an analysis of cash utilization across the Group, the Treasury recommended a share repurchase strategy. This strategy provides the power to the company to repurchase its shares as and when the chances of repurchasing develop in the market.
Hedging and Risk Management Strategy and Execution of the Strategy
The company considers managing various risks as critically important for ensuring the growth and success of the company. The board has been entrusted with the responsibility of setting proper risk tolerance standards and they are communicated to the other organizational members. The risk tolerance levels set by the board take into account the impact of the relative risks associated with each project so that a proper risk analysis could be undertaken. The board ensures that these risk management processes are incorporated into the daily activities of organizational members and it regularly monitors the conformance with the requirements of risk management.
The Company follows both a top-down and bottom-up approach in the matter of risk management. In the top-down approach, the senior leaders of the company provide an overall strategic framework and direction for risk management. The approach also defines the business imperatives. The bottom-up approach is followed based on the analysis of a project-by-project. This analysis ensures that the project goals will be able to comply with the strategic focus of the company as well as the business objectives of the operating group. “Once this hurdle has been successfully passed a full analysis of all the inherent risk is undertaken.
The risks to which the group could be exposed are continually monitored to evaluate new and emerging risks and to ensure that future actions can be reviewed and focused appropriately on an ongoing basis” (Aveng Group, 2010).
For an effective risk management approach, the Company categorizes the risks into those, which are within the control of the Company, and those, which are subjected to the influence of external factors. The external risks include “country risks, exchange rate risks, and commodity price risks.” The Company attempts to manage the risks subject to external factors by “maintaining a strategic balance between business sectors, markets, currencies, countries, and products.”
While considering the mitigation of risks, which are within the control of the Company, the board identifies those risks, which could hurt the business of the Company. “It considers the nature and extent of these risks, their likelihood of occurrence, and the group’s ability to adequately mitigate their impact at a reasonable cost. The process is then further developed using a more detailed and sector-specific focus” (Aveng Group, 2010).
The Company does not expose itself to trading in financial instruments. However, to manage currency, credit, and liquidity risks arising in the normal course of business the Company may enter into transactions involving financial instruments. The Company has developed an effective risk management process to control and monitor these risks. Therefore, the Company does not have significant exposure to hedging risks.
Conclusion
Based on the analysis of the financial and other performance of the company Aveng Limited, the following observations can be made concerning the investment in the shares of the company:
Profitability Analysis
As far as the profitability of the company is concerned because of the reduction in demand for the products of the Company and change in the economic conditions, the gross margin has declined over the last two years although the Company can maintain the gross revenue intact. The lower gross margin has led to a lower operating and net income situation for the company. By controlling the operating expenses, the company would be able to improve upon the operating profit still further. While the control of operating expenses is, an important issue the company has to address it is equally important that the company enhances the sales revenue relative to the Manufacturing and Processing segment to improve profitability.
Risk Analysis
Presently the company enjoys a comfortable financial position as the debt/equity is at a very low level as compared to the industry and sector levels. This implies that the company can go in for additional borrowed funds to meet any exigencies. The increased borrowing will enable the company to take advantage of the tax on the interest payments. This involves a serious review of the capital structure of the company. The financial position of the company can be stated to be of the highest order as the Company does not trade in any hedging instruments and maintains a low level of operating lease. In addition, the Company has instituted a sound “risk management plan” for protecting it from exposure to any risks.
The earnings of the company seem to be looking consistently good and the analysis of the cash flow shows the company’s growth prospects. The cash flow situation is showing that the company has deferred its capital expenditure investments, given the global economic recession, which has affected the revenue and earnings of the company. The current ratio seems to be under control with better short-term liquidity and the company maintains its accounts receivables and inventories by closely monitoring them.
The growth of the company over the last year is slow while comparing the revenue for the year 2009. There has been a slight decline in the order booking also. However, the Company has a tremendous potential to improve upon its revenue. With the improvement in the global economic situation, the company will be able to achieve a higher turnover and improved profitability.
The company’s earning position is not showing a rosy picture because of the global recession in the kinds of products it is dealing in. With the improvement in profitability, the Company would be able to do well financially.
Based on the above discussion the advice for investment in the shares would be to wait and see whether the company improves upon its profitability. However, the company enjoys a comfortable financial situation as judged by the cash and other reserves and the capital gearing of the Company. For investment in the stock of Aveng Limited, there should be a marked improvement in its profitability and the stock may be watched until the end of the III quarter in March 2011.
References
Aveng Group, 2010. Risk Review. Web.
Financial Modeling Guide, 2007. Mechanics of Discounted Cash Flow Valuation – WACC. Web.
Investopedia, 2011. Liquidity Ratios. Web.
Reuters, 2011. Aveng Ltd (AEGJ.J). Web.