Executive Summary
Caterpillar Inc (Abbreviated as CAT on the NYSE) leads globally, by revenue, in the manufacture of construction/mining equipments, diesel/natural gas engines, industrial-gas turbines, electric-power plants, highway-trucks, as well as seaborne vessels. CAT has consistently led its industrial sector in the United States in past few decades and at the same time competed in the global market basically from a domestic-manufacturing-base (DMB) recording over half of sales made to overseas clients.
The paper presents studies on stock analysis of the company in an opinion that caterpillar will continue to dominate the construction technology/agricultural technology market because there are fresh prospects in the agricultural sector where the steady drift of the economy of the United States to biofuels is offering a fresh market. In its last quarterly report in 2010, this was reflecting when the company presented a $707million profit; an increment of 91.0% as of what was obtained a year earlier. The profit was realized through an increment of about 31.0% in sales/revenues which amounted to $10.40billion for the quarter. A three year forecast of the market has also been presented.
Review of the Company and its Business
Caterpillar has had an overwhelmingly non-swaying financial growth since year 2001 and has remained a leading economic force in the construction market in the United States. It has employed an approximately ninety-five thousand staff spanning over six (6) continents. Basically, the company is known of manufacture and sales of engines/engine components and machines; otherwise, these aspects define its key product line.
Apart from the stated engagements, the company is also known to provide clients-based financial products. In the year 2010, it was noted that Caterpillar generated at least $7.5 billion from the three key product units- Engine, Machinery, and Financial-Products; yet, this much was interrupted by a community-price collapse which affected the company during the time (Msema 114). Two years earlier, the Machinery and the Engine units generated an approximately eighty-eight percent of the company’s profit, while the Financial-Products sector produced an approximately twelve percent. The primary responsibilities of the various product lines are as follow:
- Machinery: This has to do with designing, manufacturing, marketing and selling of construction/mining and forest-operated machines which are either wheeled or tracked tractors, wheeled or tracked loaders, pipe-laying machines, motor-graders, wheeled scraping tractors, tracked and wheeled excavators, backhoe-loaders, log-skidders, log-loader, off-highway vehicles, articulated-trucks, paving-products, as well as skid-steer-loaders and similar machines. This unit of the company is also engaged with logistic-servings, designing, manufacturing, remanufacturing, serving of rail-linked products and other companies’ products maintenance;
- Engine: this has to do with designing, manufacturing, marketing as well as selling of engines for the company’s machinery; these engines include electricity generating power plants, on-highway locomotives/vehicles (including industrial-based, agricultural-based, construction-based, petroleum, marine, and similar applications/parts. The unit is also concerned with the manufacture of Caterpillar-engines, Caterpillar-machines and engine-units, as well as manufacture-based services.
- Financial products: Caterpillar-Financial is a unit of the company that offers a number of customer-friendly financial choices; these are in the form of loans and insurances or leases. There is also the CAT-Power-Venture which is an independent-power-project investment which uses Caterpillar’s power-generation services/equipments.
Through these key-products line, Caterpillar generated $42.6 billion revenue in its 2010 fiscal-year; this indicated a thirty-one percent increment as compared to the 2009’s $32.4 billions. The company equally recorded an increment in its profit amounting to $2.7 billion in year 2010. In 2009, this stood at $895 million; thus the value in 2010 was a significant increment. According to Msema:
Fourth quarter revenues and profits were also up when compared to year-ago results. Revenue for the forth quarter was $12.billion, an increase of 62% from fourth quarter earnings in 2009. Fourth quarter profits were up by 317%, totaling $968 million, an increase from $232 million in the fourth quarter of 2009. Increased demand, production, and efficiency drove these gains (94).
This much success in the year 2010 was consequent of an emergent success in the production and utilization of Biofuel in the United States and other developed countries; this equally reflected an increment in sales of agricultural equipments and generated a force that has presented a great trend for market success in 2011.
In the current year, the company may expect prospect from marketing of the company’s agricultural equipments due to the reflection in nations’ substantial soybeans/corn harvests for biofuel production- this will especially be positive in the United States. From a management-point-point-of-view, twenty-one pounds of corn-seeds would be required for producing a single ethanol-gallon; this will mean then that the company will have a significant demand in corn-processing tractors/equipments in the year 2011.
There is an equal expectation that the policies of the present administration in the United State would favor Caterpillar; government is expected to release an approximately $136 billon for funding of road constructions, bridge constructions as well as handling of water-projects. This infrastructure overhaul will necessitate an increased usage of Caterpillar machines and equipments since they may be considered by construction engineers based on their strength, capacity and efficiency. There is then a positive indication that the market for Caterpillar in the year 2011 will remain prospective and the prospect may span for at least the next five years.
Equally, there is an expectation that green-movement legislation in the United State and internationally would enhance the usage of caterpillar products. According to Schermerhorn:
‘The EPA has…just passed a Tier 4 non-road diesel requirement that will start affecting most of Caterpillar’s non-road machinery and engine products starting in 2011’ (Schermerhorn 32).
The reason for high turn-over exception for Caterpillar within these periods has been stressed by Schermerhorn that:
‘Caterpillar is the largest company in the agricultural machinery space and can most easily afford these R& D expenses’ (Schermerhorn 36).
Caterpillar may utilize the much competitive-advantage it has by ensuring the development and patenting of machines which would meet with standards in the environment; this would further be made possible in a situation whereby competitors fail to upgrade their standards to expectations.
Among the forces that would drive the economy for Caterpillar in 2011 and beyond, there is the expectation that an increment in demand of Caterpillar products in developing countries would offer market for business; and then the recovery of the United States housing market will have an influence on the market as well. The company also has a good administrative structure that enables smooth policy implementation (compared to Appendix A).
Amidst these prospects however, Caterpillar would be competing with a number of companies which are equally doing well such as Deere-and-Company, Kubota, Fastenal-Company, Joy-Global, and CNH-Global N.V. Figure 1 shows the performance of Caterpillar as against five similar competitors. These competitors have significant strengths within there regions due to fact that geography affects the market in heavy machinery- a good example of this could be cited of Komatsu which is favorably competing in Japan with Caterpillar. Apart, there is a threat to Caterpillar as stated:
‘…many international competitors have lower labor cost because Caterpillar (CAT)’s US employees demand higher wages for their work’ (Msema 102).
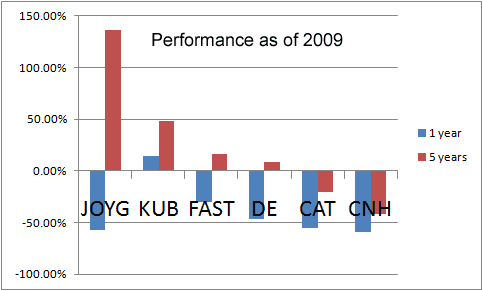
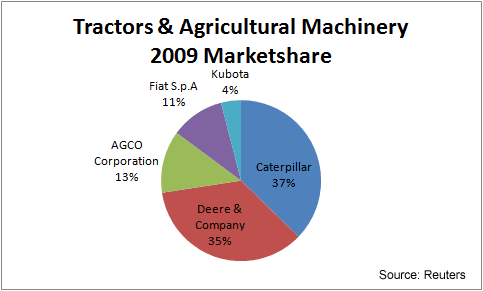
Figure 2 illustrates Caterpillar’s competition against Deere-and-Company, Kubota, Fastenal-Company, Joy-Global, and CNH-Global N.V in Tractors and Agricultural machinery as at the 2009 Marketshare.
Economic Forecast
Statistically, Caterpillar trades under Averagely-High-Yield-Price, 20-Year DCF-Price, and Average-P/E price discounts. With an exemption of high/low evaluations and averages, the current trade of Caterpillar is placed at 17.1% discount. To actualize an effective forecast then, the Dividend-Growth-Rate, Years of Dividend Growth, a 19.98% Payout Average, and 1-Yr > 4-Yr Growth would considered under the assumption that Rolling 3-Yr Dividend > 19.98%.
With a dividend growth rate standing at 9.90% yearly (Armstrong and Philip 45), CAT is expected to have a prospective market within the next three years. And then, based on the fact that Caterpillar’s construction/engine businesses are quite cyclical, the company’s EPS growth-rate would definitely decelerate to reflect the progressive United States’ economy-softness as well as the moderate European trends. Msema presents the company’s quarterly report in 2010 as follow:
Caterpillar announced a profit of $707 million for the second quarter of 2010, a 91% increase from year ago results. This profit was driven by a 31% increase in sales and revenues which totaled $10.4 billion for the quarter, an increase of $2.4 billion from $7.9 billion in the second quarter of the previous year. Sales volume primarily helped drive growth in the second quarter of 2010, increasing by $2.3 billion for the quarter (Msema 117).
Equally, Machinery/Engine sales grew by 34.0% during the period finishing at $9.70 billion and the stocks reading where almost consistent with Appendix B; a year earlier this stood at $7.30 billion. In any case, financial-product revenues reduced from $721.0 million to $686.0 million by 5.0% as compared to a year earlier. Feeding the entire information into a D4L-Pre-Screen.xls Model, the prices of shares are likely to come down to $43.21 before Caterpillar’s NPV-MMA Difference may decrease to an anticipated $7,500.0 NPV-MMA difference. At this price, Caterpillar is likely to generate 4.62% by the end of this year.
From year 2000 to 2003, Caterpillar’s growth-rate stood at 1.40% and 6.40%. Thus, the anticipated growth in the next 3 years is certainly not unreasonable especially when examined from a conservative point of view at a 1, 2, and 3 year minimal compound yearly 19.98% growth-rate and based on the fact that six years after 2003, the increase in dividends for the company remained at 17.10%. Caterpillar’s trade is certainly worth watching.
Stock Market Forecast
There is high possible that technology will drive the brightest-stock-market-star in 2011, 2012, and 2013. Presently, studies have reviewed a 54.0% gross-revenue which was documented in year 2009 (Mseman 112). This was basically driven by international markets. The speculation remains; Caterpillar will have an increased growth during the years in view due to an advanced application in technology.
Sector & Industry Forecast
The construction sector is expected to experience a favored market as the world economic crunch resides. For caterpillar, there are rather fresh prospects in the agricultural sector where the steady drift of the economy of the United States to biofuels is offering a fresh market. In its last quarterly report in 2010, this was reflecting when the company presented a $707million profit; an increment of 91.0% as of what was obtained a year earlier. The profit was realized through an increment of about 31.0% in sales/revenues which amounted to $10.40billion for the quarter.
Ratio Analysis
The Quick-Test-Ratio (otherwise regarded as Acid-Test) is utilized is utilized in testing Caterpillar’s liquidity and financial capacity. In calculating this ratio, the present assets (Appendix C) of the company is reduced from its inventory. Basically, there has been a digest form of the statement’s income and then balances are presented on a sheet wit the location of ratios toward the end of the reports.
Company Financial Forecast and Valuation
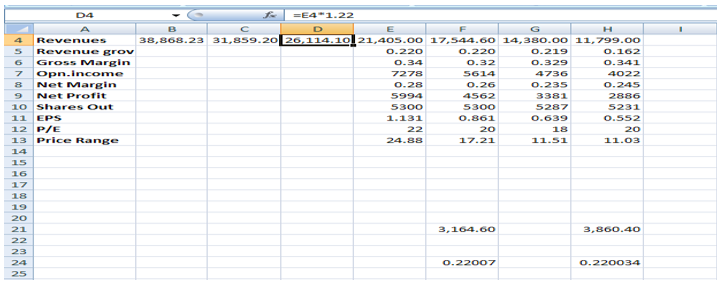
The Excel table produced with footnotes discussing assumption presented in Figure 3 is based on three steps stipulated by Msema as follow:
- ‘Assumptions are made about the operations in the Operations worksheet;
- ‘Assumptions are made about financing worksheet; and
- ‘The Solver is used in the Financing worksheet in order to minimize bank notes payable subjects subject to maintaining the minimum cash balance required’ (Msema 119).
The Spreadsheet encapsulates the generalized knowledge of the company including its stock and financial performance over the last three years. From this, a three-year forecast is generated. The primary focus in the generation of the spreadsheet is revenue-growth-and-profit-margin-definition based. It is equally reliant on the impact of Caterpillar’s events as well as trends on revenue growth and margins, and on attempts to provide answers to some fundamental questions including defining the driving force for revenue and profit growths, and as well consider the tendency for the expansion or contraction of the margin (Appendix C). Effort is made to consider the possibility for profiting or loss of shares at the year-end.
It should be noted that shares-number and price-per-share have been calculated here from the considerations that there is a zero percentage debt-change to other amounts of debts. This satisfies purchase of shares in an event whereby borrowed –funds are made use of. It has been noted that under this circumstance that the product of price/share and the remnant sum of shares must amount to market-value-of-equity (Schermerhorn 38). By this, it can be said, for example, that the product of price/share and 6000 has to generate Caterpillar’s market-value. In similar studies by Armstrong and Philip, it was noted that:
‘This fact is used to compute the price per share and then the number of shares is found by dividing the market value of equity by the price per share’ (43).
Social Responsibility
Caterpillar has continually demonstrated that being determined to social responsibilities as well as having environmental sustenance supports in the deliverance of firm financial results and as well creates a profitable growth-opportunity. Caterpillar is a pronounced Business-Roundtable-Resolve-program member; by this, it is engaged with the mobilization of resources as well as ensuring member-companies’ proficiency.
This, it achieves through enhancing voluntary actions in controlling the emission of Greenhouse-Gas (GHG) and equally improving Greenhouse-Gas intensification of the United States’ economic structure. Not too long, Caterpillar became a member of Climate-Leaders which is established by the united-States-Environmental-Protection-Agency (EPA) to voluntarily monitor the climate and generate answers for the reduction of GHG emanations. According Schermerhorn:
‘Caterpillar has been named to the Dow Jones Sustainability World for the third consecutive year, which recognizes the company that led their industries in the corporate social responsibility’ (42).
From the forgoing discussion, it is clear that Caterpillar meets the needs of the people through quality services and the planet through environmental friendly initiatives, and has continued to sustain an effective business model within the decade (refer to Appendix D for ratings).
Final Recommendation
Caterpillar is a well established firm that has continued the express its strength and consistency over the years through an approximately 95,000 staff capacity, international network, and state of the art technology. It has continued to lead in the sub-region of production among competitors especially in the manufacture and sales of high-tech engines/machines as well as in the provision of customer-based financial products.
Through these, the company recorded $7.50 billions last year; however it was affected by a commodity-price collapse during the time. From the earning/price ratio of caterpillar determined in this study through the division of present company’s price and the last quarterly earnings-data report, the company is recommended for investment.
As an investor, one would map-out a monitoring structure for the investigation or study of such a company and others within its sector. From an appropriate standard analyst-metrics, a good investor is likely to buy or invest in caterpillar’s stocks as it presents a prospective market at least for the next three years. The company is thus recommended for investors presently.
Works Cited
Armstrong, Gary, and Philip Kotler. Marketing: An Introduction. New York: Pearson & Prentice Hall, 2010. Print.
Msema, James. The Theory and Practical of Stock Market. Ibadan: University Press, 2011. Print.
Schermerhorn, John. Core Concepts of Management. Canada: John Wiley & Sons, Inc., 2004. Print.
Appendix
Appendix A – S.W.O.T Analysis of Sun Microsystems
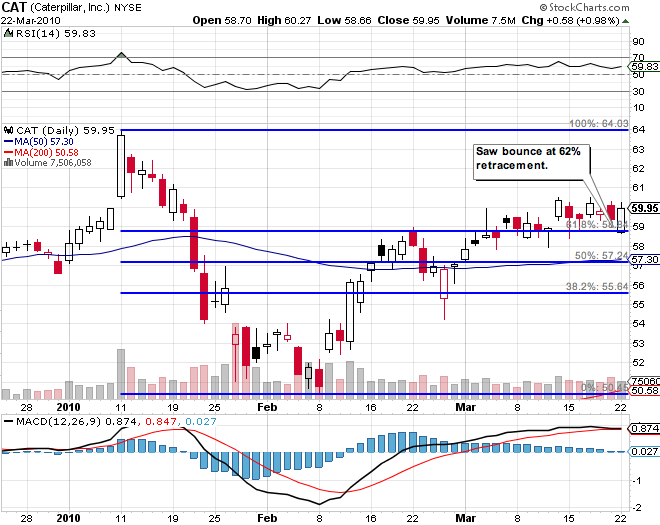
Appendix B: CAT readings as at 22nd March, 2010
Appendix C: An explanation of Financial Analysis at Company Level by Msema (89)
How to Read Financial Statements
A company’s financial statements are a quantitative picture of the company’s operating performance and financial position. They consist of three different statements:
- the income statement,
- the balance sheet and
- the cash flow.
The income statement shows how much money a company has made in a given time period (one full year for an annual income statement). The balance sheet shows financial position including all the items a company owns and all the debts it is obligated to pay. The cash flow statement shows cash coming into the company and cash going out of the company. This is important because it can differ from the income statement. It is also useful because it is more difficult to manipulate a cash flow statement through accounting methods only – actual cash flows would have to change to change a cash flow statement.
Income Statement
Revenues
Revenues are the total sales that a company earns in a given period. This is the sum of the money which the company has earned selling its products and services during the period equivalent to the quantity of products and services multiplied by the average selling price of those products and services.
SG&A
SG&A stands for Selling, General and Administrative. This item encompasses all the other costs associated with providing a product or service that is not included in the costs of goods. These include costs associated with marketing a product, including advertising and the cost of salesmen. General overheads such as the costs associated with a central finance and accounting department and certain managerial functions are also part of SG&A.
Gross Margin
A gross margin is calculated by taking gross profit (what is left after subtracting cost of goods from revenues) and dividing by revenues. Gross margins are usually expressed in percentage terms. A high gross margin indicates that a product or service can be sold for much more than it cost to produce, indicating a higher chance of overall profitability for the company.
Operating Margin
Operating margin is calculated by taking operating profit (gross profit less SG&A costs) and dividing by revenues. Operating margins are also usually expressed in percentage terms. An operating margin is probably an even more important statistic than gross margin as it is an indicator of core profitability of a business taking into account not only direct costs of producing a product or service but also the associated costs of managing the business and trying to get the product sold. Sometimes a company may have a high gross margin but a low operating margin because the costs associated with getting its products sold are too high. If operating margin is high, it is likely that the company is a good business.
Net Margin
Net margin is calculated by taking net profit (operating profit less all non-operating expenses) and dividing by revenues. Net margins are usually expressed in percentage terms. Net margin indicates the total accounting earnings of a company in a given time period (this can differ from cash earnings of a company as explained in more detail below). Oftentimes net margins can be distorted in a given year if there are unusual non-operating items. Restructuring charges can often reduce net profits from their normal levels in the years that such charges are taken. Unusual tax charges or credits can also alter the net margin picture. Net margins and operating margins are both important. However, interpreting net margins generally requires more work and care.
Balance Sheet
Assets
Assets represent all of the things that a company owns or is owed by others. These include property, plant and equipment. Also inventory, accounts receivables, cash and investments. Note that these assets can have loans on them (as property might) or be money owed to the company but not actually in the company’s possession (as accounts receivable are).
Liabilities
Liabilities are what a company owes others. This can include bank loans. Loans, in turn, can be mortgages (as on property) or they can also be more general lines of credit which a company uses to have more cash to conduct its business. Accounts payable, which is money owed to its suppliers for products and services already received, also count as liabilities.
Equity
Equity is what’s left over after subtracting liabilities from assets. This can be seen as a representation of the company’s net worth. If the accounting in a company is accurate, equity may be a good estimate of what a company’s owners could expect to receive for the company if the company ceased operation and was liquidated. Quite often, however, the equity account is not equivalent to this figure as some assets may not be listed at market value. This is due to the fact that accounting conventions do not always result in a company’s assets being recorded at the value they could really be sold at in the market. However, a high equity value relative to a company’s market value is usually a source of reassurance that a company’s valuation is reasonable (see the section on price/book value).
Debt/Equity Ratio
The debt to equity ratio is the sum of all of a company’s bank loans divided by its equity. A debt/equity ratio usually does not include all of a company’s liabilities. It generally includes those liabilities that are used solely for financing purposes rather than arising as a course of the company doing business. This generally means both short and long-term bank loans are included. However, accounts payable are generally not included.
A company’s debt/equity ratio can give an indication of how risky a company’s financial position is. A relatively higher debt/equity ratio (over 2X) may indicate that the company may have more difficulty servicing its debts if it goes through a bad patch. Sometimes debt can enhance the profitability of a business if the business can earn a higher return on money than it costs the business for that money in interest expense. However, too much debt may put the business at risk for insolvency or bankruptcy if it is unable to service the debt. Also, the nature of some businesses is to have a very high amount of debt (i.e. the utility industry).
Net Debt/Equity Ratio
Sometimes a company may be holding a large amount of cash which distorts its debt/equity picture. As a result, the net debt/equity ratio is another measure which can be used to measure a company’s financial risk. Net debt is total debt less a company’s cash position. To be more useful, cash that is needed for the ongoing operations of the business should be excluded from the net debt calculation. However, in practice this is usually not done as operating cash needs are quite difficult to estimate. If a company simultaneously has a lot of debt and a lot of cash, its debt/equity and net debt/equity ratios may be quite different. In such a case, more analysis of the reasons for this variance are necessary. It is possible in such cases that a high debt/equity ratio does not signal a risky investment.
Appendix D: CAT analyst ratings
Consensus Rating Average
Consensus Rating for CAT is MODERATE BUY. Since many brokers have different rating systems, we maintain a standard system with an assigned numeric value from 1 to 5. Ratings are a translation of brokers’ recommendations to the recommendation scale, which ranges from a rating of 1 (a strong buy) to a rating of 5 (a strong sell).