Company’s Overview
McPherson’s Limited started its operations in 1860. The company is operating in two diverse segments. First is the marketing and supply of household consumer goods, and second is stipulation of books and commercial printing services. Its consumer products are the foremost marketer of non-electric house ware goods with headquarters in Australasia. The company’s operations are also held at Australia, Asia, North America and New Zealand.
It is offering a wide variety of products including kitchen utensils, cutlery, bake ware, kitchen knives, glassware, bag wraps, aluminium foils and baking papers. It also promotes and distributes a wide variety of personal and skin care products, beauty care, hair care products including cotton balls, facial wipes, cotton pads and baby wipes. “The primary brands of McPherson’s consumer products are Stanley Rogers, Crown, Wiltshire, Strachan, Eterna, Grosvenor, Cameo, Multix, Manicare, Lady Jayne and Home Living and most of them are the leading brands in their sorts” (Businessweek 2011).
Analysis and Findings
Financial ratios are considered to assist and evaluate financial statements and its internal used could be by managers to make decisions for improving company’s operations (Brigham and Ehrhardt 2001). The appendix attached to this report presents various essential financial ratios that create the basis for considerable evaluation of the company’s financial position based on the financial figures reported in the years 2008 and 2009.
Liquidity Ratio Analysis
“A liquid asset is one that trades in an active market and hence can be quickly converted to cash at the going market price, and a firm’s liquidity ratio requires the use of cash budgets, but by relating the amount of cash and other current assets to current obligations” (Brigham and Ehrhardt 2001). The current ratio of all three years reflects the value that is 1.95 in 2008, 1.80 in 2009 and 2.17 in the year 2010, which is being more than one. The current situation shows that the McPherson’s is competent enough to give its current liabilities from its current assets and by doing so the company would still hold sufficient amounts of its liquid current assets.
The quick ratio is suggesting a positive influence on the analysis, as it was 1.08 in 2008 and then fall to 0.88 in 2009 but it then again recovered to 1.03 in 2010. This specifies that even after decreasing the inventories the company is still capable enough to pay off its current liabilities. The net working capital ratio of year 2010 has been increased to $66,010 as compared to last two years, mainly because due to the efficiency gains and the merger of McPherson’s Consumer Products has been merged under one warehouse thus increasing the receivables and inventories. The receivable have been increased because the company has minimized the collection period, or McPherson’s is offering discount to the trade debtors in order to receive the debts earlier.
The inventory turnover has decreased, as this ratio tells how many times the inventory is sold and restocked per year. The decline is a negative aspect showing that the company is holding excessive inventory, which is an unproductive factor. It also signifies that the investment return is lower as compared to last years. However, the slight change in the decline does not symbolize that the company is in bad position, as company can still increase its turnover due to the positive results current ratio.
Solvency and Leverage Analysis
Solvency and Leverage Analysis is also known as Debt Management Analysis (Lasher 2007). It contains the degree to which an organization employs debt financing or financial leverage. It has three essential propositions. First, by increasing funds through debt, stockholders can retain power of a firm without risking their investment. Second, the creditors look to the equity to offer a margin of security. Thirdly, if the firm receives extra on investments financed with on loan funds than it pays in interest; the return on owners’ capital is influenced (Brigham and Ehrhardt 2001).
The company’s debt to equity ratio is declining to 0.73 as compared to year 2009 and 2008 i.e. 1.21 and 1.19. A low debt to equity ratio usually shows that McPherson has remained careful in financing its expansion with debt. Interest coverage ratio provides an immediate depiction of a company’s capacity to pay the interest charges on its debt. McPherson’s coverage ratio is increasing from 3.86 times to 5.67 times in the year 2010, which signifies a positive impact.
While the company is effectively administrating its interest costs and the company’s market value is easily increasing due to established brand strategies. According to the annual report of McPherson’s the positive impact is due to,” The margin improvement and benefit of cost savings resulting in a pleasing 18% lift in Consumer Products’ divisional, and EBIT has increased to $45.2 million compared with $38.2 million in the prior year” (McPherson’s Limited 2010).
Profitability Analysis
Profitability is the net outcome of a number of procedures and conclusions. These ratios offer an efficiency of the firm’s procedures. “Profitability ratios exhibit a collective effect of liquidity, asset management and debt on operating assets” (Brigham and Ehrhardt 2001). The gross margin of the company is 48.2% in 2010 as compared to 46.4% in the year 2009 due to a decline in direct and indirect expenses. The net profit margin is 7.2% in 2010 whereas in the year 2009 it was 5.4% and in 2008 it was the highest i.e. 7.9%.
This shows that sales are increasing, and expenses are decreasing show a highly positive affect for the company. The return on equity has increased which clearly influences that the shareholders are attaining more returns in the sense of accounting. The main reason of increase in ROE is the enhanced use of debts by the company. Since, the net profit of the company is increasing and the total equity is decreasing which represents stockholders return on their earning is maximizing. The return on assets of year 2010 is 7.54% where as in 2009 it was 5.62%.
This explains that as compared to year 2009 the company’s basic earning power has amplified. The capability of the firm to generate operating income is relatively high. The basic earning power has also increased, due to the increment in net income. This shows that overall company’s profitability position is improving. Hence, comparing it with year 2008 the profitability has slightly decreased. The asset turnover ratio in 2010 is 104.2% whereas in 2009 it was 104.1%. This demonstrates a slight increment in the asset turnover, because the company is generating sufficient business and enough sales.
Market Performance Ratios Analysis
Market value ratios help to understand the firm’s relative value. It is determined by using the market data considering the stock price to gather the essential information. The most prominent market performance ratios include price earnings ratios, book price ratio, earning per share and dividend ratios (Baker and Powell 2005). The price earnings ratio demonstrates how much shareholder is capable of paying per dollar of the given profits, so the enhanced Earning ratio signifies that it is an opportunity for the company to increase its profit margin.
Earnings per share (MCP.AX) has also amplified to 36.4 cents this year as contrast to last two years which was 29.9 cents representing a boost of 22%. The price book ratio also known as market book ratio points out how investors consider the company’s position. McPherson’s has a high return on equity (ROE) which implies that its stocks are trading at higher multiples of its book value which is also apparent from the P/E ratio values derived for both years. The market book ratio of McPherson’s is near to one and it was 1.16 in the year 2008, which signifies that the shareholders are eager to pay more stocks than their accounting book prices.
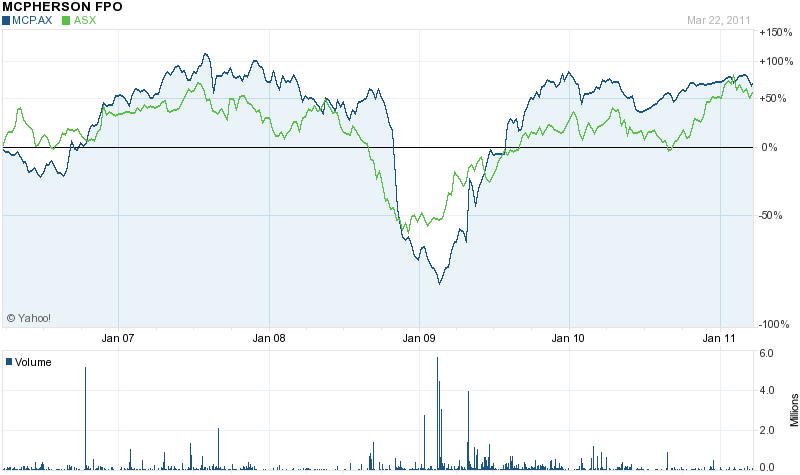
The following graph depicts percentage change in ASX Index and price of MCP.AX over the last five years. It is clear from the graph that the trend in the price of the company’s stock is similar to that of the index however, after 2009 slump in the stock values and heavy selling activity, the recovery of the company’s stock is above that of the index.
Furthermore, in addition to the ratio analysis this part of the analysis provides a careful examination of the management’s review provided in the annual report of the company. The core objective of McPherson’s is, “To increase shareholder wealth through the payment of dividends and long term share price appreciation” (McPherson’s Limited 2010). The objective can be accomplished through the help of operating businesses that are competent enough to produce higher profit margins, and by developing cash flows to attain well-matched business in order to generate growth, and boost through rationalization benefits.
Hence, minimizing the risk and progressing the firm’s competitive position in the industry. The company has established an effective dividend policy, which is, “To distribute at least 50% of the Company’s net earnings before amortization of intangibles through share holders” (McPherson’s Limited 2010). The Earning per share of McPherson’s has increased by 22% in the year 2010, as compared to last years. In addition, strong cash flows have been generated with the help of latest operations, thus reducing the bank debt and strengthening the balance sheet. The company’s business is enhanced by undertaking innovative brand strategies, and establishing an efficient supply chain process for McPherson’s Consumer Products (McPherson’s Limited 2010).
Macroeconomic Factors Affecting Business
Since, the company is operating in two different markets and its operations are not restricted to a single country therefore, the scope of the impact of macroeconomic factors is wider for the company. Like any multinational company, McPherson’s was also affected by the global economic downturn and its stock’s value plunged to its lowest. However, the impact of the downturn was well managed by the company and its sales remained strong in the last few years. Although, the company’s major markets are on the road of recovery there are expectations of another oil price crisis to hit major economies as the uncertainty in the Middle East is pushing up the oil prices.
This could lead to higher inflation and cost of sales that will have direct impact on the sales of the company and its stock price. The company’s earnings have been supported by growing currency strength which also allowed the company to hedge company’s cash flows in other currencies and it has resulted
Vertical Analysis
Major findings from the vertical analysis of McPherson’s financial statements are provided below.
- The company’s is able to generate net profit margin of 7.24% in 2010 which is up from 5.39% in 2009. The major reason for the decline in 2009 after posting net profit margin of 7.92% in 2008 was a significant increase in its cost of goods sold. Moreover, the company’s operating expenses soared up by 11.48% which had a negative impact on the company’s earnings.
- Major constituents of total assets are receivables, inventories and plant & equipment owned by the company. However, on the liabilities long term borrowings are significant despite of the company’s strategy to cut back its dependence on expensive external borrowing.
Horizontal Analysis
Key findings of horizontal analysis are provided in the following.
- The company has been able to cut back its interest obligations which have declined by almost 20% as compared to 2008. This is carried out by early repayment of loans and refinancing of external funding at lower interest rates.
- Although, the company’s cash balance has increased significantly in the year i.e. 242.66% compared to 2008 balance but this is offset by high levels of bank overdraft which the company as acquired from banks to support is operational requirements. The cash position has deteriorated in 2010 which could raise concerns regarding the company’s ability to fund its requirements from its internal sources.
- The company’s current assets have increased whereas the current liabilities have decreased in 2010 after showing highs in 2009. The company’s net assets have increased significantly compared to 2008 which suggests that the book value per share has increased in 2010.
- The trend also suggests that the company is retaining its earnings instead of reinvesting in the business. This strategy is considered to be in light of poor economic conditions and slow down in the consumer spending. However, the company should be careful with this strategy as any missed opportunity could allow new entrants or other competitors enter the market and make use of liquidity that they may have.
Limitations of Report
In this report, the financial statements of McPherson’s have been analyzed using different analytical tools to form an overall opinion regarding the company’s financial position. However, a major limitation of such analysis is that it is based on historical financial data and it may have less relevance to the present condition of the business which is of greater interest to shareholders (Brigham and Houston 2009). Moreover, the findings of the present report could have been improved by incorporating comparative industry analysis to compare the financial and ratio values of McPherson’s to its competitors (Siddiqui 2005).
Overall Conclusions
The financial statement analysis carried out in this report suggests that the overall financial position of the company remains strong in the year 2010. However, the company should take necessary steps to reduce its excessive inventory and also further cut back its borrowing. It is also indicated that the company’s stocks are trading at higher multiples which imply that the shareholders can expect a rise in its shares price in the near future.
Furthermore, detailed analysis of the market performance measures it could be suggested that the company’s stocks are trading good P/E multiples and the shareholders can expect a further increase in the company’s stock value but keeping in view the predictions of yet another major crisis on its way lead by crisis in the oil market could have severe impact on its values in the medium term. Therefore, it is concluded that investors must be cautious of their approach and wait for positive signs to appear.
List of References
Baker, K.H. & Powell, E.G., 2005. Understanding Financial Management. Malden, MA: Blackwell Publishing Ltd.
Billabong, 2010. Billabong Financial Fundamentals. Web.
Brigham, E.F. & Houston, J.F., 2009. Fundamentals of Financial Management. New York: Cengage Learning.
Brigham, F.E. & Ehrhardt, C.M., 2001. Financial Management Tenth Edition. Florida: Cengage Brain inc.
Businessweek, 2011. Mcpherson’s Ltd (MCP:ASX). Web.
Lasher, W., 2007. Practical Financial Management. New York: Cengage Learning.
McPherson’s Limited, 2010. McPherson’s Limited Annual Report. Annual Report. Melbourne: McPherson’s Limited.
McPhersons, 2011. Company Overview. Web.
Siddiqui, S.A., 2005. Managerial Economics And Financial Analysis. New Delhi: New Age International.
Yahoo! Finance, 2011. McPherson’s Limited (MCP.AX): Historical Prices. Web.
Yahoo! Finance, 2011. McPherson’s Limited (MCP.AX): Technical Analysis. Web.
Appendix A
Source: Stock Price (Yahoo! Finance, 2011).