The Concept “The Business Cycle”
The business cycle refers to the different periods through which an economy undergoes alternating phases of booms and contraction in the economy. Business cycle is characterised by various aspects. Throughout the business cycle, the economy undergoes through the periods of contraction and expansion. This comes in different periods that may be difficult to predict. The business cycle is also characterised by the periods of booms and economic contraction.
Characteristics of Business Cycle; the Behaviour of Real GDP, and the Different Types Of Inflation And Unemployment Over The Cycle
As already noted, the business cycle is characterised by various aspects that differentiates one phase from another. There are various phases through which an economy passes in the business cycle. Each characteristic of the economy have a significant impact on the employment, inflation, and the level of GDP.
During recession or the period of slow economic growth, the businesses are negatively affected. The production level is usually very low. As the business worsen the level of aggregate output in the economy decreases (Zarnowitz 45). Consequently, many people lose their jobs. This raises the level of unemployment in the economy. Similarly, the level of GDP will fall significantly following the decrease in the level of the total output. In other words, the economy is usually at hard times during hard times. Due to poor performance of business activities and unemployment, the disposable income of the people will fall. This decreases their spending power significantly, which leads to a fall in the total level of sales in the economy. This contributes to a further fall in the total output.
During the boom or vibrant economic growth, the businesses are usually performing very well. The level of production is generally high characterised by a high rate of growth (Zarnowitz 56). As a result, the total level of output is usually high. This generates employment in the economy. Therefore, the level of unemployment is usually low during the booms. Consequently, the disposable income increases. As a result, people will increase the level of their spending. This further stimulates economic growth.
During the business cycle, business passes through various phases. The point through which an economy shifts from contraction or recession to vibrant economic growth is known as the trough. At this point, the economy reaches its minimum level of output. The level of unemployment at this point is usually very high compared with the previous years. The total swales in the economy are also very low at this point. On the other hand, the level of output is usually at the maximum at the peak stage in the business cycle. This business is usually performing very well at this point. Consequently, the level of unemployment is usually very low.
Collect data for the real GDP growth, inflation and unemployment rates for Australia and the US over the period of last 10 years (since 2000). Tabulate and plot the data you obtained (To plot the series, you may use one Figure for each variable representing both countries). Compare and analyse the behaviour of these variables over time for both Australia and the US.
The Real GDP growth, Inflation and Unemployment rate for Australia and United States (2001-2010).
Data sources
- Index Mundi. Historical Data Graphs per Year.
- Market Information and Research Section, DFAT. Australia: General Information.
- Australian Bureau of Statistics. Statistics. 2011.
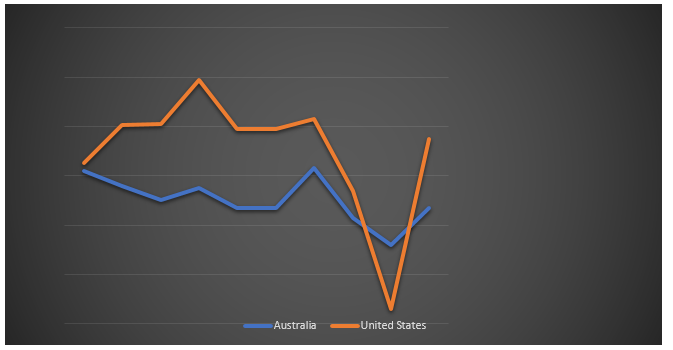
Real GDP Growth in Australia and United States

The graph above has clearly revealed that the real GDP growth rate for the US was increasing within the time period between 2001 and 2004. Real GDP is mostly applied in data analysis because it takes into account change on real prices (Boyes and Melvin 131). Meanwhile, the real GDP growth rate for Australia was decreasing, that is, the level decreased from 4.2 to 3 in the year 2003. This increased to 3.5 in the following year after which it resumed the downward trend. However, the rate of real economic growth in Australia remained constant between the year 2005 and 2006. During this period, the Australian economy came into a stand still. Later the rate began to increase once more.
For the United States, the rate of economic growth was increasing at a very high rate from the year 2001. During this period, the US economy was growing vigorously with a favourable environment which promoted economic activities in the country (Gwartney 68). This retained an upward trend in the country. However, the economy faced a time of recession from the year 2007. During this period, the economy slowed dawn after which it plunged into a recession (Mankiw 56).
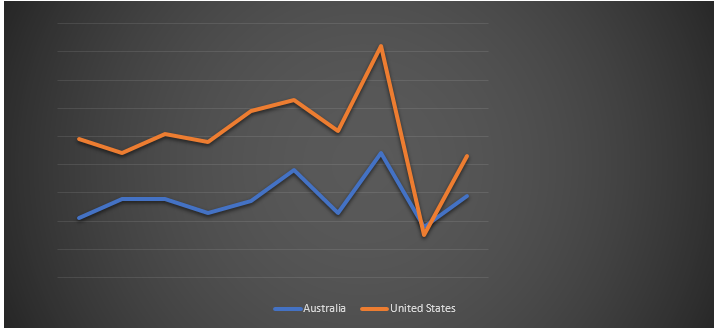
Inflation Rate Australia and United States

Between 2001 and 2002, the inflation rate was falling in the United States. After 2002, the trend was moving in the opposite direction until the year 2008. However, there were mild distortions in 2004 and 2007. After the year 2008, the country’s level of inflation falls drastically.
On the other hand, the level of inflation was increasing between the year 2001 and 2002. However, this level remained constant between 2002 and 2003. The graph above has also revealed that after the year 2004, the rate of inflation was not constant. It was increasing and decreasing with time.
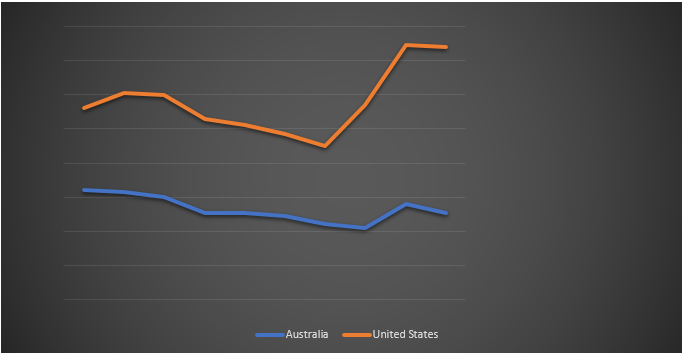
Unemployment in Australia and United States

From the year 2001 and 2002, the unemployment rate in the United States was increasing. However, it began to fall afterwards in a slow rate up to the year 2007 after which it began to rise at a very high rate. On the other hand, the level of unemployment in the Australia was falling at a slower rate from 2001 to 2008. Between 2008 and 2009, the level of unemployment in Australia was increasing. However, this trend was reversed after 2009 where the level of unemployment in the country began to fall.
Both the graphs on unemployment and inflation rates reveal a very important relationship between the rate of inflation and the unemployment rate. In each particular period, the trends of both the level of inflation and unemployment moves in opposite direction. In other words, an economy cannot manage to reduce the level of inflation and increase the level of unemployment at the same time.
Works Cited
Australian Bureau of Statistics. “Statistics”. abs.gov, 2011. Web.
Boyes William and Melvin Michael. Economics. New York: Cengage Learning, 2006.
Gwartney, James et al. Macroeconomics: Private and Public Choice. New York: Cengage Learning, 2010.
Index Mundi. “Historical Data Graphs per Year”. Indexmundi, 2011. Web.
Mankiw Gregory. Principles of Macroeconomics. New York: Cengage Learning, 2008.
Market Information and Research Section. “Australia: General Information.” DFAT, 2011. Web.
Zarnowitz, Victor. Business Cycles: Theory, History, Indicators, and Forecasting. New York: University of Chicago Press, 1996.

