Presentation of the data in tables for each variable
Table 1: Real GDP.
Table 2: Real GDP per capita.
Table 3: Annual real GDP growth.
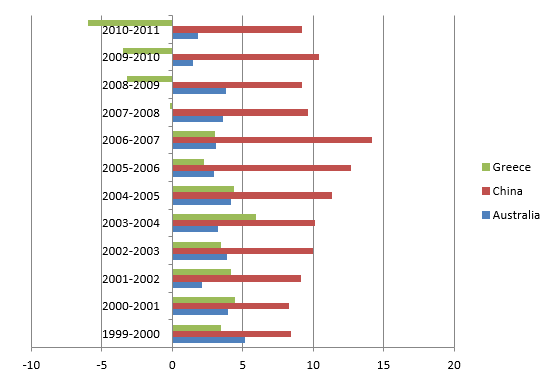
Table 4: The unemployment rate.
Table 5: The interest rate.
Table 6: The inflation rate.
Table 7: Government expenditure, taxes, and GDP for Australia and Greece.
Table 8: Annual real interest rate.
The level and movement of the variables amongst the three countries
Real GDP
China has the highest real GDP for the period while Greece has the lowest real GDP. Also, China has been experiencing steady growth in the real GDP. Australia and Greece have relatively low and constant growth in real GDP compared to China. The budgetary position of Australia and Greece has been constant and low.
The GDP per capita
Australia has the highest GDP per capita, whereas China has the lowest GDP per capita. The three countries have experienced steady growth in the GDP per capita for the period 1999-2011.
Annual real GDP growth
China has experienced the highest annual real GDP growth, while Greece has experienced the lowest annual real GDP growth. the annual real GDP growth increased from 1999 to 2007, and a decline was experienced from 2007 to 2011. Greece experienced a negative real GDP growth during the period 2009-2011, whereas Australia and China had a positive growth (The Treasury 2012).
The unemployment rate
Greece has experienced the highest unemployment rate, whereas China and Australia experienced a low unemployment rate. Greece experienced a declining unemployment rate from 1999, but the rate started to increase from 2008. China and Australia had the highest unemployment rates in 2006.
The interest rate
Greece has experienced a turbulent interest rate. The rates were high in 1999 and then declined up to 2005. In 2006, the country started to experience an increasing interest rate. China and Australia have been experiencing constant interest rates.
Inflation rate
Greece has been experiencing high inflation rates. China experienced low inflation rates in 1999, but these rates increased constantly to as high as 6% in 2011. Australia experienced relatively high inflation rates in 1999, but the rates started to decline towards 2011 (Reserve Bank of Australia (RBA) 2011).
How the GFC has influenced the economy for each country over the period
The global financial crisis started to be experienced in the years 2007 and 2008. The economies of the three countries being analyzed were affected by the GFC. The real GDP of Australia was at the peak in 2008, where china started to experience an increase in real GDP from 2007. Greece has always experienced an increasing real GDP, but from the year 2007, the country has been having a constant real GDP. this indicates that the GFC affected the three countries, and economic recovery started to be experienced in 2009. However, Greece has remained behind in achieving economic recovery after the GFC.
Australia and Greece experienced the highest GDP per capita in 2008/2008. China has always had an increasing GDP per capita throughout the years. This indicates that China was not adversely affected by the GFC. On the other hand, Australia and started to realize economic recovery in 2008/2009. Greece has experienced a turbulent economic environment during and after the GFC. The annual GDP has been on declining for Greece and China.
Greece has experienced a negative annual real GDP from 2009. China had the highest annual real GDP in 2007, but this started to decline thereafter. This indicates that china performed remarkably well during the peak of the GFC, while Greece and Australia were adversely affected by the GFC. as the GFC continued to affect the Greece economy; unemployment remained high in the country. Unemployment has been declining since 1999 up to 2008.
However, the rate of unemployment started to be experienced in 2009. the country had the highest rate of unemployment in 2011. China had the highest rate of employment in 2005/2006. Australia has maintained a constant and low rate of unemployment, while Greece has experienced the highest rate of unemployment. the GFC affected the economy of Greece to a great extent and the economy has not yet recovered from the crisis. Australia and china recovered from the GFC, and this has improved the rate of employment in the true country (Ciro 2012).
The GFC has also caused high levels of interest rates in Greece; Australia has had constant and low rates of interest rates. China has also had low and constant interest rates, even though China has higher rates of interest rates for the period 1999-2011. This indicates that the GFC did not have a significant effect on the rate of interest for China and Australia. Greece has been adversely affected by the GFC, and this has caused high-interest rates in 2011.
China has experienced relatively high inflation rates, while Greece and Australia has been experiencing fluctuating inflation rates. The inflation rates for the three countries were highest during 2007/2008 when the GFC was at peak (Kates 2011).
Analysis and contrast of the macroeconomic behavior of Greece and Australia
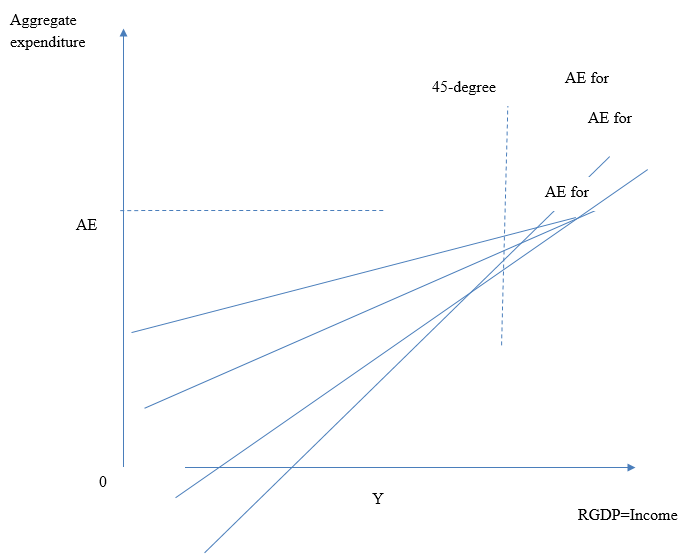
Greece has been experiencing a turbulent economic condition for a long period. The country was the worst affected by the GFC. This has made the country generate exceptionally low incomes from economic activities. As such, the GDP has been low compared to Australia. Since income is a component of consumption, investment, government expenditure, and net taxes, [Y=C+I+G+ y(r-t)], it can be said that Greece has performed poorly compared to Australia (Case & Fair, 1992).
Greece has higher tax levels, but the government expenditure is low compared to Australia. This indicates that the country has adverse economic policies to support the welfare of the people. This is also an indication that Greece has accumulated a lot of foreign debts. Therefore, most of the revenues collected from the economy is used in repaying debts rather than to use in government expenditure.
Reference List
Australian Bureau of Statistics (ABS) 2012, All Statistics.
Case, K E & Fair, R C 1992, Principles of macroeconomics. Prentice-Hall. Englewood Cliffs, N.J.
Ciro, T 2012, The global financial crisis: triggers, responses and aftermath. Ashgate Pub. Farnham, Surrey.
Department of Foreign Affairs and Trade (DFAT) 2012, Country Fact Sheet.
Kates, S 2011, The global financial crisis: What have we learnt?. Edward Elgar. Cheltenham.
Reserve Bank of Australia (RBA) 2011. Statement on Monetary Policy. Web.
The Treasury. 2012. Rebuilding after the floods. Web.
The World Bank. 2012. Economic Policy & External Debt. Web.