Definition
Crude oil, also called petroleum is an inflammable substance that is found beneath the earth’s crust. Petroleum is a Greek word, which means rock oil. So it comes from rocks, in two forms – liquid and gas. The liquid form is called Crude Oil while the gaseous form, which is also found with crude oil is called Natural Gas. Crude oil is formed from the remains of dead animals, mostly small sea animals deposited over the years. But when we talk of energy, it refers to both petroleum and natural gas. Economides, Michael J. (n.p.n.d.).
Introduction
There are certain basic economic fundamentals that govern the global crude oil market. The importance is laid on core commercial forces that shape market realities relating to the short-term and medium-term. We shall discuss the change in the structure of the oil industry in the context of balance between OPEC and non-OPEC crude oil supplies with OECD and non-OECD demand and whether this balance is enough a framework for understanding the oil market, being the scope of study in this paper. The explanation and arguments thus provided in the ensuing paragraphs will provide an analytical framework highlighting various significant structural shifts in the world oil market today. These structural shifts are explained as:
- Experience over the past ten years has shown that there is a trend of cutting down production by certain lowest-cost producing areas and the raising of production to full capacity by relatively high-cost producing areas. The two main reasons for this trend were:
- The ardent need for vast revenues by the low-cost producing countries created a wide gap between the price level at which the oil company of that nation covers all of its cost and the price level balancing the overall budget of its government. The advancement made in science and technology is also greatly responsible for cutting down production costs in the high-cost production by the governments of these countries. (Vahan, chp-2, p.25 n.d.).
Organization of the Petroleum Exporting Countries (OPEC)
Organization of the Petroleum Exporting Countries for short OPEC is a union of 12 member countries, which greatly depend on oil exports for their national incomes. Its members work together to increase their revenue from the sale of oil on the world market. The member of OPEC produces about 40 % of the world’s oil and holds about 75 % of the oil reserves. The OPEC was created in 1960 by Iran, Iraq, Kuwait, Saudi Arabia, and Venezuela. In those days, the United States and European oil companies controlled the petroleum industry in these countries. Williams, Bob (n.p.n.d.).
Royalties were paid to the host governments by the firms on the basis of oil prices these companies charged for crude oil on the world market. Oil production showed a record increase against world demand during 1959 and 1960. The surplus thus created encouraged many companies to cut the posted price and thus their payments to host governments. It was in response to this price-cut that OPEC was formed. Williams, Bob. (n.p.n.d.).
The 12 member nations of OPEC are:
- Algeria.
- Angola.
- Indonesia.
- Iran.
- Iraq.
- Kuwait.
- Libya.
- Nigeria.
- Qatar.
- Saudi Arabia.
- United Arab Emirates.
- Venezuela.
Organization for Economic Co-operation and Development (OECD)
The OECD, which is short for Organization for Economic Co-operation and Development, is an association of 30 nations from Europe, North America, and the Pacific area. The main objective of the OECD is to promote the economic and social welfare of its members and to coordinate their joint efforts to help the poorer countries. With its headquarters located in Paris, the OECD succeeded OEEC (Organization for European Economic Cooperation) in 1961. It was as a result of the Marshall Plan in 1948 that 17 European countries united to form the OEEC. According to the motive of the Marshall Plan, the US was to help Europe gain economic recovery after the latter’s huge losses in World War II (1939-1945).(Organization for Economic Co-operation and Development-OECD)
The OECD Members
Nations with their years of admission have been mentioned in the below list but those countries who became members of the OECD in 1961 do not have dates after their names:
- Australia (1971).
- Austria.
- Belgium.
- Canada.
- Czech Republic (1995).
- Denmark.
- Finland (1969).
- France.
- Germany.
- Greece.
- Hungary (1996).
- Iceland.
- Ireland.
- Italy.
- Japan (1964).
- Korea South (1996).
- Luxembourg.
- Mexico (1994).
- Netherlands.
- New Zealand (1973).
- Norway.
- Poland (1996).
- Portugal.
- Slovakia (2000).
- Spain.
- Sweden.
- Switzerland.
- Turkey.
- United Kingdom.
- United States.
Besides the above objectives for which OECD was formed, it also shares expertise and exchanges views with more than 100 other countries and economies, from Brazil, China, and Russia to the non-developed countries of Africa and Asia.
The OPEC Production
In the year 2006, the overall production rate of OPEC was about 29.500 million barrels a day. Angola joined the OPEC states at the start of this year, and her production rate was estimated to be at roughly 1.415 million barrels per day for 2006. In the month of February 2007, a rapid drop in oil production has been experienced by some OPEC member nations. With the exception of Iraq and Angola, the production rate of the 10 (ten) OPEC countries for February 2007 amounted to 26.436 million barrels per day approximately, which means a sheer drop of 304 thousand b/d. In February 2007 the total production by Iraq’s amounted to approximately 1.993 million barrels per day, whereas total production by Angola the same month amounted to approximately 1.536 million barrels per day. There was also an agreement for the overall production reduction.
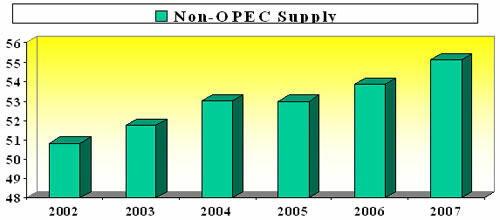
The Non-OPEC Supply
The production of Crude by the Non-OPEC is estimated to grow by 600,000 b/d in 2007 and by 900,000 b/d in 2008, which is almost half of the anticipated growth in consumption. The EIA’s estimation in the non-OPEC supply for 2007 has drastically dropped by 150,000 b/d from the previous month’s Outlook, alluding to the Gulf of Mexico & the United States’ production, which might be affected by natural calamities like typhoons or hurricanes. The actual production data, therefore, is conjectured to fall below the expectations of the first quarter of 2007. As a result, the project underway in Africa and Central and South America will continue to suffer. (Hans.n.p.n.d.)
In 2007, it was expected that the rate of non-OPEC oil supplies could increase sharply by 1.21 million barrels per day as compared to that in 2006. Therefore, almost all global oil sources had cut down the approximated non-OPEC supplies in 2007. (Summary of Oil Developments)
The Trend of Crude Oil Prices
The Rise in Crude Oil Prices
During the 1960s OPEC had little control over oil prices, especially when production had drastically enhanced in view to cater for world demand. However, the world demand for oil in the 1970s began to outgrow the production, which was accrued from the non-OPEC sources. It was in 1973 that OPEC stopped its negotiation with oil companies and raised the oil prices in proportion to inflation. Another factor that contributed to the oil price hike was the Arab-Israeli War of 1973. Many Arab countries stopped oil exports to countries that supported Israel. Resultantly the oil prices in those countries, such as Europe and the US rose sharply. The Iranian revolution (1970), creating an artificial shortage, also caused oil prices to soar. (Bob).
During the 1980’s OPEC was again not much successful in achieving its objectives when the world oil supply exceeded the demand. In 1983 OPEC forced a cut in oil prices and asked its members to control production. These production cuts, in addition to ever-increasing political instability, pushed the oil prices to the highest level of $34 per barrel. This vertical increase in oil prices forced many countries to start with their national energy-conservation programs. Besides, exploration for petroleum increased tremendously throughout the world. Geologists started exploring new petroleum reserves in Angola, Brazil, and Papua New Guinea. (Bob n.p.n.d.).
The fall in crude Oil Prices
The new explorations helped increase the petroleum supply between 1985 and 1986. This led to a fall in the prices by about 50 percent. The sudden decline in oil prices created economic problems in the developing nations, which relied much on their oil exports. Some economists believed that the collapse of the Soviet Union in 1991 was largely due to a steep fall in petroleum prices. The Soviet economy heavily depended on petroleum exports to the western countries. During the economic depression of the 1990s in Asia, the demand for petroleum greatly reduced causing prices to drop below $12 per barrel in 1998. The OPEC then reacted and reduced the exports, causing oil prices to double by 2000.(Bob, n.p.n.d.)
Organization for Economic Co-operation and Development
The OECD is an association of 30 states.The main objective of the OECD is to promote the economic and social welfare of its members and to coordinate their joint efforts to help the poorer countries. With its headquarters located in Paris, the OECD succeeded OEEC (Organization for European Economic Cooperation) in 1961. It was as a result of the Marshall Plan in 1948 that 17 European countries united to form the OEEC. According to the motive of the Marshall Plan, the US was to help Europe gain economic recovery after the latter’s huge losses in World War II (1939-1945). (OED) Besides the above objectives for which OECD was formed, it also shares expertise and exchanges views with more than 100 other countries and economies, from Brazil, China, and Russia to the non-developed countries of Africa and Asia.
The Energy Outlook of Non- OECD
The member countries of OECD today are showing a diminishing return of the world oil and energy requirements. The Middle East and Asian countries, in view of their development programs and pressure for factory fuel, are showing desperate demand for energy. The growing demand for crude oil is being met by a set of new suppliers. Russia, on account of its own fuel requirements, has already lost its role as a leading oil exporter to central and eastern Europe. European countries are now turning to oil-rich developing countries.
Crude oil is still the most widely traded of the world’s fuels. In 1971, non-OECD countries accounted for 37% of world energy requirements. By 1988, the figure rose to 51%. According to a report by International Energy Agency (IEA), the non-OECD share of world energy requirements was expected to rise even further, up to 57.2%, in the year 2005. The Gulf War served as a reminder to all member nations about the high degree of oil dependency around the world. (Smith, pg25, 1991)
Therefore, when the Gulf war took place, many of the developing countries, who were wholly dependent on Iraqi and Kuwaiti oil suffered immensely especially from the ongoing UN embargo. In Asia alone, pre-war imports of Iraqi and Kuwaiti Crude Oil were estimated at 515,000 barrels a day. With the Iraqi invasion of Kuwait, much of that was lost. This loss, especially suffered by some of the poorer Asian countries, was never recouped in spite of the increased production in Saudi Arabia, the United Arab Emirates, and Iran. (Smith, pg25, 1991).
The Crisis in the Gulf crisis was in fact a clarion call and a reminder that the IEA simply cannot wander away far from its fundamental principles and motives for which it has been formed, in other words, it cannot ensure energy replenishments in times of emergency. Thus there are now regional emergency systems installed practically in every continent such as Asia, Latin America, and Africa, and through which oil-producing neighboring countries can easily come to their aid in times of acute and drastic emergency. (Smith, pg25, 1991).
Instability in Oil Market
The oil prices around the world moved dramatically in the 1980 s as they did in 1970 decline from a high of $35 per barrel in 1981 to a low of $10 per barrel in 1986. It was only after Saudi Arabia introduced a policy of penalizing OPEC and non- OPEC producers by flooding the oil market. This Saudi Arabian policy pulled the price back up to $18 or $19 a barrel, although on the face of it seemed unlikely that these prices will sustain.
The fall in oil prices has greatly diminished the search avenues for new energy sources and has drawn away from our attention from the costs that current oil price instability imposes on the economies of both producing and consuming nations. It is therefore inferred that the fall in oil prices in 2007 has not ushered in a new era of long-term stability but instead is laying the foundation for a new energy crisis. The numerous organizational problems of OPEC and the fall in oil prices are not really the result of the relationship between supply and demand, but it is OPEC’s present condition, which speaks for the primary shifts that have taken place in the international oil regime. The most sensitive issue at risk has been the responsibility for regulating the world oil market.
When OPEC was formed in 1960, international oil companies governed the world oil regime through long-term contracts with the oil-producing nations. Although at its start in 1960, OPEC lacked the strength to act as a truly effective alliance, yet it did successfully managed to force the major oil companies to accept tax system changes that were favorable to producers. And in 1968 it issued a declaration of objective, which included achieving control over its oil resources and nationalization of concessions. (George, pg297, 1987).
After the 1979 -80 OIL price hike, when excess supplies began to develop, the situation entirely changed. Consumer countries and oil companies terminated all existing long-term supply agreements, and instead of turning to the spot market, where they could benefit from constantly falling oil prices. By now, an estimated 80 percent of world oil is sold at prices that reflect the free market. (George, 1987, pg297)
In late 1986 Saudi Arabia coordinated a new OPEC agreement designed to fix the price of crude oil at $18 per barrel. OPEC reduced its output accordingly, and at first oil prices did rise, to the $18-$19 per barrel range. But by the end of January 1987 prices once again began to weaken because of the continued excess in world oil supplies. Despite a firming of prices in late February 1986, the market then was still far from long-term stability. Then the year 1987 witnessed a confrontation in the world oil market, as Saudi Arabia had led OPEC in direct confrontation with the international oil companies that were reluctant to sign up a long-term binding contract at official oil prices which the OPEC decreed.
OPEC Re-adjusts to World Crude Oil Demand
The (OPEC) has lately amended its Crude Oil supply schedule so as to meet the world demand requirement for oil in the year 2007 – says the international oil market report in its latest monthly issue. According to the report, the world demand for crude oil for 2007 would now be 85.75 million barrels per day on average. This amounts to nearly1.52% of an increase as compared to the previous year (2006). OPEC also estimated the world’s daily average demand for crude oil at 87.09 million barrels in 2008, increasing by 1.56 % this year and finally revised down by 0.01 % from the September forecast.
Because of rapid economic development in India and China OPEC expected world economic growth to rise by 5.1% in 2007 and 4.9% in 2008, which was larger than its previous estimation. It is in the light of these estimated figures by OPEC that balance in crude oil supply and demand would be maintained in the coming years so also the crude oil reserves in the major consuming countries would keep secure. Also from the figures shown in this report, it is clear that the practicable inventories in the US and other nations that are members of OECD would still be higher than the last five years average level.
The report had information about such powerful factors as, the development of the world economy, supply of oil by non-OPEC geopolitical security, and the climate in winter that continued to exist in the international market. (China View-Business)(n.p.n.d.).
In September 2007 the OPEC’s overall output of crude oil on average reached at least 30.61 million barrels a day. This was a clear indication of a little increase in the output when compared to the previous month. Also, the monthly oil prices on average reached at least 74.18 US dollars per barrel, which means an increase of $5.47 is higher than the August 2007 price. (China View-Business).
The Global Economy and World Oil Market Developments
In view of the US and China’s emerging economies, it is expected that the world economy would grow at the rate of around 5 %. But despite the increased spending by the consumer and exploring more job opportunities in the US, the economic sources in the USA adjusted the estimates in their growth by 2.2% in the fourth quarter of the previous year (2006), as compared to the growth rate of 3.5% that was anticipated according to initial estimates. It was also envisaged that in the year the 2006 approximated gross domestic product growth could be dropped by three percent at the most. (Developments in the oil market 2007).
The Crude Oil Demand Worldwide
The recent estimations show that the global demand will grow during the current year (2007) by about1.4 a million barrels a day, as compared with 850 thousand barrels per day in the previous year. This estimation comes with the forecasts for the drop in oil and petroleum from their last year’s recorded levels. Certainly, the oil overall demand will relate manly with some Middle East countries, China, and most importantly the US. As a matter of fact, if the non-OECD average demand is increase, it would trigger the demand for crude oil by some sixty-six percent at the global marketplace (Summary of Oil Developments).
Below are some of the factors that can be ascribed to crude oil demand in the present.
- Maintained world economic growth at firm rates.
- An uninterrupted demand gain in the establishing nations like India, China, and some Middle East countries.
- The increase in the global demand for oil will focus on the second half of 2007, at the rate of 1.7 million barrels per day, compared with approximately 1.2 million barrels per day, which will be recognized in the first half of the current year.
OPEC Speculates World Oil Demand
The group has mentioned OPEC’s speculation on world oil demand in the recent past. From OPEC’s monthly oil market report, oil figures have been raised by 20,000 barrels per day. Also, the yearly demand growth is expected to be approximately 1.34 million barrels per day in the future, with non-OECD countries accounting for 1.1 million barrels a day, which means 79% of the total.
The next year’s corresponding figure was left unaltered at 51.36 million barrels per day. Hence the call on OPEC for the next year is expected to fall to 30.82 million barrels a day, which amounts to 10,000 barrels a day more than its estimate made previously. (Platts.)
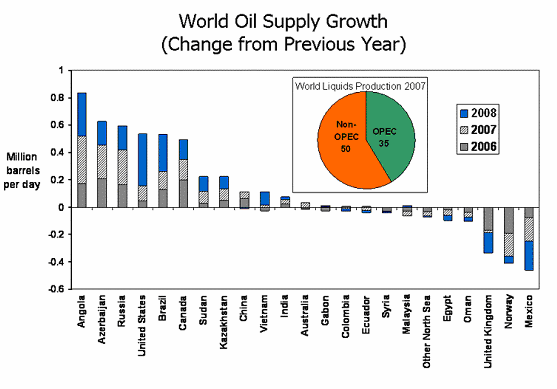
Energy Outlook as of July 2007
The above chart highlights the change brought upon by the countries previous year’s oil supply for the preferred countries. The point worthy of note is the drop in Mexico, Norway, and the United Kingdom and the highs from Angola, Azerbaijan, and Brazil. (World Demand for Crude Oil).
From the statistics collected worldwide, it has been found that the demand for oil will never cease to raise, the price being the core-balancing feature between the current supply and demand. The middle classes in the other parts of the developing countries will also impel the demand for oil. Therefore it is anticipated that the price of crude oil will continue to move ahead and still higher as the global demand continues to be felt. Hence there should be no doubt in our minds as to witnessing the oil price at $80 ultimately. (Hans. 2007).
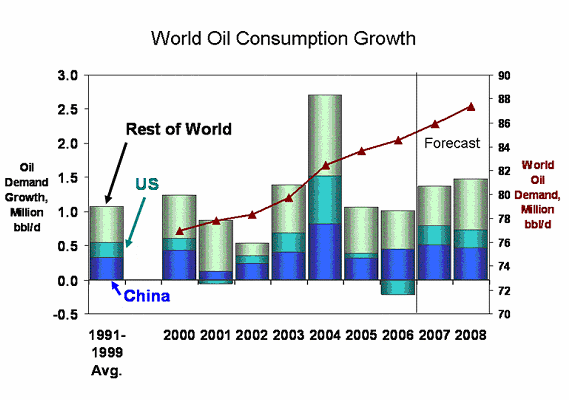
The Energy Outlook as of July 2007
The above chart shows the EIA’s estimation of the world oil consumption growth. The prominent feature to be seen here is the forecast for an upward rise in the growth of demand for oil that is marked by the dark red line. The large increase in the demand for world oil has been affected by especially the growing global economy and that is also very true in the case of India, China, and the rest of the world. (Hans. 2007.)
Conclusion
As mentioned earlier, there are different ways by which people look at the realities of the global oil market. But for understanding the commercial dimensions of the global crude oil market, the pertinent-most framework is the one that meets the under-mentioned standards:

The framework should focus on those geographic regions, which have great commercial relevance. The selection of the regions should be based upon:
- Quality of the crude oil.
- Refinery complications.
- The final demand structure.
- Export methods, and routes adopted for the tanker.
- Production methods and tendency.
- Considerations for data geographic location.
Is based on a commercially relevant time structure that takes into account patterns of seasonality in crude oil and product markets and the timing of refinery turnarounds and crude oil maintenance shutdowns.
The framework also acknowledges the fact that a very large proportion of the world’s crude oil reserves is owned by governments and that decisions affecting investment in new capacity, as well as in production and exports, are still largely taken by the government.
The framework should take into account the increasing effects that the paper markets are having over physical markets, and tries to factor the speculative dimension into the analysis. Vahan (chp-2, p.44 n.d.).
Work Cited
Economides, Michael J. Petroleum. 2007. Web.
Williams, Bob. “Organization of the Petroleum Exporting Countries (OPEC)”. 2007. Web.
“Organization for Economic Co-operation and Development (OECD). 2007. Web.
Table: Members of the OECD. 2007. Web.
Zanoyan, V. “A Relevant Framework for Understanding the Global Crude Oil Market”. 2000. Book by Vahan Zanoyan.
David Stewart Smith. An Energy Outlook for Non- OECD Countries. 2007. Web.
George C. Georgiou. “Oil Market Instability and a New Opec”. World Policy: vol: 4. (1987). Web.
London (Platts) “OPEC raises 2007, 2008 world oil demand estimates by 20,000 b/d.” 2007. Web.
OPEC Revises forecast for world crude oil demand. 2007. Web.
“Summary of the most significant developments in the oil market 2007”. Web.
Sommer, Martin (Ch. IV) Will The Oil Market Continue To Be Tight? 2007. Web.
Table: Members of the OECD. 2007. Web.
Wagner, Hans. Crude Oil Going To $80 a Barrel? -Supply of Oil. 2007. Web.