Introduction
The Gulf Cooperation Council (GCC) consists of Arabic States within the Gulf region. The members of GCC are Kuwait, Qatar, Bahrain, Saudi Arabia, Oman, and United Arab Emirates. Interestingly, all the members of the GCC are monarch states. Under the GCC pact, the member states have experienced robust growth over the last 20 years as a result of integration of economic policies and liberalization of their markets.
As a result, the trade among member states has expanded due to integrated market regime, which promotes the interests of each member. Despite the current challenges as a result of different level of economic performance in each member state, the GCC bloc has been successful in promoting complete and strategic economic partnership in the Gulf region. The GCC has created a common market and monetary union within the region since its establishment more than thirty years ago.
This paper will review the GDP of the GCC countries during the past twenty years in order to establish the trend and fluctuations. Besides, the paper will present the underlying reasons for the fluctuations in the trends observed for each country during the 20 years period of review. Specifically, the paper will highlight period when the GDP was highest and lowest for each country and provide a detailed analysis of the reasons behind the each trend. The entire paper is supported by charts, graphs, and tables to aid the analysis of GDP trends in Kuwait, Qatar, Bahrain, Saudi Arabia, Oman, and United Arab Emirates in the last twenty years.
Rationale for the Project Title
The rationale for selecting the topic based on the GDP trend for member states of the GCC bloc in the last twenty years was informed by the fact that such analysis may present a clear picture of the current economic position of the Gulf Cooperation Council. Besides, the trend might be instrumental towards predicting the future growth of each member state as part of the general market strength of the GCC.
In addition, the analysis of GDP trend for a period of more than 18 years is sufficient to predict future growth and decline in economic trends in each member state of the GCC. Lastly, the rationale for selecting the GCC bloc was informed by the fact that member states have a common market and monetary union. This means that the member states operate within the same economic regime. Therefore, analyzing the GDP trend in each member state of the GCC is sufficient in establishing the relevance of the Gulf Cooperation Council, in terms of economic liberalization in the Middle East.
Bahrain
Data
Chart/graph
Discussion
A review of real GDP and percentage change over the 20-year period shows that there was a continuous growth in GDP of Bahrain. The GDP grew from BHD4.565 billion in 1995 to BHD11.617 billion in 2015. The economy did not report a decline in real GDP during the entire period. However, the percentage change fluctuated during the period as displayed in the graph above. Bahrain is the smallest country in terms of nominal GDP (USD) when compared to the GCC member countries.
The major source of government revenue in Bahrain is the sale of petroleum. However, the country has little oil wealth as compared to the other GCC countries. This created the need to exploit other sources of revenue. Thus, from early 1990’s the country embarked on implementing on diversification initiatives. The country embraced fiscal emancipation by expanding the economy with an intention of reducing overdependence on production and sale of oil.
The continuous growth of GDP that is displayed in the graph above can be attributed to expansion into banking, retail, tourism, and heavy industry. The banking industry is quite successful and is considered to be one of the major contributors of economic growth. Also, the country benefited from oil boom that was experienced since 2001. The revenues generated during the period of oil boom were used to built infrastructure and other projects that improved the GDP and overall standard of living (Global Investment House 90).
This also contributed positively to growth in GDP. Also, success of events such as Bahrain Grand Prix played a significant role in improving trade relation of the Kingdom and other countries. This had a positive impact on the GDP. The fluctuation of GDP in USD can be attributed to movements in exchange rate and other economic factors.
Kuwait
Data
Chart/graph
Discussion
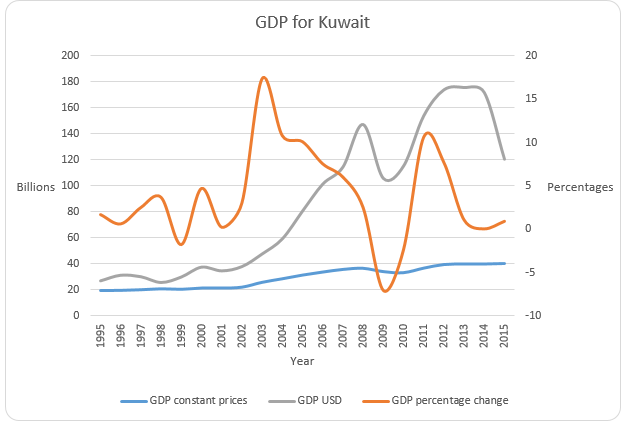
The data and chart above shows that there was a general increase in the real GDP and nominal GDP in USD for Kuwait. However, there was a decline in the year 1999, 2009, and 2010. Also, GDP grew by small percentage in 2014 and 2015. The real GDP grew from KD19.239 billion in 1995 to KD40.174 billion in 2015. The economy of Kuwait heavily depends on oil. It is estimated that the sale of oil accounts for about 95% of government revenue.
Therefore, the fluctuations that are observed in the data and the graph above can be attributed to movements in the oil market. Further, Kuwait has a well established banking system. However, it does not contribute significantly to the GDP. The country has not been able to diversify into other sectors. This can be attributed to upbeat financial situation and other political factors such as inability to implement economic reforms due to unfriendly association between the government and the parliament. The decline in GDP that was reported in 1999 can be attributed to the inauguration of free-trade zone. This had a negative effect on GDP.
The decline reported in the other years can be attributed to fluctuation in oil market. Increasing dependence on oil industry leaves the country susceptible to external distress. This explains the low level of growth that was reported between 2013 and 2014.
Oman
Data
Chart/graph
Discussion
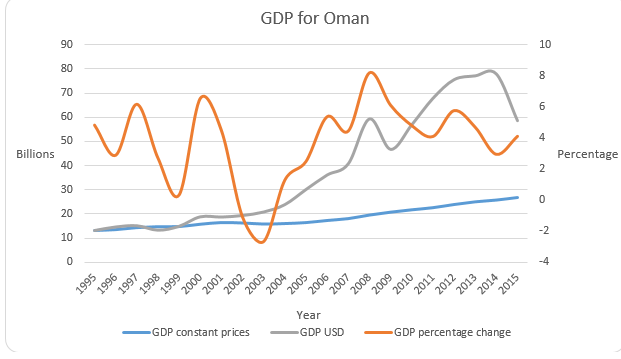
The real GDP and GDP in USD grew over the period with a slight decline in 2002 and 2003. The real GDP rose from RO13.174 billion in 1995 to RO16.993 billion in 2015. The economy heavily relies on the production and sale of oil and gas. However, overdependence on oil exposes the country to external shocks. This explains why the GDP dropped in 2002 and 2003. In the recent years, the country has been keen on expanding production and sale of natural gas.
Besides, it has put in place reforms that encourage foreign investments in electric power, petrochemical and telecommunication. Also, the government has been keen on privatization of utilities companies. Success has been reported in the implementation of economic diversification strategies. This explains the high percentage growth rate that was reported in 2012 and 2013 (Callen et al. 24).
Qatar
Data
Chart/graph
Discussion
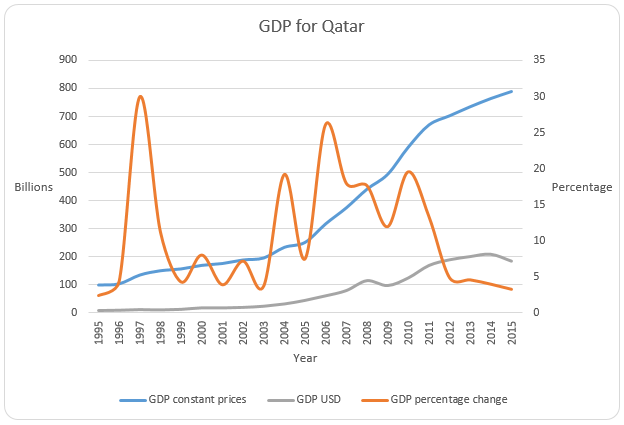
The country reported a continuous growth in real GP over the period. The real GDP grew by a large margin, that is, from QR100.123 billion in 1995 to QR789 billion in 2015. Besides, all the percentage changes in GDP were positive. This implies that the country did not report a decline in real GDP during the entire 20 year period. This economy relies on oil and gas. These two products contribute about 60% to the GDP.
Apart from the oil sector, some of the key growth drivers in the non-oil sector are heavy spending on infrastructure, expansionary fiscal policies, and incursion of workers. Even though the economy still depends on hydrocarbon revenue, the growth is currently driven by the non-hydrocarbon sectors. Further, with preparation of the 2022 FIFA World Cup, the growth prospects for the non-oil sector look brighter.
Currently, the Qatar is spending money on infrustruture such as airport, hotels and stadiums. This has a positive impact on the GDP. Thus, the government is keen on reducing reliance on hydrocarbon to a more diversified economy. Further, the country has enjoyed extended period of political stability and peace which has created a suitable environment for investment and growth of GDP (GulfBase 19).
Saudi Arabia
Data
Chart/graph
Discussion
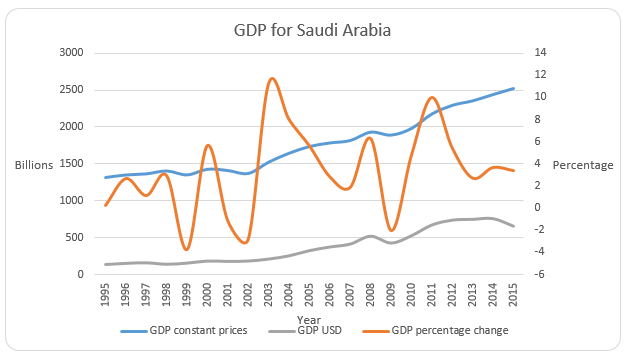
When compared to the other GCC countries, Saudi has the highest value of GDP (measured in USD). There was general growth in real GDP over the 20-year period. However, decline was reported in 1999, 2001, 2002, and 2009. The country is a major oil exporter and producer in the world. The decline reported during these periods can attributed to low oil prices, and other factors such as East Asian economic crises, unfavorable weather conditions (El Nino), and an increase in oil production by non-OPEC countries.
Oil and gas account for over 60% of the GDP. Over the years, the government has been using revenues generated from oil and gas to diversify the economy. Besides, the company has put in place reforms that facilitate the growth of the non-oil private sector. The growth of GDP can partly be attributed to the relaxation of foreign ownership rules in the 1990’s that allowed investments in crucial sectors such as financial services, telecommunication, and utilities.
The Kingdom of Saudi Arabia has been successful in implementing diversification and development plan. This has led to growth in the contribution by both oil and non-oil sector (KAMCO Investment Company 6). Since the economy depends on oil revenue, it has experienced fluctuations in percentage growth of real GDP. Such fluctuations are caused by instability in the global oil market and other economic conditions such as world global recessions among other.
United Arabs Emirates
Data
Chart/graph
Discussion
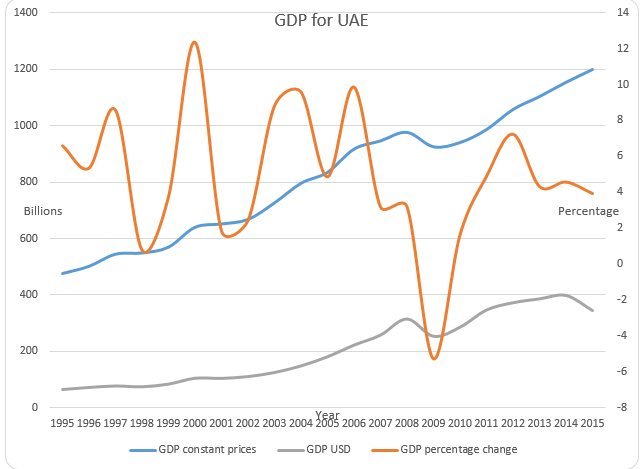
The UAE is the second largest economy in terms of nominal GDP (USD) among the GCC member states. The percentage change in real GDP shows that the economy experienced growth apart from the year 2009. Between 2007 and 2010, the country experienced a major economic crisis. This explains the decline in GDP that was reported in 2009. The UAE is most diversified economy when compared to the other GCC member states.
However, it still relies heavily on the oil sector. One of the most successful non-oil sectors is tourism industry. Besides, the government is working towards reducing dependence on the oil sector. For instance, the country opened Khalifa Port in 2012. Further, the country is expected to host the 2020 World Expo. The country has continued to expand the tourism sector and international finance. Besides, the country has created a suitable environment for foreign direct investments. These initiatives have significantly contributed to the growth of GDP over years (The Word Bank Group 1).
Difficulties Faced
The main difficulty faced in the analysis was accessing the relevant data for the Gulf Cooperation Council member states. Despite the fact that these countries operate in a common market, their GDP data is not readily available in the GCC website.
Besides, the little available data is not synthesized. As a result of this challenge, I had to spend a lot of time locating and retrieving relevant data that can be sufficient carry out GDP trend analysis in Kuwait, Qatar, Bahrain, Saudi Arabia, Oman, and United Arab Emirates. Specifically, I spent more than 24 hours in locating the relevant data since the period of analysis was spanning to twenty years. Although it was easy to get the raw GDP data for the last ten years, the most difficult part of the research was obtaining data between the year 1995 and the 2000. However, I was able to overcome this challenge through visiting the respective website of each member state and consulting available economic reports.
Conclusion
From the GDP trend analysis, it is apparent that Saudi Arabia has the highest value of GDP. There was general growth in real GDP over the 20-year period. However, decline was reported in 1999, 2001, 2002, and 2009. The decline reported during these periods can attributed to low oil prices, and other factors such as East Asian economic crises. After Saudi Arabia, the UAE is the second largest economy in terms of nominal GDP among the GCC member states.
The percentage change in real GDP shows that the economy experienced growth across the 20 years period apart from the year 2009 because 2007 and 2010, the country experienced a major economic crisis. However, the UAE has invested in economic policies to expand the tourism sector and international finance. As a result, the UAE has created a suitable environment for foreign direct investments, especially for the year 2011 to 2015. These initiatives have significantly contributed to the growth of GDP in the last five years. Unlike decline in the GDP in Saudi Arabia and the UAE, there was continuous growth in the Gross Domestic Product in Bahrain and Qatar.
In Bahrain, the GDP grew from BHD4.565 billion in 1995 to BHD11.617 billion in 2015. The continuous growth of GDP that is displayed in the graph above can be attributed to expansion into banking, retail, tourism, and heavy industry. The fluctuation of GDP in USD can be attributed to movements in exchange rate and other economic factors. In Qatar, the real GDP grew by a large margin, that is, from QR100.123 billion in 1995 to QR789 billion in 2015.
Besides, all the percentage changes in GDP were positive. This implies that the country did not report a decline in real GDP during the entire 20 year period. This was possible because Qatar has enjoyed extended period of political stability and peace which has created a suitable environment for investment and growth of GDP. Lastly, there was a decline in the GDP in Kuwait and Oman. In Kuwait, there was a general increase in the real GDP and nominal GDP with a decline in the year 1999, 2009, and 2010.
The GDP then grew by small percentage between the year 2014 and 2015. The fluctuations recorded in Kuwait’s GDP can be attributed to movements in the oil market, which the primary foreign exchange earner. The Oman’s GDP grew over the period with a slight decline between the year 2002 and 2003. The Oman economy heavily relies on the production and sale of oil and gas. Thus, the overdependence on oil resulted in the sock in the economy just like in other GCC member states. As an economic policy, the Oman government has been proactive on privatization of utilities companies, which explains the high percentage growth rate in the GDP between the year 2012 and 2013.
Area for future research
The analysis was based on real time data on GDP of the GCC member states at an individual level. However, there is need for further research to carry out comparative analysis of the GDP between the member states in order to derive a comprehensive conclusion of the trends as related to the GCC economic policies.
Works Cited
Callen, Tim, Reda Cherif, Faud Hasanov, Amgad Hegazy, and Padamja Khandelwal. Economic Diversification in the GCC: Past, Present, and Future. 2014. Web.
Global Investment House. GCC Economic Overview. 2014. Web.
GulfBase. GCC Economic Overview. 2016. Web.
International Monetary Fund. Data and Statistics. 2016. Web.
KAMCO Investment Company. GCC Economic Report. 2015. Web.
The Word Bank Group. The Economic Outlook for the Middle East and North Africa. 2015. Web.