Introduction
In conventional economic analysis, there are four market structures namely: monopoly, monopolistic competition, perfect competition, and duopoly (oligopoly). These four market structures can be said to be present in Australia. To study and understand the operations of these types of market structures in the Australian context, this research paper will carry out in-depth research on each of the above-identified market structures.
Monopoly market structure
Monopoly has been described as a type of market structure where a single seller of a good or service dominates the market (Albarran 2009). Further, this market type is characterized by imperfect competition in terms of having one seller, with a unique product that has no close substitute and as a result, consumers have no choice but to take what is offered (Arnold 2010). At the same time, there are high entry barriers and imperfect information is what characterizes monopolies (Albarran 2009). Subsequently, monopolies are regarded as price-makers and they achieve this goal by manipulating and controlling the quantity supplied to the market (Arnold 2010).
A monopoly market structure arises from different but interrelated factors that all coalesce to make it hard for new entrants to take place in such markets. Such factors include massive financial and start-up costs, little or no access to raw materials, existing monopoly firms enjoying protection from government legislation, existing firms having exclusive ownership rights, and the presence of small markets to unwarranted many operators (Tucker 2010). In Australia, excellent monopoly operators include Sugar refining (CSR) and Postal services-Australian Post.
Monopolistic competition market structure
Monopolistic competition structure has been described to exist when many sellers emerge in the market to offer products that are related and that are not perfect substitutes for one another (Albarran 2009). In this market structure, firms distinguish themselves from competitors in aspects like physical differences in the product, differences in location, quality, advertisement, promotion, and packaging (Albarran 2009). Through this, it becomes clear that a large number of sellers present in the market creates competition while on the other hand product differentiation causes the degree of monopoly power (Arnold 2010).
There is also less entry and exit barriers in monopolistic competition. More so, in this market structure, firms experience imperfect mobility of resources and there exists imperfect knowledge. Therefore, the majority of firms in this market structure vary their prices where firms may lower the product price to increase revenue (Arnold 2010). Good examples of monopolistic competition markets in Australia may be found in the clothing and footwear industries, furniture industry, and cafes and restaurants industry.
Perfect competition market structure
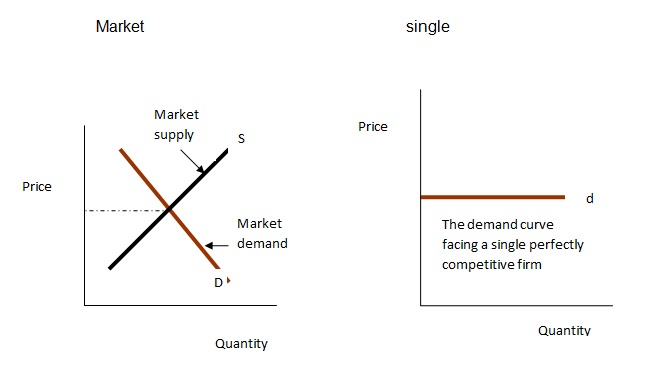
In the perfect competition market structure, there exist multiple sellers involved in selling a homogeneous product with no entry and exit barriers. In this market structure, there is no single dominating firm hence there is a higher degree of competition between the firms (Albarran 2009). The majority of firms here are price takers since buyers are the ones who determine and influence the price for a particular product and set the market price at the marginal cost. Further, firms in this market structure operate under perfect knowledge of the market (Arnold 2010). Perfect competition market structure in Australia can largely be evident in fruit and vegetable markets and stock exchange.
Duopoly (Oligopoly) market structure
Duopoly (oligopoly) market structure has been characterized to have two to six sellers of a particular product (Albarran 2009). Products produced in this market arrangement are normally substitutes and firms tend to be price makers. The product may be either homogenous or differentiated. Firms that operate under this market structure are largely interdependent where the actions taken by the leading firm in most cases affect the decisions and operations of the other firms (Arnold 2010).
In most cases, oligopoly firms restrain from making price changes regularly since such actions may lead to price wars. Apart from price competition, oligopoly firms compete based on aspects like product differentiation, advertising and restrictive practices (Albarran 2009). Market entry in a duopoly market arrangement is relatively difficult hence limiting the number of operators. Examples of oligopoly firms in Australia are evident in the grocery industry where the market is dominated by Woolworths and Coles companies.
Cyclone Yasi
Short‐run impact
Perfect competition characterizes the banana market in Australia where also the market has a fixed number of operators. Cyclone Yasi emergence is likely to impact the market of banana and other fresh produce, and this can be evidenced in a 13.8 price spike by the major supermarket. What this indicates is that Yasi together with flooding in Queen’s land and Victoria is likely to strain the supply of fresh produce in the Australian market.
Nevertheless, given how market forces operate, it is likely that some players will want to remain profitable and as a result, they will want to increase the number of banana units sold by lowering prices. In the short run, price change is likely to impact insignificantly on the banana consumption since banana is regarded to be a necessity. The below demand and supply curve indicates the overall position of the banana market before the cyclone and flooding set in. The graph postulates that the point of intersection of demand and supply curve represents the market equilibrium (price and quantity) before the price is spiked by 13.8%.
When the cyclone Yasi takes place, Woolworth response will have an impact on the equilibrium as demonstrated by the figure below.
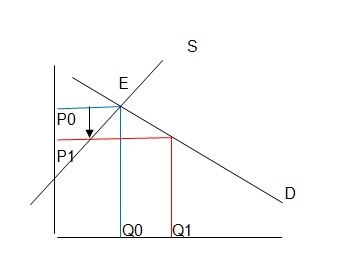
In the above figure, price drops from P0 to P1, while the quantity supplied shift from Q0 to Q1. The overall motive of sellers as exhibited by Woolworth will be to lower prices in an attempt to maintain market niche while ensuring profit is realized. In the short-run, therefore, the supermarket will be able to sell more at the reduced price, although the effects of the cyclone are likely to remain in the market for a relatively long period. This conclusion has largely been informed by the fact that in the banana market, which is perfect, consumers, are likely to be indifferent to price change given that bananas are considered a necessity. Other likely changes to be witnessed in short-run include: supply of banana reducing due to effects of floods in Queensland and Victoria, price wars are likely to emerge and intensify as the need for customers arise, although no particular seller is likely to command market power (Boyes and Melvin 2006).
Surplus in the short-run
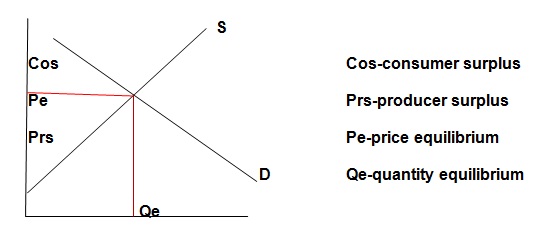
The surplus of bananas can be said to manifest in two ways: producer surplus and consumer surplus. In this case, the producer is as a result of scarcity being experienced in the production of bananas hence the supply is limited. The consumer surplus in the figure below is the region below the demand curve but above the equilibrium price (Pe). Producer’s surplus, on the other hand, is represented by region above the supply curve but below the equilibrium price point (Pe). In short-run, producer surplus equals the total revenue producers are paid less than the variable cost of production (McEachem 2010). The most the firm can lose in the short-run is to shut down and any price that exceeds average variable cost reduces the short-run loss and subsequently generate producer surplus (McEachem 2010).
In the long run, the perfect competitive market will be attractive to new entrants as prices of banana improve. This is because as the supply of banana becomes limited due to flooding in Queensland and Victoria, the prices will increase and become attractive for new entrants.
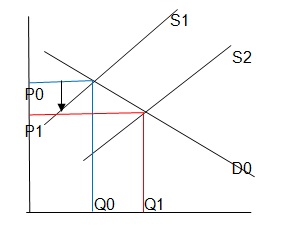
The figure above demonstrates the relationship that will develop in the long-run.
During the pre-Cyclone Yasi period, the banana market spiked by 13.8% and this led to many sellers to sale at the equilibrium price of (P0). At this price level, the sellers were able to many genuine profits. However, with the emergence of Yasi, the banana market is likely to realize an increase in supply, which will subsequently lead to a price decrease. As a result, the equilibrium price shift from P0 to P1. At this price equilibrium, consumers will increase their purchase due to reduced price and in the long run, it will be impossible to sustain many players hence exit will be inevitable. Nevertheless, other new players will be able to enter, thereby forming a pattern of entry and exist that will persist for some time until a new equilibrium is created that is relatively stable (normal profits or low losses).
Surplus in the long run
In the long run, it is doubtless that Yasi will results in increased banana supply in the market. This scenario will have benefit to both producers and consumers, for instance, producers (supermarkets) will experience lower running (operation) cost because of doing business in banana in the long run and this will motivate the entire market to have a high surplus. The effects of flooding in parts of Australia will be evident but even with this, it is anticipated that consumer and producer surplus will be high.
Price elasticity of demand
Generally, “price elasticity of demand is a measure of how much the quantity demanded to respond to change in price of the good”, which in general is expressed as a percentage change in the amount demanded divided by percentage change in price (Mankiw 2011). In Australia, the supply of banana was affected by flooding that led to a huge increase in price by almost 70%, which saw a reduction in demand by about 40%.
Ed = % change in quantity of banana demanded/ % change in prices of bananas = 40/70/ 0.57
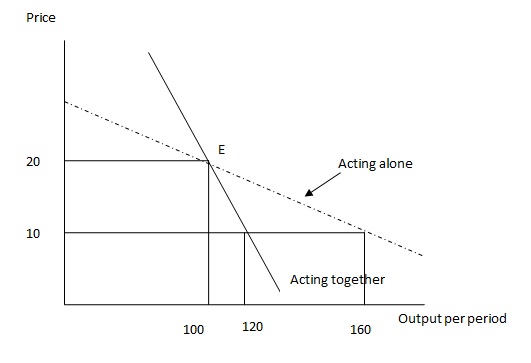
No collusion arrangement (dotted demand curve)
Payoff matrix for non-cooperative firms
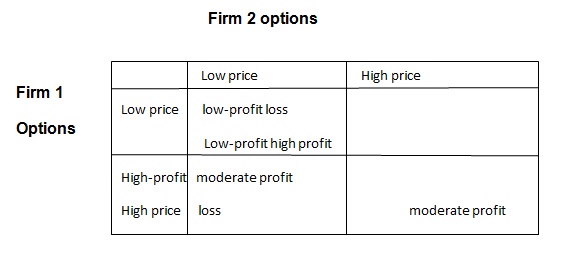
Price wars characterize non-cooperative firms. In this scenario, firms are always regarded to be archrivals and do not communicate or cooperate. Non-cooperative game theory suggests that a rational firm will choose the option that leaves it best off or least damaged regardless of what its rivals do. This can be explained in the above payoff matrix. In oligopoly, the actions of one firm usually affect other firms.
When firms in oligopoly operate without any prior arrangement of agreement, the firms engage in bitter competition and in such cases the industry usually sets the perfectly competitive price of P=MC=ATC (Wessels 1997). In the above case, firms acting alone may device price reduction strategy to woo consumers and this will see the firm reduce the price from 20 to 10 and the subsequent effect will be increase in quantity demanded from 100 to 160. In case other small firms are fierce competitors to big firms, price challenge is normally realized by the big dominating firms where reduction of price from 20 to 10 for each of the dominating firms will have insignificant differences (Boyes and Melvin 2006).
Surplus with no collusion agreement
Although the two dominating firms operate with some privileges and economies of scale, it always becomes difficult for the dominant firms to turn into monopolies. As a result, perfect competition will still characterize the market and this will result in consumers having some surplus in this market structure arrangement.
Collusion agreement
Game theory has widely been used in examining oligopolistic behaviors. In doing so, the game theory assumes that “oligopolistic behavior is a series of strategic moves and countermoves” among rival firms (Sexton 2010). Collusion agreements lead to the two firms in agreement to operate more like monopolies. Firms outside the collusion agreement (smaller firms) are likely to disadvantage especially about price changes of the dominating firms. On overall, the collusion agreement leads to two scenarios: firms only trade at the agreed price and firms’ trade at the agreed quantity. When there is respect for the agreement, then the firms are likely to operate with the below graph.
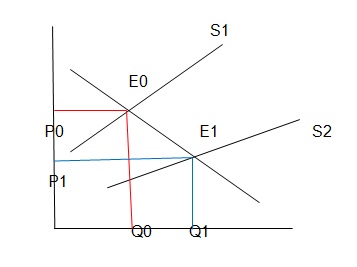
For one time interactions, firms in collusion exhibit the behaviors above as illustrated by the diagram. Here, when two firms set prices by lowering to P1, the demand is likely to grow from Q0 to Q1 (Anonymous n.d). At this point of equilibrium, the firms will be able to make profits. The scenario described above will only be possible when there is honesty and respect for the agreement by the two firms.
Surplus under collusive agreement
Collusion agreement is likely to lead to both consumers and producers enjoying increased surplus and welfare. This may be so through consumers enjoying lower prices as compared to when the agreement was not available and this will ensure customers experience higher surplus under one-time collusion agreement.
Repeated collusion
In repeated interaction between the firms, (collusion) firms tend to observe directions and actions of partners in the experiences. Subsequently, actions and moves by firms are influenced by the past actions of their partners in collusion. Since firms in this arrangement operate on long-term knowledge of each other, caution becomes the guiding principle for the firms and opportunistic strategies become the order of the day.
Lack of consultations may lead to cheating behaviors by both firms in an attempt to win market and as this accelerates, price and strategies by both firms change regularly until an equilibrium price is established by both firms. The establishment of equilibrium price, in the long run, will result from reputation firms establish over time. This reputation is normally characterized by repeated interactions that make price to oscillate between the equilibrium price of the market and price slightly lower than the equilibrium one. As a result, in the long run, consumers will enjoy a surplus.
2008 ACCC grocery inquiry
Rudd Labor government in January 2008 directed ACC to carry out a public inquiry on the issue competitiveness nature of retail prices for groceries in Australia (Clarke 2008). In its public inquiry, ACCC received over 250 submissions from the public. At the same time, ACCC researched and analyzed voluminous data and documents that were obtained from key participants (companies). At the end of the task, ACCC found out that grocery retailing in Australia was ‘workably competitive’ (Clarke 2008). Further, ACCC established that the level of competition being experienced in grocery retailing was not the primary cause of food price inflation in Australia.
In detailing how a workably competitive environment was being realized, ACCC found out that there was the sale of closely related grocery products, the majority of firms had avoided collusion arrangements and operating firms do not face long-run cost advantages (Clarke 2008). As a result of these, ACCC established that consumers manifest a lot of the intent to switch between alternative suppliers. Analyzing more findings and evidence from submission, ACCC established that the majority of firms in the grocery industry compete with each other based on aspects such as convenience, the level of service of each firm and community ties the firms had established (Clarke 2008). Price was found to be the less mechanism upon which competition was taking place.
Recommendations
In providing recommendations, ACCC stated that the reduction of entry barriers to the grocery industry was necessary to improve competitiveness in the industry. Second, the ACCC supported the overall suggestion that there is a need for the introduction of unit pricing and grocery choice pricing monitoring mechanisms (Clarke 2008). With these two in place, ACCC indicated that there would be improvement in the level of information available to consumers and this will lead to appropriate consumer information on grocery prices (Clarke 2008).
Further, ACCC recommended that there was a need for reviewing and improvement in the ‘creeping acquisition’ law to enhance fair competition and protection of small firms. Overall, ACCC recommendations resulted in a quick response from the Rudd government where it expressed its willingness to implement the recommendations (Clarke 2008). At the same time, it can be said that ACCC inquiry and subsequent recommendation has and is going to have a great impact on the grocery industry in Australia.
Conclusion
Investigation of grocery markets in Australia has been accomplished and the suggestion made is that recommendations made by ACCC have become important in revolutionalizing the grocery industry. In summary, it can be said that given the nature of grocery industry apt studies in terms of research work will be pivotal in informing policy frameworks in the industry.
Reference List
Albarran, A. B. 2009. Management of Electronic Media. OH: Cengage Learning. Web.
Anonymous. N.d. Oligopoly. Web.
Arnold, R. A. 2010. Microeconomic. OH: Cengage Learning. Web.
Boyes, W. and Melvin, M. 2006. Economics. OH: Cengage Learning. Web.
Clarke, J. 2008. Australian Competition Law: Grocery Inquiry 2008. Web.
Mankiw, N. G (2011). Principles of Economics. OH: Cengage Learning. Web.
McEachern, W. A. 2010. Microeconomics. OH: Cengage Learning. Web.
Sexton, R. L. 2010. Exploring Economics. OH: Cengage Learning. Web.
Tucker, I. B. 2010. Microeconomics for Today. OH: Cengage Learning. Web.
Wessels, W. J. 1997. Microeconomics the Easy Way. NY: Barron’s Educational Series. Web.