Introduction
The data exercise entails collecting and analyzing data for Estonia. The data analysis is carried out for a three year period, that is between 2009 and 2010. Some of the data that will be collected and analyzed are GDP, components of GDP, inflation, unemployment rate, and alternative measures of inflation.
GDP
Gross Domestic Product (GDP) is a useful indicator of the status of the economy of a country. GDP measures the total value of goods and services produced in a country within a given period. Measuring GDP is a challenge for an economist in all countries. This is because it is often difficult to quantify all economic activities in the country. This section will analyze the real and nominal GDP of the country. It will also analyze the GDP deflator for three years.
Nominal GDP
Nominal GDP is a measure of GDP that shows the value of GDP at current prices. The values have not been adjusted for inflation.
Real GDP
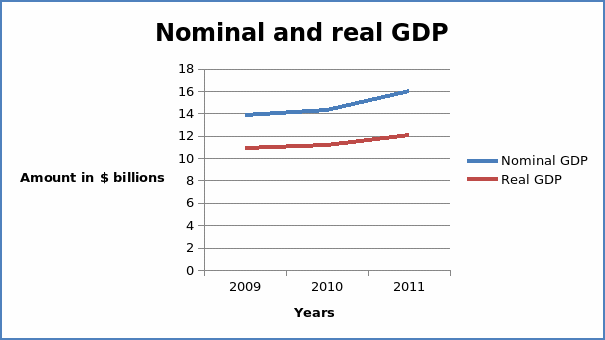
Real GDP is a measure of GDP that shows the value of GDP at constant prices. The values have been adjusted for inflation. The table below shows the values of nominal and real GDP in Estonia.
The values of both nominal and real GD have been increasing over the years. Real GDP is lower than the nominal GDP because of adjustments for inflation. The increase in values of GDP is an indication of economic growth in the country. The graph below shows the trend of values.
GDP deflator
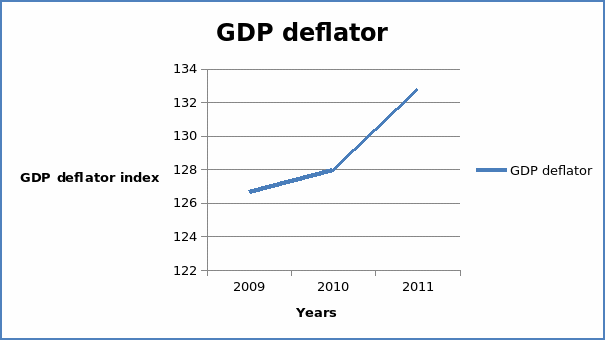
GDP deflator measures the price level of all new goods produced in the home country. It can be used to measure inflation. The values for GDP deflators are shown in the table below.
The value of the index increased from 126.621 in 2009 to 132.768 in 2011. An increase in the value of the index is an indication of increasing inflation. It implies that the general price level in the economy is increasing. The trend of the deflator is shown in the graph below.
Components of GDP
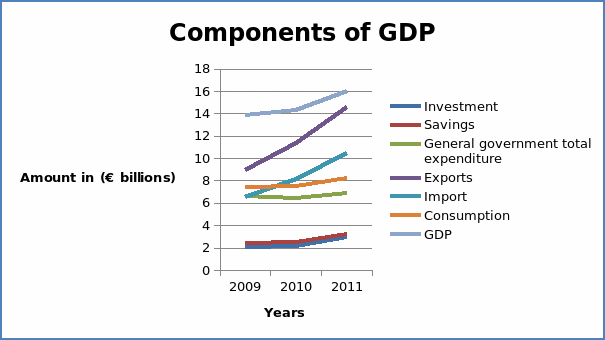
The components of GDP that are discussed below are the total amount of investment, savings, imports, exports, and general government total expenditure, These components are derived from the approaches of measuring the gross domestic product. These are income, expenditure, and value-added approach. The table below summarizes the data for the various components of GDP.
The value of various components of GDP increased over the three years. For instance, consumption expenditure increased from €7.394 billion in 2009 to €8.259 billion in 2011. Similarly, the total government expenditure increased from €6.595 billion in 2009 to €6.888 billion. Both exports and imports increased from 2009 to 2011. Similarly, investment and savings increased during the three year period. The graph below shows the trend of various components of GDP.
Per capita income
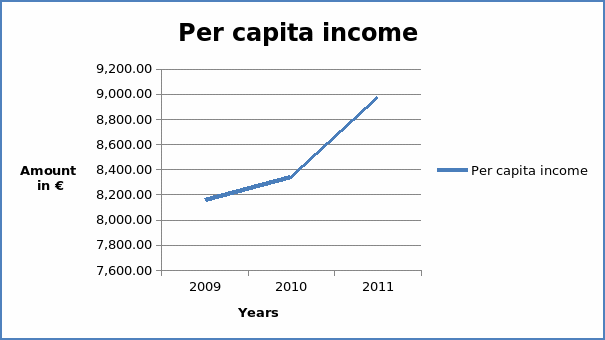
Per capita income shows income per head in the country. It is arrived at by dividing the GDP by the total population of the country. The table below shows the values of per capita income for the country.
The real per capita income increased over the years. It is a good indication since it implies that the general welfare of the citizens is increasing over time. The graph below shows the trend of per capita income over the years.
Unemployment rate
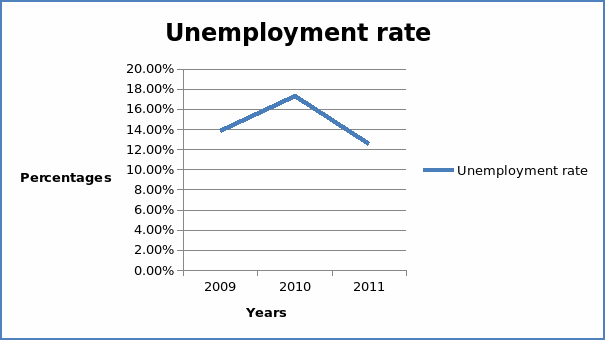
The unemployment rate measures the number of people in a country who are not engaged in an economically productive activity even though they are willing and able to work. It is often expressed as a percentage of the labor force, as shown in the table below.
The unemployment rate increased from 13.762% in 2009 to 17.256% in 2010. An increase in the unemployment rate is a bad indication in an economy since it implies that more human capital is idle. However, in 2011, the value declined to 12.476%. A decline in the unemployment rate is a favorable indication in the economy. The trend of the values is shown in the graph below.
Inflation rate
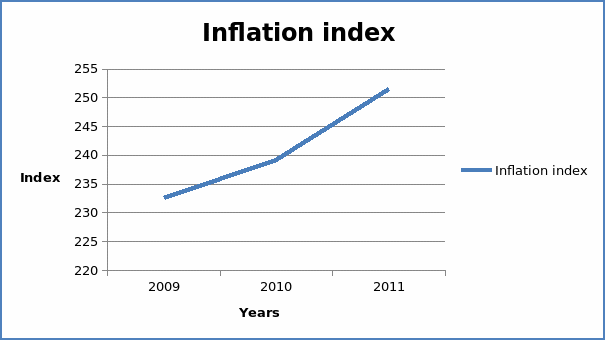
The inflation rate is a measure of the general rise in the price level in an economy. It is a significant measure since inflation has an impact on the purchasing power of individuals in an economy. The table below shows the inflation rate in the country.
The inflation index increased from 232.469 in 2009 to 251.446 in 2011. It shows an increase in the general price of commodities in the country and a fall in the purchasing power of consumers. The graph below shows the trend of values.
Unemployment by gender
Unemployment by educational attainment
Primary
Secondary
Tertiary
The different measures of unemployment were erratic during the three years. Generally, the percentage of unemployed males in Estonia is lower than that of females. Also, the percentage of unemployed persons with secondary education is higher than for persons with primary and tertiary education.
An alternative measure of inflation
Consumer price index
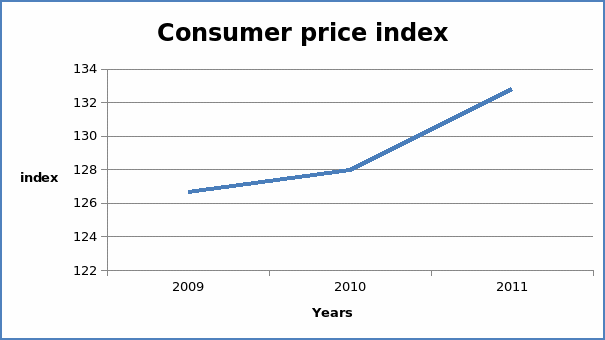
The table below summarizes the consumer price index for three years.
The measure of inflation is increasing over the three year period. This implies that there is an increase in the inflation rate in the economy. An increase in the rate of inflation leads to a loss of value of money over time. This weakens the currency of the country in relation to other countries. In addition, it affects the current account balance. The trend of the consumer price index is shown in the graph below.
