Throughout the last century, it has expanded dramatically and become a multi-billion organization that works with numerous patients in several different areas. It aims to provide the highest quality of service while remaining profitable and satisfying its shareholders. This report will investigate its financial situation based on the 2018 financial documents provided in the appendix and determine whether the organization is performing satisfactorily.
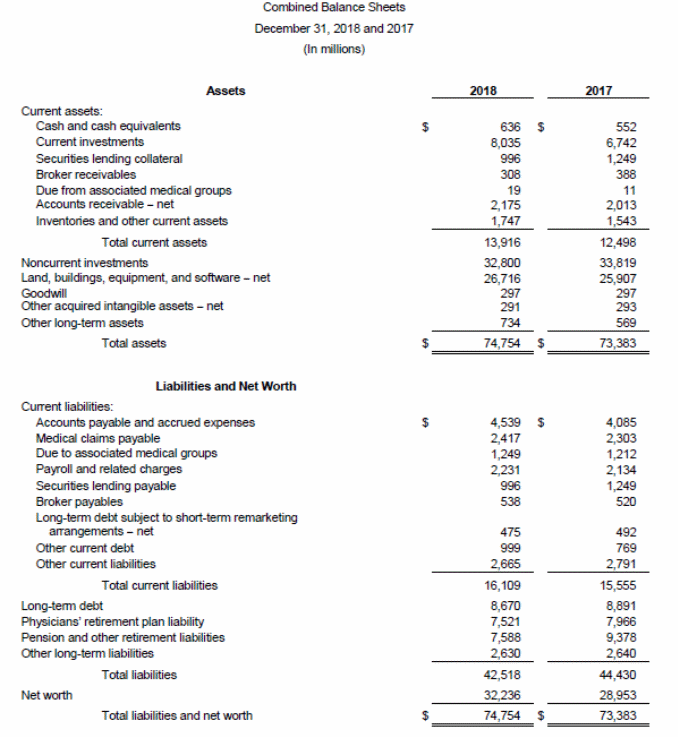
The company’s current ratio, defined as current assets divided by current liabilities, is 0.86. This result is troubling, as it shows that the company currently may not have enough resources on hand to fulfill its short-term obligations, but it does not provide the entire picture. The collection period is challenging to determine, as the organization does not list its credit sales, net or otherwise. If it were available, it would be best if the company were to have a modestly low value, demonstrating reasonable credit policies and efficient collection. Days cash-on-hand is calculated as cash and short-term investments divided by daily cash operating expenses, equivalent to 40.67 days. Per Duchac et al. (2016), a figure above 50 days is preferable, raising concerns over the company’s liquidity. The average payment period, which is the average accounts payable divided by the total credit purchases and multiplied by 360 days, is also unknown because the organization does not list its credit purchases. Ideally, it should be low, as it would make the company’s purchasing more flexible.
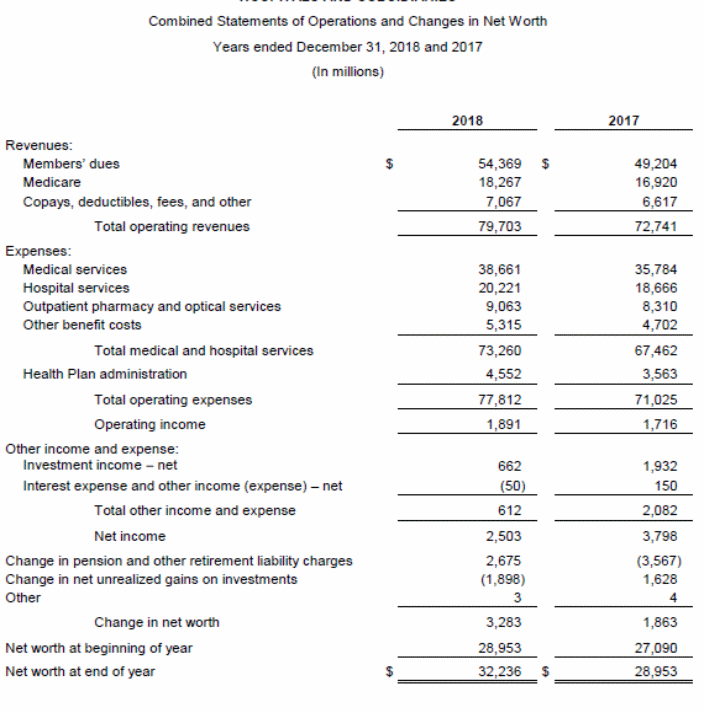
The operating margin, which is operating earnings divided by revenues, is 2.4%. With that said, the metric is not useful without a reference and will be discussed later during the comparison with industry averages. The total margin, which is the net income divided by total revenue, is 3.1%. The difference indicates that non-operating activities generate a substantial portion of the company’s income. Lastly, the return on net assets, which is net income divided by the sum of fixed assets and net working capital, is 10.2%. The number is substantial and indicates that the organization can generate considerable value in the long term.
The company’s total asset efficiency, which is defined as operating revenues divided by the business’s total assets, is 1.07. It demonstrates that the business’s possessions are being used reasonably well, considering its nature as a service provider. The average plant age, generally calculated by dividing accumulated depreciation by depreciation expense, cannot be calculated, as the documents list neither statistic. Ideally, it should be as low as possible to indicate that the business’s facilities are new and modern. The fixed asset turnover, which is operating revenues divided by fixed assets, is 2.98, showing effective usage of said assets. The current asset turnover, defined as operating revenues divided by current assets, is 5.73, which is also a positive result that indicates efficiency. Lastly, the inventory turnover, which is operating sales divided by average inventory, does not apply in this case due to the nature of the business.
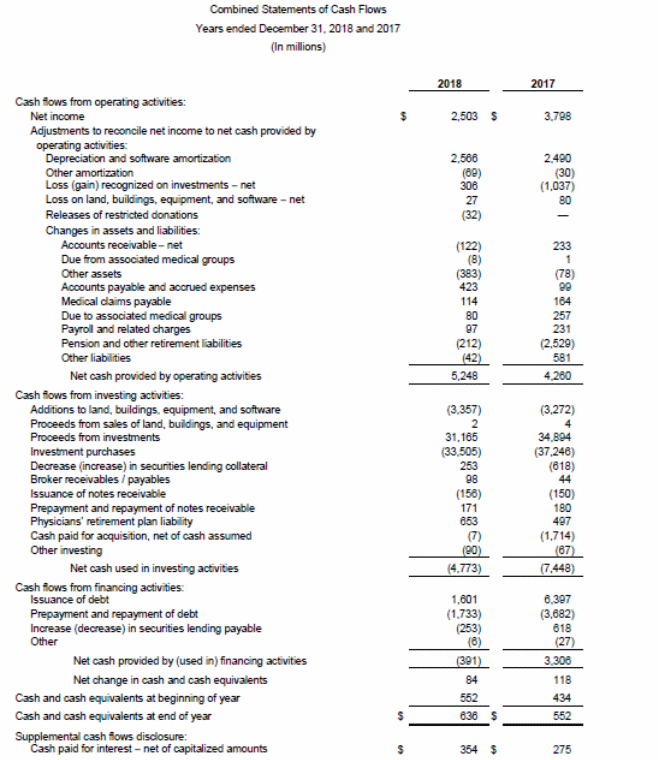
The net asset financing, which is the company’s net assets (net worth, in this case) divided by its total assets, is equal to 43.1%. Similarly to the current ratio, the figure is below 50%, which means that the company’s assets are lower than its liabilities, which can be concerning to creditors. The long-term debt to capitalization ratio, defined as its long-term debt divided by the total available capital, is 26.9%. This ratio is mostly in safe territory, where the company relies on debt to a healthy and reasonable extent. The debt service coverage, which is the net capital divided by the total debt service (also known as current debt obligations), is 3.29. The value is safe, demonstrating that, in most scenarios, the company will be able to pay back its existing commitments. Lastly, the cash flow to debt ratio, defined as the cash flow from operations divided by total debt, is 51.7%. Indicating that the company could theoretically repay all of its debt in two years, this indicator implies robust financial health.
Many of the organization’s financial operations are on par with the industry, but some results are troubling. Per Folland et al. (2016), hospitals’ total margins are typically closer to 4% under normal circumstances compared to the organization’s 3.1%. Moreover, Keuffel et al. (2019) claim that a current ratio of 2 or more is generally considered healthy for a healthcare company, whereas the business in question has it below 1. To address these problems, the organization should attempt to reduce its costs and introduce more efficient operations. In doing so, it will be able to lower its expenses and liabilities, becoming capable of reliably satisfying its short-term obligations.
Overall, though the company’s long-term financial health is in good condition, there are issues with its short-term viability. It can currently finance its operations by taking on more debt, but eventually, the problem will need to be addressed, or the long-term health will decline, as well. The deficiencies identified in this analysis suggest that measures to reduce costs are necessary to ensure that the company can improve its current outlook.
References
Duchac, J., Reeve, J. M., & Warren, C. S. (2016). Corporate financial accounting (14th ed.). Cengage Learning.
Folland, S., Goodman, A. C., & Stano, M. (2016). The economics of health and health care (7th ed.). Taylor & Francis.
Keuffel, E. L., Preker, A. S., & Beciu, H. (2019). Financing the education of health workers: Gaining a competitive edge. World Scientific Publishing Company.
Appendix A
Financial Statement – 1

Appendix B
Financial Statement – 2

Appendix C
Financial Statement – 3


