Hyatt Inc. is a company in the hotel industry, and its operations are affected by various factors. Conducting financial analysis of the company will help improve its performance in the industry. The industry has many companies competing in the global markets. The financial ratios of the company will help develop better recommendations of overcoming stiff competition in the market. In this analysis, the financial performance of Hyatt has been evaluated against that of Starwood Hotels & Resorts and Marriott International Inc. (Warren, Reeve & Duchac, 2011).
Financial Analysis
- Competitor #1: Starwood Hotels & Resorts
- Competitor #2: Marriott International, Inc.
Liquidity
Net working capital = Current assets – current liabilities = 2165 – 596 =1,569
![]() =2165/ 596 = 3.63
=2165/ 596 = 3.63
![]() = (1,110 + 21 + 280)/ 596 = 2.50
= (1,110 + 21 + 280)/ 596 = 2.50
Activity
Profitability
![]() = 69, 481.90/3, 527= 19.70
= 69, 481.90/3, 527= 19.70
![]() = 42,324/ 3, 527 = 12.00
= 42,324/ 3, 527 = 12.00
![]() =70.54/ 3527 = 0.02
=70.54/ 3527 = 0.02
![]() = 45, 123.89/ 7, 243= 6.23
= 45, 123.89/ 7, 243= 6.23
![]() = 1535.40/ 5118= 0.30
= 1535.40/ 5118= 0.30
![]() = 3.12/ 0.30=10.40
= 3.12/ 0.30=10.40
Overall Analysis and Recommendations
Liquidity
Liquidity ratio measures the creditworthiness of a company. This indicates the ability of a company to repay its debts. Liquid firms can meet their short term financial obligations when they are expected. Hyatt had a net working capital of 0.26 in 2010 and 1.15 in 2009. This shows that the company had a high liquidity ratio in 2009 than in 2010. Compared to Starwood Hotels & Resorts which had a net working capital of 1.48, Hyatt had a lower liquidity ratio. Marriot had a net working capital of 0.16. Comparatively, Hyatt has a higher ability of repaying its debts (liquidity ratio) than Marriott, but has a lesser capacity of repaying debts than Starwood. The current ratio for Hyatt was 3.03 in 2009 and 3.00 in 2010. Starwood had a current ratio of 1.08 while Marriott had a current ratio of 1.26. The quick ratio for Hyatt was 0.16 in 2009 and 2.5 in 2010. This shows an increase in the quick ratio. Starwood had a quick ratio of 1.11 in 2010 while Marriott had a quick ratio of 0.76. Therefore, Hyatt has a better quick ratio than any of the two companies in the market (Daily Finance, 2011).
It is important for the management of Hyatt to improve its liquidity ratio by reducing its liabilities. This will help improve its ability to repay debts in the short term. Repaying debts on time will improve the relationship with suppliers and investors. This strategy will help reduce conflicts with stakeholders in the market. The long term survival of Hyatt in the market will be determined by its relationship with suppliers and customers. Therefore, the company should ensure that all liabilities are settled down before conflicts arise. On the other hand, debts owed by customers should be collected in a timely manner to improve the solvency of the company.
Analysis of the firm’s activity
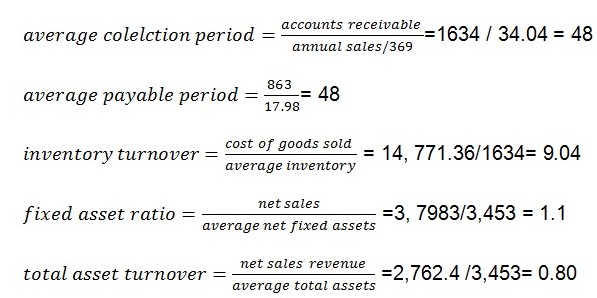
Average collection period shows the period taken to make orders and collect them from the suppliers. Hyatt had an average collection period of 48 days in 2009 and 2010. On the other hand, Starwood had 36 days and Marriott had 25. Marriot has the highest level of efficiency because it has the shortest collection period of 25 days. Hyatt had an average payable period of 48 days in 2009 and 2010. Starwood had an average payable period of 36 days while Marriott had 25 days. Marriott indicates better efficiency in bits supplies collection and payment processes. In 2009 Hyatt had inventory turnover of 11 while in 2010 it had 9.04 inventory turnover (Money Central, 2011). The inventory turnover shows the rate at which inventories are entering and leaving the business. Hyatt has a good inventory turnover than any other company in the market. Marriott had 6.97 and Starwood had 4.51 inventory turnover rate. Hyatt has the high efficiency in fixed asset turnover. Fixed asset turnover indicates the rate at which a company purchases new assets and disposes old assets out of the business. In this case, Hyatt has increased its fixed asset turnover from 1.0 in 2009 to 1.1 in 2010 (Daily Finance, 2011).
The management of Hyatt should improve the process of collecting and paying its supplies. There is need to improve the efficiency of the entire system because there are delays in the process of collecting and paying for supplies. Other companies in the market have better systems compared to Hyatt, and there is a need for the management to improve its supply management strategies to ensure a competitive level is achieved. The management should improve its communication with suppliers so that timely delivery is made accordingly. The internal processes should be improved so that the company can avoid delays in paying bills to suppliers.
The efficiency of managing assets at Hyatt should be improved. The company should plan on purchasing new assets to facilitate the production process. On the other hand, old and outdated assets should be disposed of to improve the innovativeness of the company. The company should have a program of improving its assets to ensure that employees use modern assets which match the current needs of the customers. The management should accelerate the sales programs to ensure that all the inventories purchased are sold as fast as possible. This will help increase the inventory turnover rate, and eventually the profits of the company will increase. Comparison of the efficiency of other firms in the industry should be done to ensure that the management identifies the competitive strategies being used by other companies. This will help develop better strategies of improving the performance of the company, and to improve its competitiveness in the industry.
Profitability
Profitability ratio shows the profits made by a company in a given period of time. Profits are made when the sales revenues exceed the expenditure in a given period of time. Hyatt generated more gross margin profit in 2009 ($21.15) than in 2011 ($19.70B). However, Starwood recorded higher gross profit margin in 2010 ($21.70B) compared to Hyatt. Marriott had the least gross profit margins in 2010 ($11.60B). On the other hand, Hyatt had a higher operating profit margin in 2009 ($16.00B) compared to the financial year 2010 ($12.00B). However, none of the competitors had a higher operating profit margin than Hyatt. Starwood had an operating profit margin of $11.83b while Marriott had an operating profit margin of $6.04b in 2010 (Daily Finance, 2011).
The same pattern is observed for net profit margin. Hyatt had a lower net profit margin in 2009 ($1.45b), compared to the year 2010 ($0.02b). Hyatt had a high net profit margin compared to Marriott and Starwood. Marriot had net profit margin of $0.02b while Starwood had net profit margin of $0.10b in the fiscal year 2010. Return on shares declined in 2010 from 7.00 to 6.23 in 2010. However, in 2010 Marriott recorded better results for return on total assets (8.70) compared to Hyatt. Earnings per share increased from 0.22 in 2009 to 0.33 in 2010 for Hyatt. On the other side, the Marriott had better earnings per share (0.61) in 2010 compared to Hyatt. Starwood also had better earnings per share (0.39) in 2010 compared to Hyatt. Hyatt also improved its price/earnings ratio from 7.25 in 2009 to 10.40 in 2010. However, the company performed poorly compared to other competitors in the market. Marriott had 15.70 price/earnings ratio while Starwood had 14.55 (Money Central, 2011).
The management of Hyatt should be concerned about the decline in operating profit margin. Better strategies of reducing costs should be introduced to ensure that the company operates at a lower cost level. The sales should be improved to obtain more sales revenues for the company. The company should improve on the ratio of earnings per share provided to shareholders. This will help attract more investors to the company.
References
Daily Finance, 2011, Starwood Hotels & Resorts Worldwide Inc. (HOT). Web.
Daily Finance, 2011, Marriott International, Inc. Web.
Money Central 2011, Hyatt Hotels Corp. Web.
Warren, CS, Reeve, JM & Duchac, J 2011, Financial and Managerial Accounting, Cengage Learning, Ohio.