Introduction
The present paper is an analysis of the financial statement of Wendy’s and Domino’s. The paper is divided into three broad sections – comparison of the company’s financials, ratio analysis and cash flow analysis. The research is based on the data derived from the annual reports of Wendy’s and Domino’s available free on their websites. The last section shows that accounting standard used by the companies and the possible alternatives.
Financial Statement – Wendy’s
According to the 2013 Annual Report of Wendy’s the reporting system adopted by Wendy’s was to report its revenues geographically to the company’s shareholders (71). The franchising and other operations that Wendy’s does within North America are reported under one segment. However, the operations of Wendy’s, outside North America, are not accounted for in this report (Wendy’s 2013 Annual Report 71).
This section will conduct an analysis of the financial statement of Wendy’s. The balance sheet and the income statement will be covered in this section (see table 1 in Appendix). The income statement for the company has been consolidated from 2009 through 2013 in order to present a thorough understanding of the company’s operations. The sales and revenue of Wendy’s has declined considerably from $3.58 billion in 2009 to $2.48 billion in 2013 (see Appendix, table 1).
This resulted in a 30% decline in the revenue from 2009 to 2013; from 2012, the revenue had declined marginally by 0.79%. The fall in the revenue in 2013 is primarily due to the closure of company owned restaurants of Wendy’s. Further, the Annual Report points out that under the system of optimization initiative, the company sold many of their ownership restaurants to franchisees or closed them. This was a part of the brand transformation process the company adopted in July 2013 (Wendy’s Annual Report 10).
The company plans to sell in total of 425 company-owned restaurants to franchisees by 2014 in order to consolidate their business regionally and through divisional territories (Wendy’s Annual Report 10). However, the revenue earned from franchise restaurants increased by 1.8% in 2013 due to rise in the number of franchise restaurants (Wendy’s Annual Report 38).
The cost of sales decreased in 2013 as the percentage of sales declined from 80.9% in 2012 to 79.5% in 2013. This was due to the (1) increase in prices of Wendy’s products, (2) change in the composition of sales, (3) decline in advertising expenses, and (4) lucrative beverage contracts (Wendy’s Annual Report 39).
Depreciation and amortization had increased in both 2012 and 2013 due to the Image Activation Program adopted by Wendy’s. This resulted in an increase in depreciation to $17.5 million and amortization of $20.7 million in 2013. Further, the depreciation and amortization of new restaurants opened were added, which amounts to $6.4 million (Wendy’s Annual Report 40).
Wendy’s faced a decrease in investment income due to the sale of their investment in Jurlique that resulted in a loss of $2.9 million (Wendy’s Annual Report 42). However, the loss was partially offset by the dividend gained from the investment in Arby’s in 2013 (Wendy’s Annual Report 42).
The tax paid by Wendy’s varied due to the changes in the revenue earned by the company. The income tax of the company from 2011 through 2013 was affected due to the variation in income due to the company’s adoption of system optimization and decrease in the valuation allowances in 2013. A few other corrections made by the company in deferred taxes in 2012 and reversal of $1.8 million deferred tax liability also resulted in the variation of income tax (Wendy’s Annual Report 43).
The net income or loss from discontinued operations showed an overall loss of $9.3 million (Wendy’s Annual Report 43). The net loss attributable to the non-controlling interests was $0.9 million for 2013 (Wendy’s Annual Report 43).
Financial Statement Domino’s
Domino’s has shown a strong financial performance. The company’s sales grew continuously since 2009. In 2012 the sales growth was 1.82%, which increased to 7.14% in 2013. The increase in sales was due to the increase in growth of orders sales in domestic market. The cost of sales figure presented in the income statement were mainly the company owned stores and the supply chain that is required to generate the revenue.
The cost of sales of the company (consolidated) as a percentage of decreased in 2013 by 0.86% but increased in 2014 by 6.96%. The cost of sales as a percentage of sales showed an increase in 2013 and 2014 by 68.45% and 68.33% respectively. As there was an increase in food cost by 0.5% by 2013, which led to the increase in the cost of sales.
The interest expense decreased from $12.6 million to $88.9 million in 2013. The income tax increased by $13.3 million to $82.1 million in 2013. The outstanding debt balance resulted from an increase in the principal payments made on its fixed rates in 2013.
Comparison between the two
A comparison of the financials of the two companies show that the sales revenue of Wendy’s had gone down by -0.8% while that of Domino’s had increased by 7.14% in 2013 (see Appendix, table 3). The cost of goods sold also had increased for Domino’s but that of Wendy’s had declined by -2.67%. The depreciation for both he companies had gone down. However, amortization of intangibles growth had gone up considerably (216.17%) for Domino’s while that of Wendy’s had increased by just 79.33%.
Wendy’s income taxes had gone down by -167.13% while that of Domino’s had increased by 19.35%. This was probably due to the fall in the revenue of Wendy’s in 2013. However, the consolidated net income of Wendy’s grew considerably, by 464%, while that of Domino’s increased by only 27%.
Trend in 3 Years
The trend line demonstrates that the sales and revenue for Wendy’s is expected to fall in the next three years. The trend line was developed using the sales/revenue data posted by the company from 2009 through 2013. The cost of goods sold (COGS) is also expected to fall in the next 3 years this indicates a shrinking of their business. The reason may be in their initiative to optimize their operations, which reduces their scale of operations in order to optimize their profit.
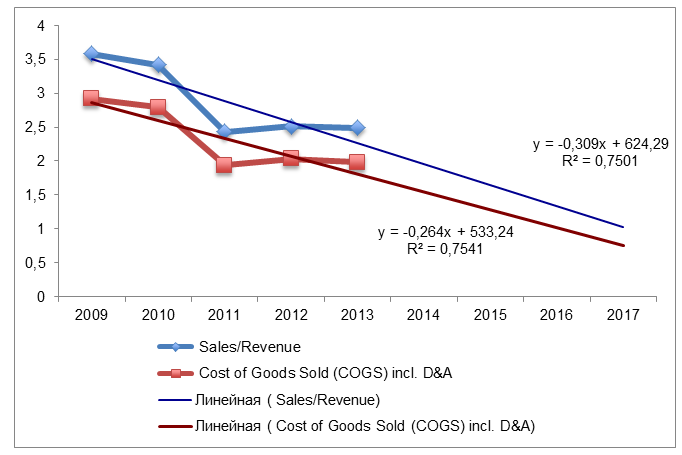
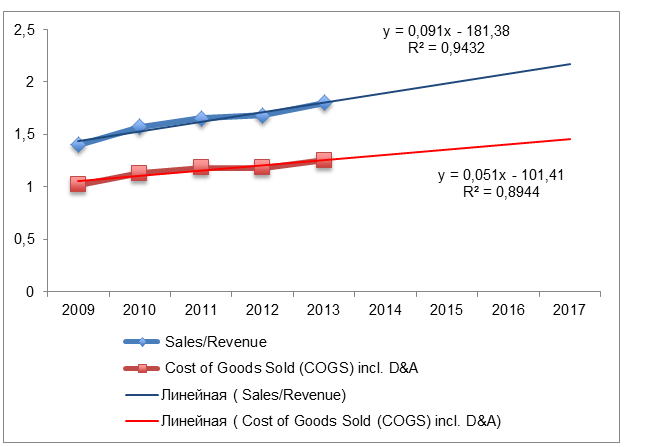
Figure 2 demonstrates that the sales/revenue of Domino’s is expected to rise in the next three years based on the sales/revenue earned by the company since 2009. The COGS of the company is also expected to rise indicating a rise in the scale of operations of the company.
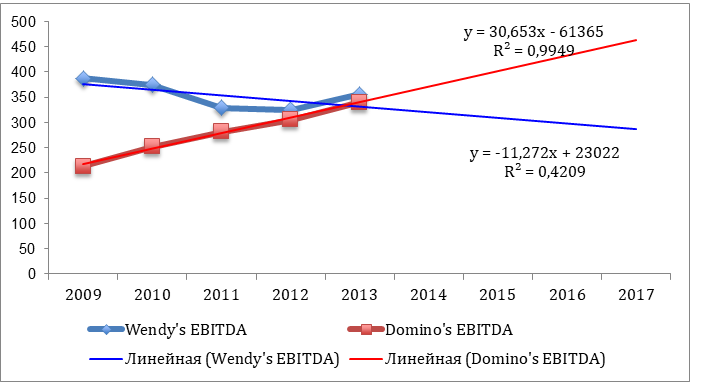
The EBITDA of Wendy’s is expected to decline over the next three years but that of Domino’s EBITDA was expected to increase the next three years. The increase in the EBITDA of Domino’s demonstrate that the company would be more inclined to increase than that of Wendy’s. For Wendy’s the expected growth in sales revenue for the next 3 years is 0.003% and that of Domino’s is 0.24%. The growth in the EBITDA from 2014 to 2017 is expected to grow at an average growth rate of -0.45% for Wendy’s and 0.22% for Domino’s.
Cash Flow of Wendy’s and Domino’s
The cash flow of the two companies is compared in this section. Domino’s has experienced a strong cash flow, which the company believes is due to their strong franchise system. However, Domino’s acknowledges that their increasing indebtedness can curtail their cash flow for other purposes. As the company has a large debt of $1.54 billion in 2013, a large amount of their cash flow has been used to make principal interest payments (Domino’s Annual Report 33).
The company showed a negative working capital in end of 2013, and restricted cash and cash equivalents of $125.5 million and $14.4 million respectively. The factors that the company identifies as the possible causes that may reduce their working capital are payment of their debts, ongoing operations, and investment in their businesses (Domino’s Annual Report 42).
On the other hand, the operations of Wendy’s do not enjoy the stability of cash flow as that of Domino’s. The cash flow for Wendy’s increased in 2013 primarily because an increase of $55 million from accrued expenses and a favorable impact of $8.9 million from account payable. The total cash flow in 2013 was of $139.4 million but the net cash used up was $112.7 million and $98 million was used for financial other activities (Wendy’s Annual Report 54). The company believes that they have enough cash to meet up their business requirements for the next 12 months (Wendy’s Annual Report 47).
The cash flow ratios of Domino’s show that the operating cash flow growth percentage year-on-year was 10.02 in 2013 while that of Wendy’s were 73.2. This shows that the operating performance of Wendy’s was better in 2013 than Domino’s.
Ratio Analysis of Wendy’s and Domino’s
The ratio analysis of the two companies show that the sales growth of the two companies demonstrate that the sales growth of Wendy’s fell by -0.73% in 2013 while that of Domino’s increased by 7.37%. EBITDA margin for Domino’s in 2013 was 18.86% and that of Wendy’s 14.29%. In terms of cash flow, Domino’s net income was supposed to grow by 371.45% for Wendy’s and Domino’s by 27.22% in 2013.
The operating cash flow of Domino’s was expected to increase by 10.02% and that of Wendy’s by 73.23% in 2013. The accounts receivable turnover in 2013 for Domino’s 16.75% and that of Wendy’s was 39.5%. This indicates that Domino’s was expected to receive a stable cash flow while that of Wendy’s was much higher.
The profitability ratios that can be assed to understand the financial state of Wendy’s and Domino’s are assed in this paragraph. The operating margin for 2013 for Domino’s is 17.41% while that of 5.43%. This shows the profit ratio of company. This ratio indicates that Domino’s operating margin is better than Wendy’s. The gross margin of Wendy’s 26.04% while that of Domino’s is 30.46%. This shows that the profitability of the Domino’s is better than Wendy’s.
The cash conversion cycle of Wendy’s is -4.71 and that of Domino’s are 5.76 as was found in 2013. The financial health of the companies is measured using the current ratio and quick ratio. This paper uses current ratio to estimate the financial health of the company. The current ratio of Domino’s in 2103 was 1.38 while that of Wendy’s 2.64.
The ratio analysis of Domino’s and Wendy’s show that the performance of Domino’s was much better in 2012-13 financial performance and operational performance than Wendy’s. Profitability for Domino’s was better than Wendy’s in 2013.
The growth ration over the next 3 years show that revenue is expected to grow for Wendy’s by -10.04% while that of Domino’s 4.69% in 2013. This shows that in next three years Domino’s is expected to perform better in terms of revenue. However over the next ten year revenue for Wendy’s is expected to grow by 23.82% while that of Domino’s by 3%. This shows that the long term performance of Wendy’s will be better than Domino’s.
Reporting Approach to the Shareholders
The reporting approach undertaken by Domino’s and Wendy’s is the usual accounting principle prevalent in the US. Both the companies adopt the Generally Accepted Accounting Principles (GAAP) to report their financials to their shareholders (Wendy’s 2013 Annual Report 3; Domino’s 2013 Annual Report 6). The GAAP is a generally used accounting standard according to Securities and Exchange Commission (SEC) in the US. The SEC postulates that the firms must recognize the revenues that have been earned within a financial year to the shareholders, in order to have a transparent financial reporting schema.
Thus, following the standards stipulated by US-GAAP system, Wendy’s and Domino’s published a consolidated financial statement including all the correct estimates and assumptions that are required to report the liabilities and disclosure of the contingent assets and liabilities. The companies reported the revenue earned and expenses made in the financial report during the financial period.
Other Accounting Policies
A few other accounting policies that Domino’s and Wendy’s could have adopted are the International Accounting Standard (IAS) and International Financial Reporting Standard (IFRS), which stipulate financial statement recognition, revenue and expense recognition, and asset and liability recognition. GAAP is used as the accounting standard in case of Wendy’s and Domino’s. The difference between IFRS and GAAP is that the latter is a rule based standard while the former is a concept based standard.
The intangible assets under GAAP are assessed in fair value while that in IFRS is measured in future economic benefit. In terms of inventory measurement, the last in first out measurement is permissible in IFRS while the first in first out standard is used in GAAP standard (Greuning and Koen 31). The financial standard that Wendy’s and Domino’s may follow is IFRS, which would allow the companies to follow the concepts of finance more than the rules of accounting.
Conclusion
The financial analysis of Wendy’s and Domino’s shows that when the performance of the companies were compared in the short run, the performance of Domino’s was better than Wendy’s. The profitability ratio and the growth ratio shows that in the short run Domino’s will be doing better than Wendy’s. However, in the long run, the growth ratio shows that the in the long run Wendy’s performance will be better. Both the companies used US GAAP as their accounting standard.
Both the companies have treated their intangible assets as fair value. The cash flow ratio of Domino’s show that the operating cash flow growth percentage year-on-year was 10.02 in 2013 while that of Wendy’s was 73.2. This shows that the operating performance of Wendy’s was better in 2013 than Domino’s.
Thus, the research demonstrates that Wendy’s working capital is stronger than Domino’s. The performance of Wendy’s will be better due to their ongoing effort to optimize their operations while that of Domino’s is better in the shorter run. The financial analysis of the two companies present a well round view of the fast food restaurant industry and the financial situation of the two companies.
Works Cited
“Domino’s Annual Report.” 2013. Domino’s Pizza, Inc. Web.
Greuning, Hennie van and Marius Koen. International Accounting Standards: A Practical Guide. Washington DC: The World Bank Publication, 2001. Print.
“Wendy’s Annual Report.” 2013. The Wendy’s Company. Web.