Abstract
Using the current population report on consumer income issued in September 2009, we investigate the current income distribution situation in the United States of America (1967-2007 through 2008). We find that there was a reported decline in household median income although the income inequality remained static in 2007 and 2008. The US census bureau applies the ratio of income percentiles and Gini index among others to measure income inequality. Prior studies and data have shown that the trend of income inequality in the US has been increasing over time, especially between 1967 and 2008.
Introduction
Income distribution is basically an indicator of how a nation’s wealth is distributed to its population. This has been a great concern to economists. Studies have been conducted it investigates the nature of income distribution in various countries. This has been necessitated by the importance of income distribution in assessing the performance of the whole economy. For many countries, the distribution of income has been unequal. There are various methods applied by economists to measure the income inequality of a country. There is the Gini index, the Theil index, and hoover index among others like household aggregate income share quintiles. The Gini index is mostly used and is based on the Lorenz curve. It ranges between 0 and 1. The higher the Gini index the higher the level of inequality. The income distribution in the United States has been on the upsurge for several years. The poor receive very low income compared to the rich. This has a significant effect on the consumption pattern of individuals. It has also been associated with rising cases of food insecurity.
This paper attempts to investigate the situation of income distribution in the US. We shall focus on income inequality, causes of inequality, and its impact on food security.
Income inequality in the US
According to the US current population report on consumer income, the US income distribution inequality remained constant between the years2007 and 2008 as indicated by the Gini index and quintiles on aggregate income share for households. The lowest quintiles were marked 3.4% and the fourth quintile was marked 23.3%. The highest reached was 50%. The lowest income earned by households was $20,712 indicating a big margin with the highest which was over $100,240. The Gini index also had no significant change and was 0.466 between 2007 and 2008. According to Burkhauser and colleagues (2008), for equal income distribution, the Gini index should be equal to zero. 0.466 is above zero indicating that there is inequality despite the decline from 1.5 between 2006 and 2007.
According to the US census bureau, current population survey (2007), the Gini index has been going up from 1967 to 2008. It was 0.397 in 1967 and has increased to 0.466 in 2009. Although it has been going down slightly in some years, it is by a very slight margin. This shows that the level of income inequality has been increasing since 1967. The gap between the rich and the poor has been increasing. To understand the application of the Gini index, we use the Lorenz curve as shown in fig.1 below.
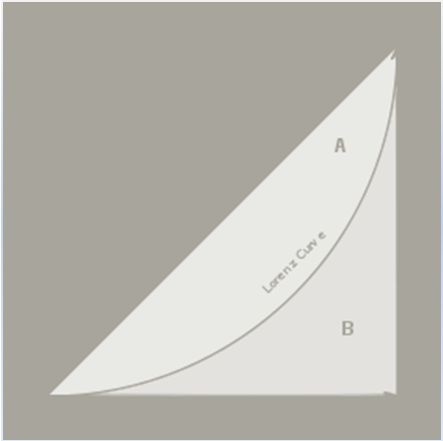
The slanting straight line shows perfect equality which is unrealistic to attain. The area marked A shows the acceptable level of inequality. Area B shows an unacceptable level. To obtain the Gini coefficient, we divide the area between the perfect equality line and the Lorenz curve, area A by the total area A+B. That is, Gini index=A/ (A+B).
A Gini coefficient equal to zero indicates that the income distribution is perfect or is equally distributed. A Gini coefficient equal to one means complete inequality. It should be as low as possible or as close to zero as possible. The trend for US Gini index between 1967 and 2009 that is 0.397 and 0.466 respectively shows inequality. The income distribution was more unequal in 2009 than it was in 1967.
Causes of income inequality
This income inequality is ascribable to some factors. In the 1950s, the growth in income inequality was attributed to two main factors; one is that the most families dealing with farming had their in kind emoluments omitted from the census data. There were also the elderly people who could not be factored in the social security arrangements on allegations that they were not eligible. With time, the in kind earnings of the farm families declined as they were engaged in other activities than earned then money. The elderly incomes also went up as a result of joining the private pension schemes. This only favoured only the high income earners and increased inequality. Generally, income inequality is caused or can be attributed to the following factors.
One of the factors is the family structure that has changed over time. Initially there were very few cases of single parent. With time, the trend has changed; the low earning single parent families have come up and the higher earning two parent families are relatively low. This means that there is a wide income gap between the two families. This will generally reflect income inequality in the economy based on the household aggregate income share index. One part of the top quintile have increased income share and is far much higher than the lower quintile.
The other factor is caused by increased trade as a result of increasing growth in technology. This favours only the educated and the skilled persons. The demand for employment is shifted in favour of the skilled and the educated and to the detriment of the less skilled and educated. This means that the best and well paying jobs are taken by the educated thus causing a big income gap between the two groups. This is the income inequality that will be reflected in the economy. These could be the possible cause of ever growing income inequality in the US. As technology grows, it just favours the educated and the skilled. The less educated takes poorly paying jobs.
There is also growth or expansion of markets. With the increased expansion of trade to the international markets, the talented and educated have the high ability to venture in to the market. The less skilled and the untalented can only operate in the local markets. Those in international markets are able to earn a lot of money compared to the locals. With time this created a very big gap in income between the two groups that has been increasing over time.
Lastly, the immigrants that entered US at around 1980 and later were low skilled and they took low paying jobs. The formed about 11% of the workers. They increased competition low paying jobs thus causing a big income gaps. Their employers reduced the wages due to high demand for those jobs making the gap even wider. Immigration to US has been there till today despite the government’s strict measures. This means more and more low income earners are still going to US. This could explain why the income inequality has been increasing.
According to U.S. Census Bureau (2009), income inequality could also be attributed to the high salary increment of some officials and professionals. Statistics has it that from 1982 through 2004, the chief executive officers salaries compared to that of average employees changed to 301:1 from 42:1 in 1982. The salary for other professionals also increased. This could also have created the income inequality. The average workers earned a relatively low salary compared to the chief executive officers.
The effects of income distribution on food security
According to Stacey & Shahla (2001), a country is said to have food security when the food is available and accessible to by the people. In cases where food is not available or available but not accessible, there is food insecurity. The consumption pattern of individuals depends on their income. The high income earners have high access to quality food than the low income earners. In most of the cases, there is food insecurity in most countries. The biggest challenge facing World Food Programme is to reduce the level food insecurity.
Unequal income distribution greatly affects consumption of food by people. The lowest income quintile consume less compared to high income quintile. Malnutrition is common with the low income earners. Those that attended the 1996 world food summit had the vision of halving the cases of malnutrition by 2015.
Investigations have shown that the nutritional gap is wider to the low income earners. The gap for about 67 countries was found to be twenty five million tonnes nearly 50% bigger than the average national nutritional gap (Stacey & Shahla, 2001, p.54). This was for the low income earners only as of the year 2000. The gap was estimated to hit 30 million tonnes by 2010.
According to Kruger & Fabrizio (2006), the consumption pattern of individuals depends on their purchasing power. Low purchasing power greatly affects the nutritional level of individuals. Low income earners are much vulnerable to malnutrition than the high income earners. For instance, in Latin America, there is a very big gap between the per capita food consumption of the low income earners and the high income earners. This is one of the places with most unequal income distribution. The per capita food consumption gap was 50% higher for the highest income quintile than for the lowest as of the year 2000. In the most populated areas like Asia, the consumption of the low income earners was said to have gone below the standardized minimum nutritional level in 2000.
The most hit part with food insecurity is the sub Saharan Africa. Only about 81% of the nutritional requirements are met by the lowest income earners. The number of hungry people is expected to grow by about 20% in this region. This is because people are poor and have very low incomes. The availability of food is also scarce.
Income distribution affects consumption pattern in all countries. In the United States, the immigrants who are low income earners also have poor consumption pattern. This is because their purchasing power is less. There is also a gap in per capita food consumption between the low income earners and the high income earners (Kruger & Fabrizio, 2006, p.34).
It is important to note that the unequal income distribution only causes food insecurity when the low income earners cannot access the food they require. Food is available but it is too expensive for them to meet all the nutritional requirements.
Conclusion
The trend of income inequality in America has been increasing for a long period of time. The number of low income earners is most likely caused by the immigrants. These immigrants move to the US to look for jobs. Since most of them are less educated, they only occupy low paying jobs. Inequality in Income distribution is the main cause of the big gap in per capita food consumption in many countries.
Reference
Burkhauser, V., Shuaizhang, F., Stephen, P. & Jeff, L. (2008). Estimating trends in US. income inequality using the current population survey: the importance of controlling for censoring. US.
Kruger, D. & Fabrizio P. (2006). Does Income Inequality Lead to Consumption Inequality? Review of Economic Studies, 73 (1): 163–193.
Stacey, R. & Shahla, S. (2001). Issues in food security: Effects of Income Distribution on Food Security. US: USDA.
U.S. Census Bureau. (2007). Current Population Survey Annual Social and Economic Supplement Technical Documentation. Washington DC: GPO.
U.S. Census Bureau. (2009). various years. Income, Poverty, and Health Insurance Coverage in the United States: various years. Current Population Reports, Consumer Income, and Washington DC: GPO. 32