The supply chain game provided our team with a wonderful opportunity to analyze markets and make production and distribution decisions based on the analysis. The game offered to manage the supply chain for Jacobs Industries by building new factories and warehouses, adding capacity to the existing factories, changing the batch sizes and the shipping methods. The game started on Day 731 with one factory and one warehouse in Calopeia with a daily capacity of 70. The aim was to maximize the cash generated by the foam technology over the remaining two years of its lifetime.
Initial Decisions
The summary of the five available markets is provided in Table 1 below.
Table 1. Overview of markets
Region Use Demand Trend Avg Demand Avg Order Size
Calopeia Air Conditioners Seasonal-stable 39 8
Sorange Hardwood floors Increasing-linear 10 8
Tyran Appliances Not seasonal-level 19 8
Entworpe Insulation Not seasonal-level 8 250
Fardo Airplanes Not seasonal-level 15 8
Region Use Demand Trend Avg Demand Avg Order Size
Calopeia Air Conditioners Seasonal-stable 39 8
Sorange Hardwood floors Increasing-linear 10 8
Tyran Appliances Not seasonal-level 19 8
Entworpe Insulation Not seasonal-level 8 250
Fardo Airplanes Not seasonal-level 15 8
While there was no opportunity to reject building a factory and a warehouse in Calopeia, there was a possibility to select whether a warehouse and factory should have been built in all other regions. It was first decided to calculate the possible profitability of all the available options by region. The calculations of the profitability are provided in Table 2 below, assuming that the batch size is 200, the price of a drum is $1,400, and the manufacturing time is three days.
Table 2. Cost matrix
Three scenarios, including having neither factory nor warehouse, having only a warehouse, and having both a warehouse and a factory, were considered. The potential profits are summarized in Table 3 below.
Table 3. Potential profits
The decision-making process was made using the breakeven analysis. The analysis made it possible to understand how many units needed to be sold in a region to cover the capital investments of building a factory and a warehouse.
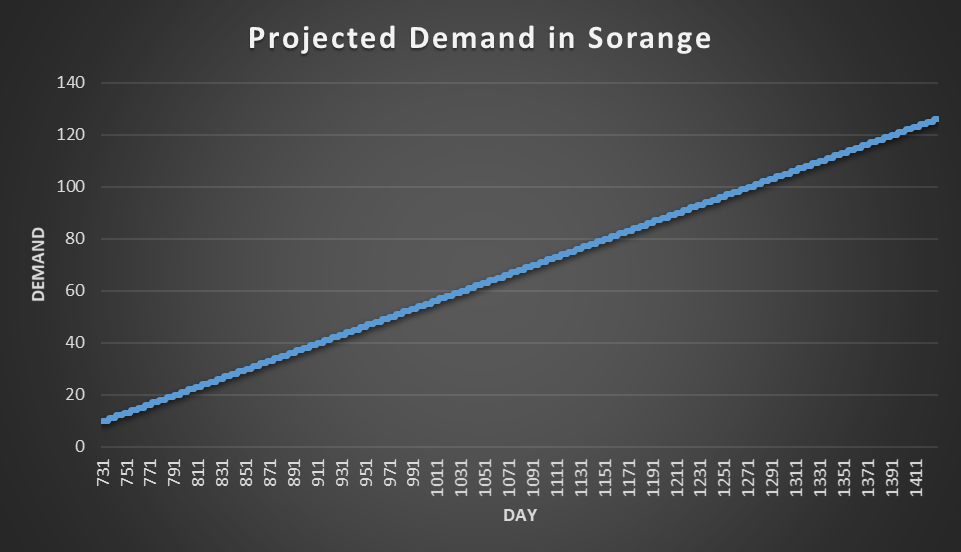
First, the decision was made concerning Sorange. It was estimated that the demand for the product would be increasing by one every six days. Considering that the initial demand on day 731 was 10, the demand by day 1430 would be 126, as seen in Figure 1 below.
It was decided to build the factory and a factory in the region because the total demand between Day 839 (the day the factory would be built) and 1431 would be 45,752. Considering that the benefit per unit was $25 and the cost of the factory was $500,000, the company would need to sell 20,000 units to pay for the factory. Since the total demand was above the 20,000 units mark, a factory was built in Sorange. Assuming that the benefit of building a warehouse was $50 per unit and the cost would be $100,000, the breakeven point for building a factory was calculated. The calculations demonstrated that the company would need to sell 2,000 to start making a profit from building a warehouse. The breakeven points for building the warehouse and the factory were used for all the other mainland regions.
The total demand in Entworpe and Tyran was calculated by multiplying the average demand per day by the number of days operating (630 for the warehouse and 596 for the factory). The analysis demonstrated that the demand in both regions was insufficient to build factories; however, the building of warehouses was found profitable in both regions. As for Fardo, it was decided not to serve the region due to high shipping costs.
All the decisions were implemented on Days 739-743. Since Calopeia had significant inventory, it was decided to supply all the regions from Calopeia and build the factory on Sorange with a capacity of 50 due to the low initial demand in Sorange. The order point in Calopeia was set to 1,500 to optimize the holding costs. Shipping from Calopeia factory to the warehouse was changed to truck due to higher cost-efficiency.
Second-Wave Decisions
After all the factories were built, changes were made in the supply chain. First, due to the quickly depleting inventory in Calopeia, the capacity of the factory was increased to 100 to satisfy the demand in the mainland regions. The order point in Sorange was set to 4,000 due to the quickly growing demand, and the order quantity was selected to be 200. The order point of Calopeia factory to Calopeia warehouse was changed to 5,000 since 1,500 was found to be too low. The order quantity from Calopeia factory to Tyran warehouse was set to 200, and the order point was set to 500 since the demand in the region was medium. Additionally, the order quantity from Calopeia factory to Entworpe warehouse was set at the level of 250 since the maximum order size was 250, and the order point was set to 600 in case two large orders arrived consecutively.
Major Mistakes
The analysis of the game results revealed numerous issues with our supply chain strategy in the game. These issues included a lack of quantitative analysis of batch sizes and order points using appropriate techniques, such as economic order quantity, re-order level calculations, and inventory control level calculations. Implementations of these methods would help to minimize the total ordering and shipping costs. Additionally, we did not start building the factories and the warehouses from the first day of the game. However, there were two major problems that made the results of the game dissatisfactory.
The first major mistake was that we continued serving Fargo despite the net losses associated with serving the region from the warehouse in Calopeia. Even though the initial decision was not to serve the region at all, it was not implemented. However, not serving the region was also economically incorrect. A post-factum breakeven analysis demonstrated that the correct decision was to build a factory and a warehouse in the region. The second major mistake was that we did not make any adjustments in the supply chain after Day 848. The demand in Sorange kept climbing, while Calopeia’s demand was falling between seasons. We needed to make the necessary adjustments to maximize the profits.