Executive Summary
The macroeconomic performance of Australia and the US has been analyzed in this report. The analysis shows that an increase in GDP reduces unemployment rate in both countries. However, a rapid growth in GDP always leads to a high inflation rate. Interest rate affects economic growth by determining access to affordable credit, which businesses require to create new jobs and expand their production capacities.
Net exports also contribute to economic growth, especially, in Australia where commodity exports are a major component of the GDP. Although Australia and the US have been able to maintain stable exchange rates, their net exports have significantly fluctuated. The trade and financial integration between Australia and the US is reflected in the correlation between their macroeconomic indicators. The two countries are likely to experience positive economic growth in future. However, Australia is more likely to experience a rapid growth due to its stable macroeconomic environment.
Introduction
In this paper, the macroeconomic performance of the US and Australia will be analyzed. The US is the largest economy, whereas Australia is the seventeenth largest economy in the world in terms of the purchasing power parity (PPP) adjusted GDP (Richards 2010, pp. 188-203). In the last two decades, Australia and the US experienced both economic booms and recessions.
Economic growth in the two countries was attributed to changes in the macroeconomic environment in the global economy and the economic policies that they implemented. The analysis in this paper will focus on the relationship between GDP and select macroeconomic indicators in Australia and the US. The correlation between macroeconomic variables for the two countries will also be analyzed. Based on the analysis, the macroeconomic outlook for each country will be discussed to determine the economy that is likely to experience a recession or expansion in the near future.
Relationship between Real GDP and other Macroeconomic Indicators
Unemployment
Figure 1A (in the appendix) shows a negative relationship between unemployment rate and real GDP in the US. For instance, unemployment rate rose sharply between 1990 and 1992 when GDP growth was declining. A similar trend can be seen between 2007 and 2009 when unemployment rate increased significantly due to the global financial crisis. Similarly, figure 1B indicates a negative relationship between real GDP and unemployment rate in Australia.
This relationship is explained by the fact that an increase in GDP is characterized by a rise in job creation. Companies have to employ more workers to increase their output, which in turn leads to an increase in GDP growth (Taylor & Weerapana 2011, p. 91). However, during economic decline businesses reduce the size of their workforce to avoid the losses that are attributed to high operating costs. Thus, unemployment rate reduces when real GDP is increasing and vice versa.
Inflation Rate
Figure 2A and 2B show a positive relationship between real GDP and inflation rate in the US and Australia respectively. However, in the US the relationship seems to be negative between 1990 and 1991. One of the factors that explain the negative relationship is the Gulf War. Specifically, the Gulf War increased global oil prices, thereby increasing the cost of production. As a result, the prices of most goods increased, whereas the overall output of the US declined (Nie & Taylor 2013, pp. 31-63).
Conceptually, the positive relationship between GDP and inflation is attributed to the fact that aggregate demand increases during economic boom. However, businesses often find it difficult to respond to the high demand in the short-run due to capacity constraints. Thus, the limited supply of various goods and services has to be rationed through high prices. Conversely, inflation reduces during recession since businesses have excess capacity and aggregate demand is low.
Interest Rates
The relationship between interest rate and real GDP in the US and Australia is illustrated in figure 3A and 3B respectively. The figures do not show a clear positive or negative co-movement between interest rate and real GDP in the two countries. However, they suggest that interest rate has a lagged effect on GDP.
For instance, the reduction in interest rate in the US between 1992 and 1993 is followed by an increase in GDP growth rate from 1993 to 1994. By contrast, the rise in interest rate from 1999 to 2000 is followed by a decline in GDP after 2000. A similar co-movement pattern can be observed in Australia’s data. According to Roberts and Bernanke (2012, pp. 67), a decrease in interest rate causes an increase in GDP growth rate in future as businesses and individuals borrow from banks to finance investments and consumption.
However, interest rate can also have contemporaneous effects on GDP. For instance, Australia’s GDP and interest rate seems to be moving in the same direction from 2005 to 2011. This relationship reflects the government’s use of monetary policy to regulate economic growth. For instance, from 2007 to 2009 interest rate and GDP were declining in the US and Australia. This corresponds to the implementation of expansionary monetary policy in both countries to stimulate economic growth during the global financial crisis.
Exchange Rate
According to figure 4A and 4B, there is no relationship between real GDP and exchange rate in the US and Australia. Both figures show that exchange rate has been very stable in the two countries in the last two decades. Only significant fluctuations in exchange rate have impacts on real GDP (Gupta & Mandal 2008, p. 78). For instance, a depreciation of the US dollar would increase the cost of imports, thereby reducing real GDP through low aggregate demand.
Net Exports
Figure 5A shows significant fluctuations in net exports in the US. A country with positive net exports is expected to experience improved economic growth and vice versa. However, data from the US does not support this perspective. For instance, from 1997 to 2000 GDP growth in the US was above 4% despite a reduction in net exports as shown in table 1. However, in Australia an increase in net exports is associated with improved growth in real GDP, especially, between 1993 and 1997, as well as, from 2006 to 2012 as shown in table 2. This difference is explained in part by the fact that commodity exports account for nearly 22% of Australia’s GDP. However, exports account for only 12% of GDP in the US (McLean 2012, pp. 330-345).
Correlation between Interest Rate and Inflation Rate
Interest rate has a positive correlation with inflation rate. In particular, interest rate is expected to increase as the rate of inflation increases. Figure 6A shows that Australia’s interest rate has a positive relationship with inflation rate. Similarly, figure 6B show a positive relationship between inflation rate and interest rate in the US. A rise in inflation rate usually results into an increase in lending interest rate.
As inflation increases, the value of money decreases (Boyes & Melvin 2012, p. 79). As a result, lending institutions normally incorporate the expected level of inflation in their interest rates to avoid making losses in future. However, lenders have the incentive to reduce their interest rate during low inflation periods. A low inflation rate enables lenders to issue cheap loans profitably to attract more customers.
Interest rate can also affect the level of inflation rate. For instance, the government usually responds to high inflation during economic boom through contractionary monetary policy. This involves reducing the supply of money in the economy by manipulating (increasing) key interest rates such as the federal funds rate in the US and the interbank rate in Australia. As the quantity of money reduces, individuals and businesses are forced to reduce their expenditure (Sikdar 2012, p. 92). The resulting reduction in aggregate demand forces producers to reduce their prices. Thus, inflation rate reduces.
Correlation between Interest Rate and Unemployment
Interest rate has a positive relationship with unemployment rate (Mankiw 2011, p. 82). A low lending interest rate enables businesses to access credit facilities at a low cost. This means that businesses are likely to have adequate financial capital to expand their operations when interest rates are low (Saymeh & Orabi 2013, pp. 341-354).
Business expansion activities such as opening new retail outlets lead to creation of new jobs, thereby reducing unemployment rate. Since interest expense negatively affects profits, businesses have to avoid borrowing when the lending interest rate is high. However, lack of access to credit limits the ability of businesses to expand their operations. Consequently, new jobs can hardly be created in an economy where the lending interest rate is high.
Interest rate has a lagged effect on unemployment (Thangavelu 2012, pp. 247-260). For instance, figure 7A shows that the decrease in Australia’s interest rate between 1990 and 1992 was followed by a reduction in unemployment rate from 1993 to 1995. Similarly, figure 7B shows that the reduction in interest rate in the US from 2007 to 2009 was followed by a steady decline in unemployment rate from 2010 to 2013. The decline suggests that the quantitative easing program that was implemented in the US towards the end of the 2000s was successful in reducing interest rates. The low interest rate enabled the country to get out of the 2008/2009 recession, which in turn led to a reduction in unemployment rate from 9.7% in 2009 to 8.1% in 2012 (Vaughn & Bailey 2013, pp. 1-24).
Correlation between Macroeconomic Indicators in both Countries
The US is one of Australia’s major trading partners. Trade and financial integration between the two countries has been facilitated by the free trade agreement (FTA), which they signed in 2005. In this regard, changes in macroeconomic indicators in the US are likely to affect Australia’s business cycle. Figure 10 shows the relationship between Australia’s GDP and unemployment rate, as well as, inflation rate in the US. The figure shows that Australia’s GDP has a negative relationship with unemployment rate in the US.
An increase in unemployment rate in the US reduces demand for imports from Australia. The resulting reduction in exports reduces Australia’s GDP (Guttmann & Richards 2010, pp. 188-203). By contrast, a decrease in unemployment rate in the US raises the demand for imports from Australia. Thus, Australia’s GDP grows as it increases its output to satisfy the demand for its exports in the US. An increase in inflation rate in the US reduces productivity in Australia due to the high cost of importing machines from the US. Figure 11 shows no clear correlation between Australia’s GDP and interest rate in the US.
Figure 8 shows that the USA’s GDP has no relationship with Australia’s unemployment rate and inflation rate. Since Australia’s economy is significantly smaller than that of the US, changes in its macroeconomic indicators are likely to have little effect on the USA’s business cycle (Nie & Taylor 2013, pp. 31-63). According to figure 9, the USA’s GDP has a negative relationship with Australia’s interest rate. A high lending interest rate reduces expenditure on imports and vice versa. This explains the negative relationship between GDP growth in the US and interest rate in Australia.
Monetary Policy
Monetary policy was tighter in Australia than in the US in the last decade. Figure 12 shows that Australia’s interest rate was significantly higher than that of the US from 2000 to 2013. The monetary policies that were implemented by the two countries in the last decade were mainly informed by the state of their economies. In the US, the dot.com bubble led to economic decline towards the end of 2000. The Federal Reserve Bank responded to the decline by reducing the target federal funds rate. Interest rate remained below 2% up to 2004.
As a result, GDP grew from 0.95% in 2001 to 3.8% in 2004. The low interest rate also resulted into the housing boom that was experienced in mid 2000s. Following the increase in interest rate from 1.35% in 2004 to 5.02% in 2007 to stave off inflation, most citizens found it difficult to service their mortgages (Nie & Taylor 2013, pp. 31-63). This led to the 2007/2008 financial crisis and the 2009 recession. As a result, the Federal Reserve Bank has been forced to maintain interest rate below 1% to stimulate economic growth.
Australia, on the other hand, achieved a remarkable economic growth rate of approximately 3% from 2002 to 2008 (Bennett, Gillespie & Dumsday 2009, pp. 1-20). Although growth in GDP was high, the Reserve Bank of Australia (RBA) was able to maintain inflation within the target of between 2% and 3%. This suggests that the average interest rate of 5.5% that the RBA maintained between 2002 and 2008 was effective in maintaining price stability and enhancing economic growth (Thangavelu 2012, pp. 247-260). Since Australia was able to survive the recent global financial crisis, the RBA had little incentive to reduce interest rate below 1% as was the case in the US. In sum, monetary policy has been tighter in Australia to enable the government to maintain a steady economic growth without increasing inflation.
Economic Outlook
The US
The government of the US is likely to continue pursuing an expansionary monetary policy by maintaining interest rate below 2% to improve economic growth in the next three years. Unemployment rate is expected to remain above 7% in 2014. However, it is expected to decline to 5.5% by 2017 as economic performance improves (Congressional Budget Office 2013, pp. 1-77). Inflation rate is expected to increase slightly from 1.46% in 2013 to 2% in 2015.
GDP is expected to grow by 3.4% in 2014. In the next four years, the economy of the US is expected to expand at an average rate of 3.6%. The factors that will support the rapid growth include the following. First, real estate and stock market recovery will support economic growth. As the effects of the recent financial crisis fade away, real estate and stock prices are likely to rise significantly in the next three years (Congressional Budget Office 2013, pp. 1-77).
Improved prices will lead to increased construction of new houses and investment in the stock market, thereby improving GDP growth. Second, improved availability of credit will support demand for investments and locally produced goods. Third, rapid economic growth in emerging markets in Asia, Africa, and Latin America will increase the demand for exports from the US. The factors that are likely to hinder economic growth include the county’s huge public debt and poor economic growth in Europe, which will negatively affect exports.
Australia
Australia is likely to experience a steady growth in GDP in the next three years. In 2014, the country’s GDP is expected to increase by 2.9%. In the next five years, Australia’s GDP is expected to grow at an average rate of 3% (Reserve Bank of Australia 2014, pp. 1-20). Although interest rate is likely to remain below 3% in the next two years, it is likely to increase to 4.25% by 2018. The factors that will support economic growth include the following.
First, household consumption is expected to rise at an average rate of 2.7% in the next three years due to low inflation rate. In addition, low unemployment rate will improve aggregate demand, thereby increasing economic growth. Second, China is the main export destination of Australia’s commodities such as iron ore. China’s GDP growth rate is likely to remain above 8% in the next three years (Reserve Bank of Australia 2014, pp. 1-20).
The resulting improvement in Australia’s net exports will support GDP growth. Finally, the mining sector is expected to continue growing rapidly due to increased investments and demand for minerals in emerging market economies. However, exchange rate fluctuations are likely to hinder economic growth in Australia in future by reducing its export earnings. Moreover, the tapering program in the US is likely to reduce access to credit in Asian countries, which account for nearly 50% of Australia’s exports. In sum, Australia is more likely to experience an expansion in the medium term than the US because of its stable macroeconomic environment.
Conclusion
The analyses in the foregoing paragraphs indicate that an increase in GDP reduces unemployment rate. However, a rapid increase in GDP is characterized by high inflation rate. Interest rate is an important determinant of economic growth since it determines access to loans that businesses need to expand their operations. Net exports also contribute to economic growth, especially, in Australia where commodity exports are a major component of the GDP. Based on these conclusions, Australia and the US should consider the following recommendations to improve their economic performance.
First, the two countries should focus on boosting GDP growth through production efficiencies and expansionary monetary policies. This will help in reducing unemployment rate. Second, the countries should always take into account the expected inflation rate when reducing interest rate. This strategy will negate the need to implement counter cyclical policies to reduce inflation during economic boom. Counter cyclical policies often reduce inflation at the expense of GDP growth. Finally, Australia should focus on maintaining a stable exchange rate to improve its export earnings.
Appendix
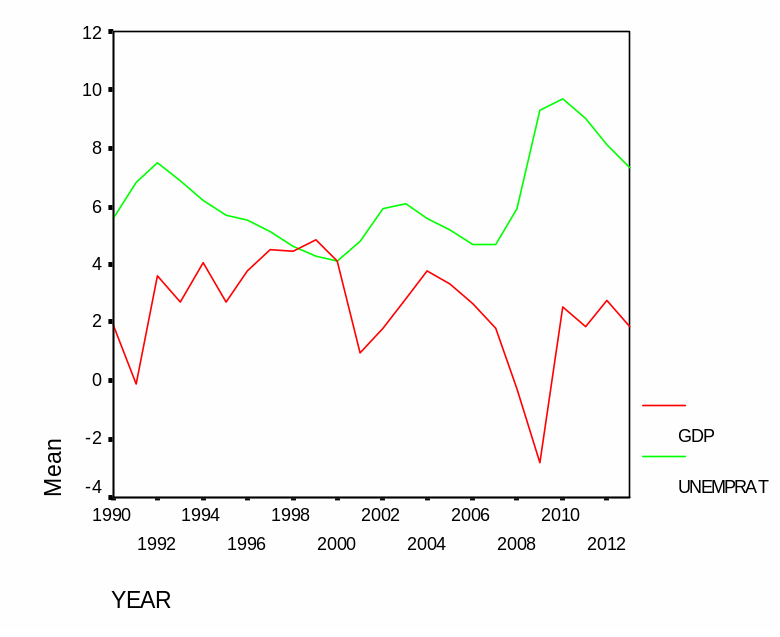
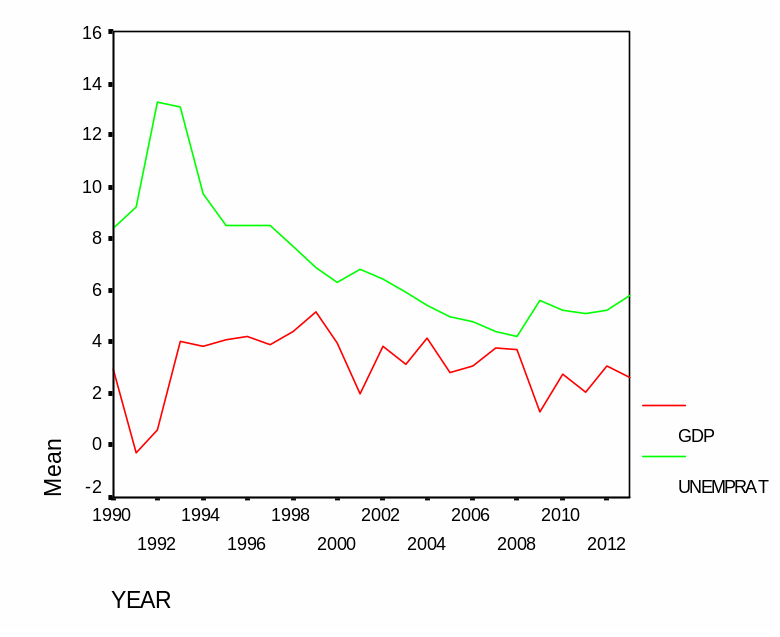
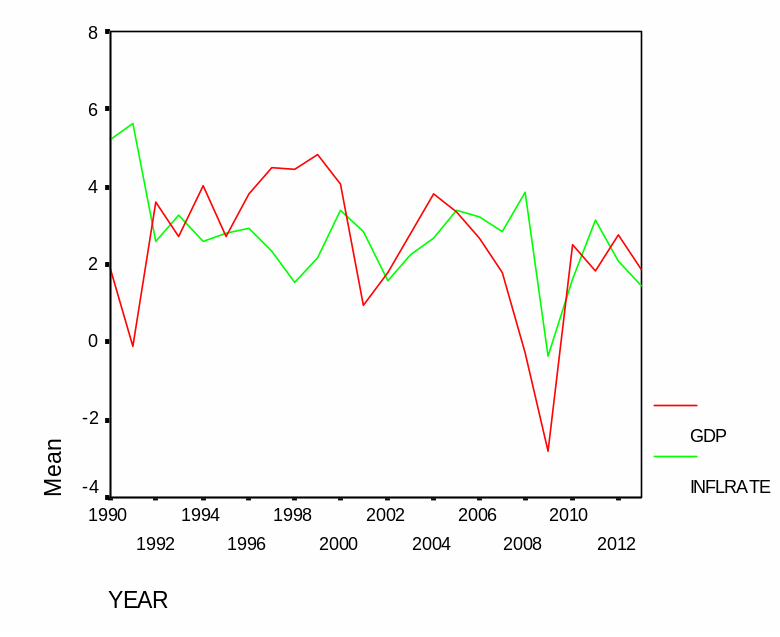
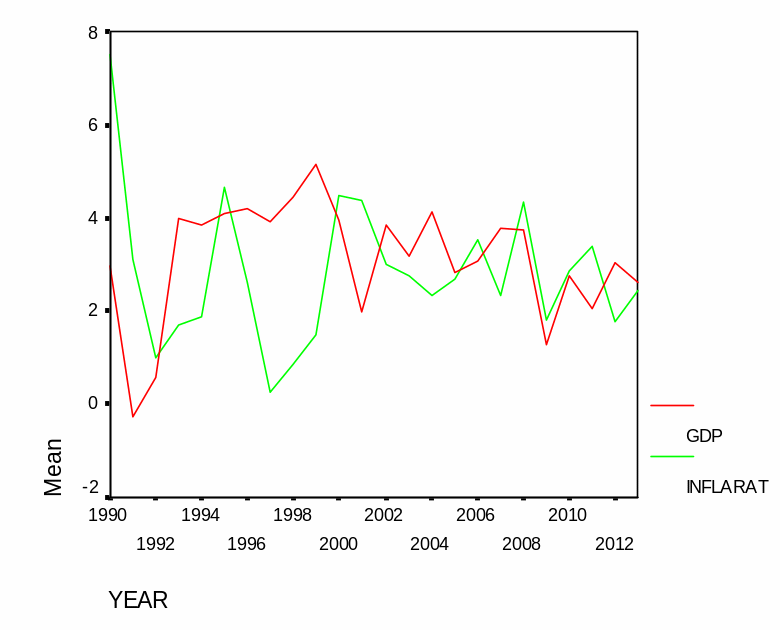
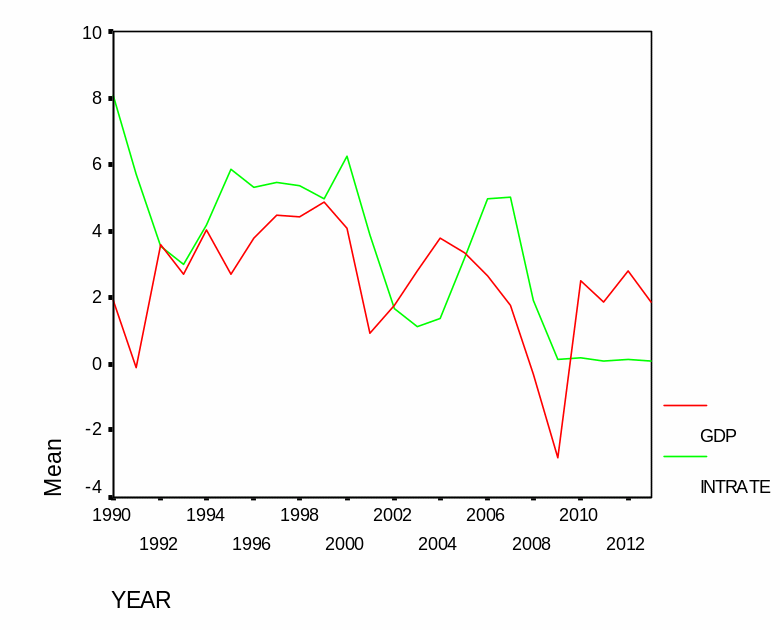
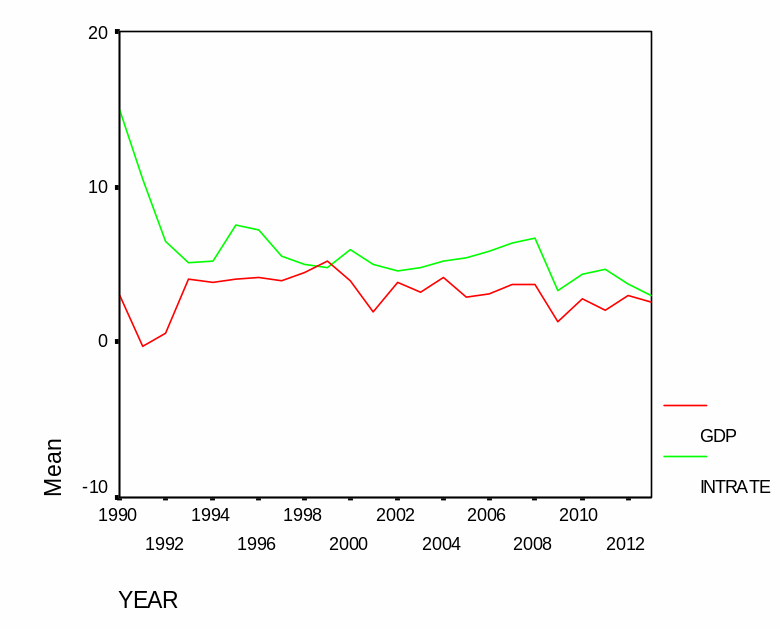
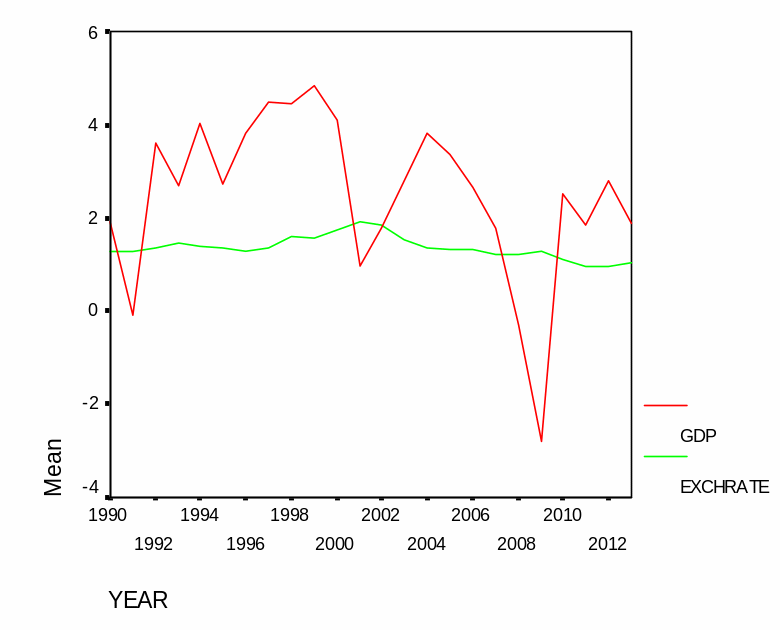
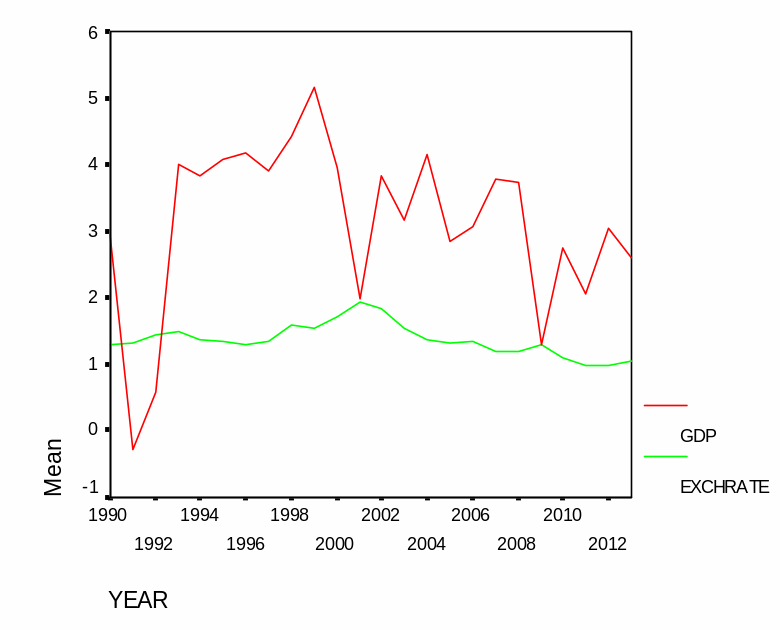
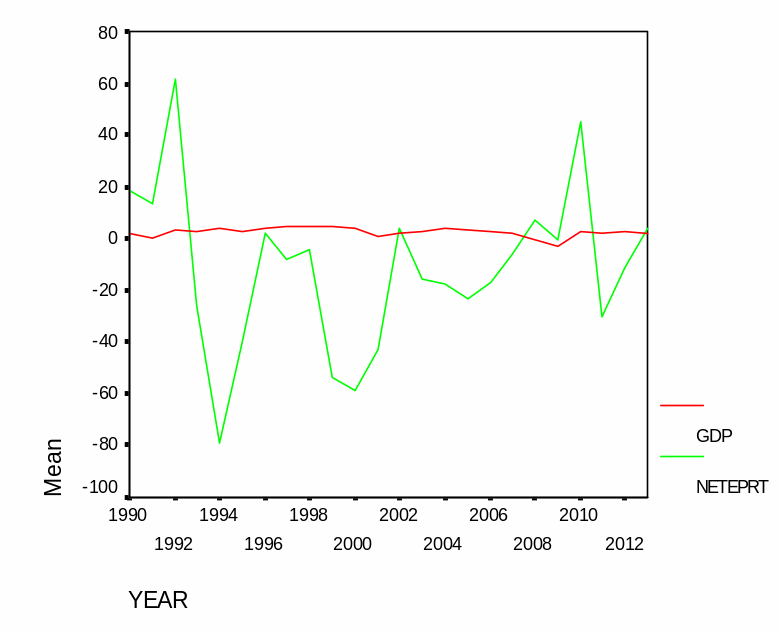
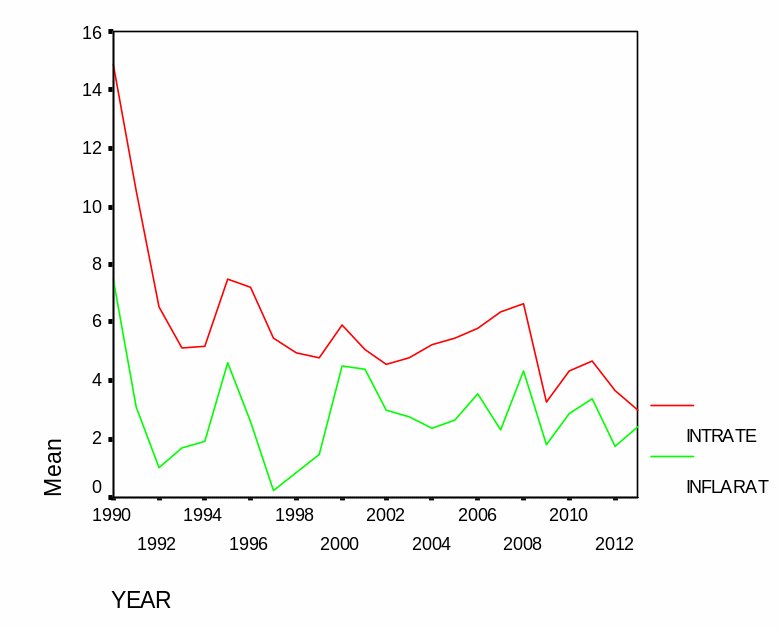
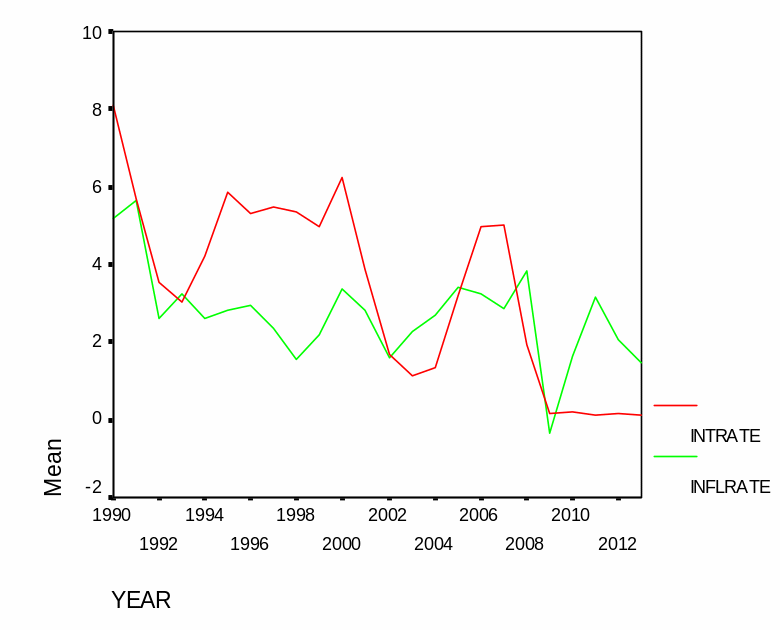
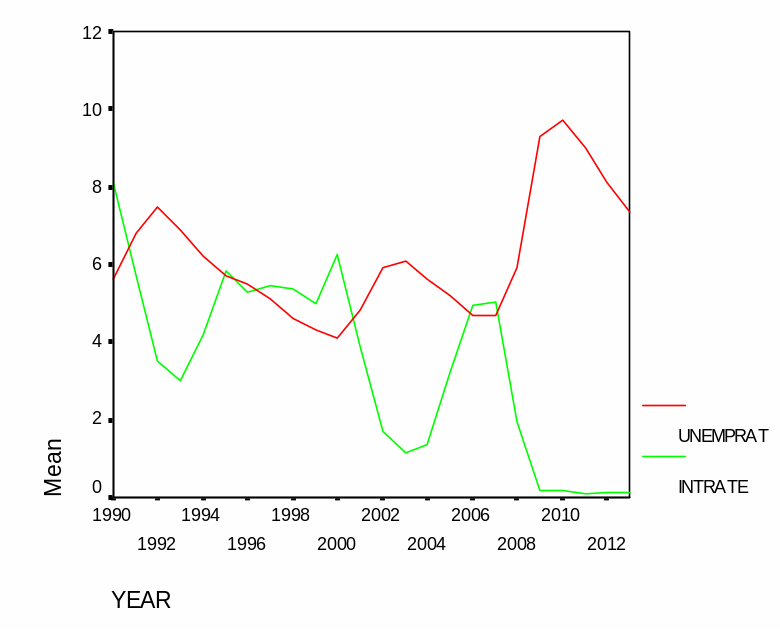
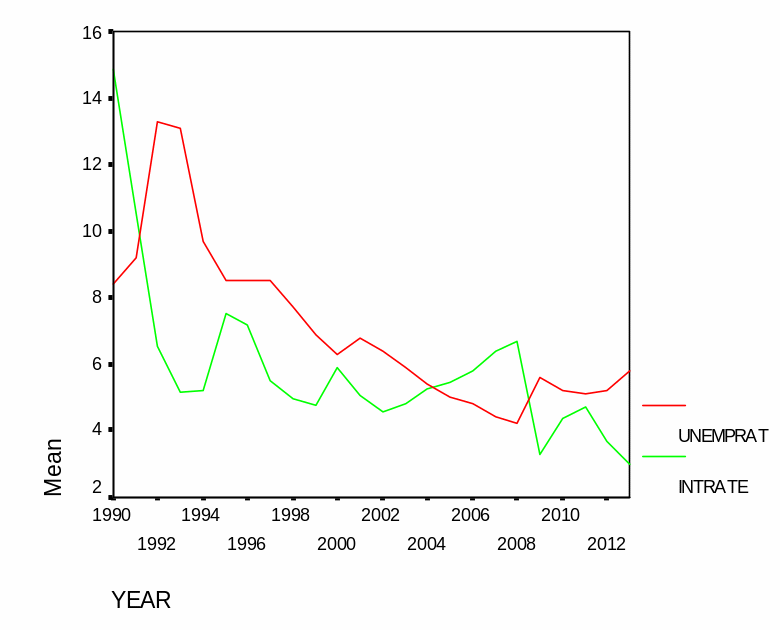
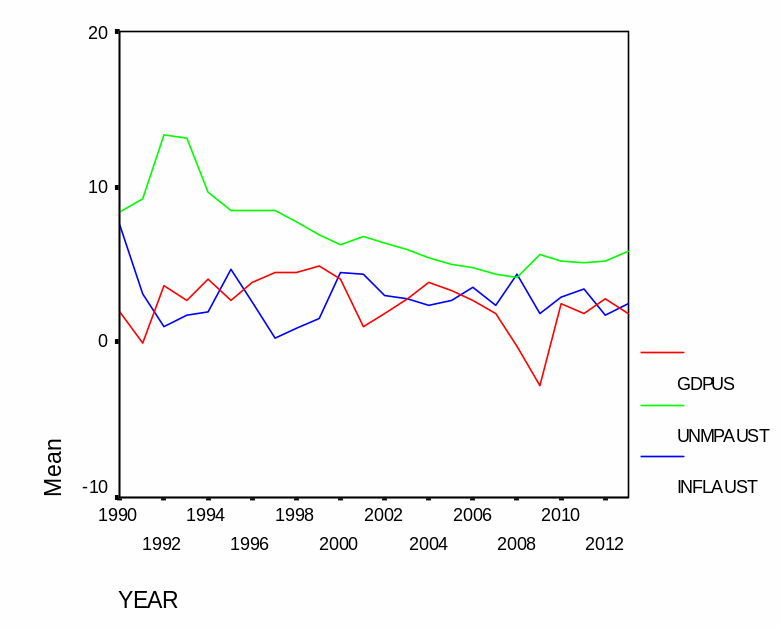
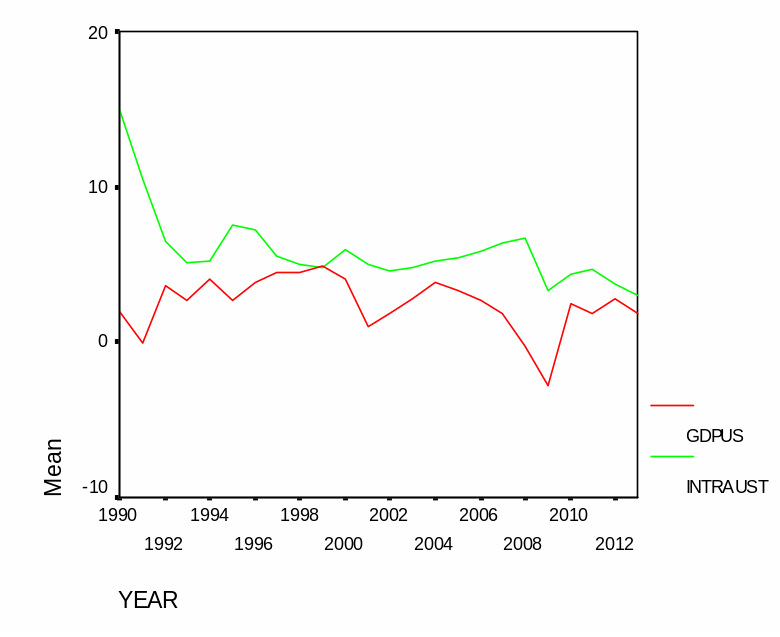
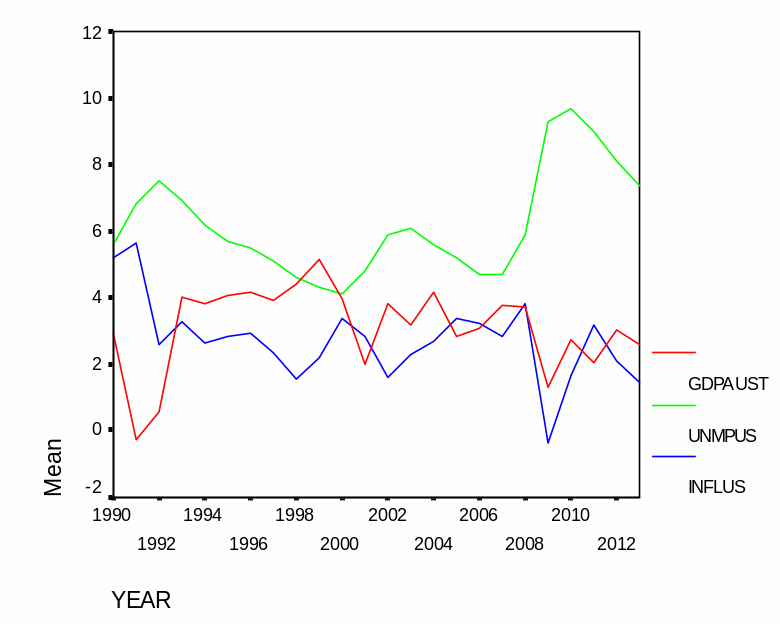
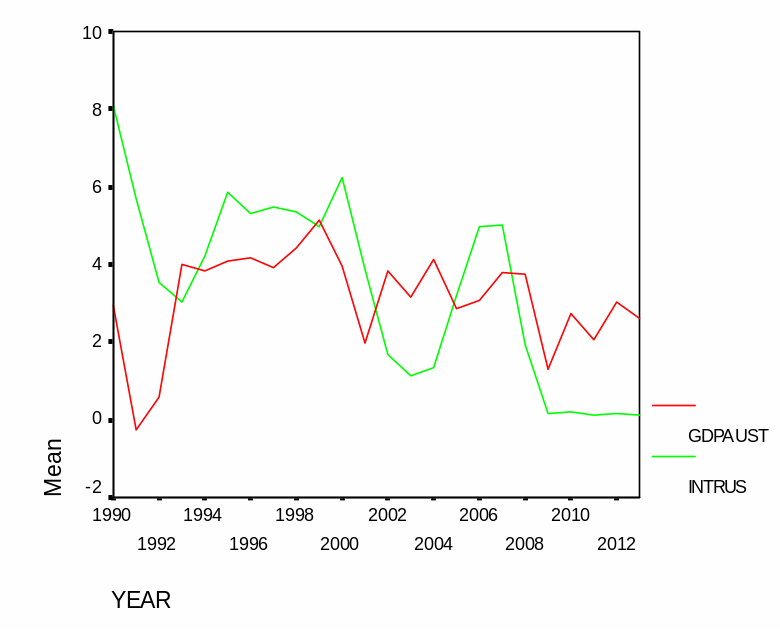
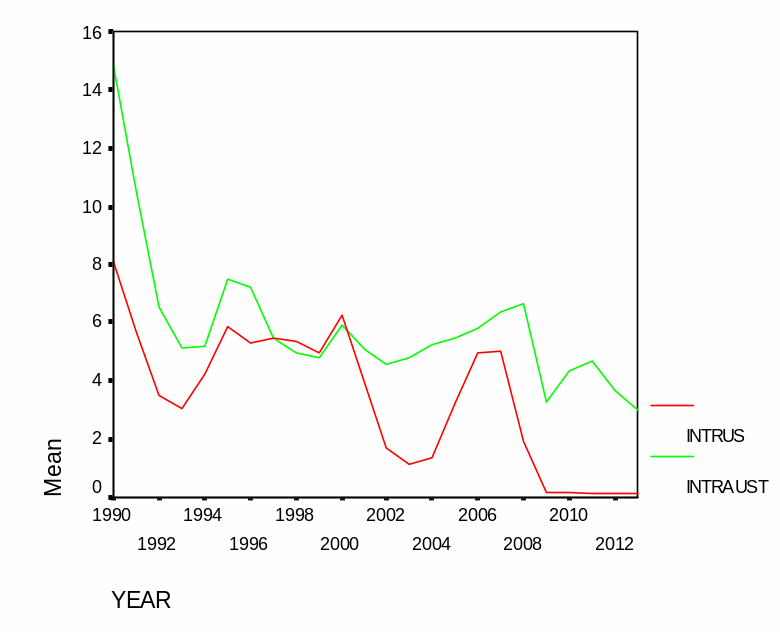
Table 1: Macroeconomic data for the US
Table 2: Macroeconomic data for Australia
References
Bennett, J, Gillespie, R & Dumsday, R 2009, ‘Australian economic development and the environment: conflict or synergy’, Empirical Economics, vol. 5. no. 3, pp. 1-20.
Boyes, W & Melvin, M 2012, Macroeconomics, McGraw-Hill, New York.
Congressional Budget Office 2013, The budget and economic outlook: fiscal years 2013-2023, Washington, DC.
Gupta, K & Mandal, R 2008, Macroeconomics, Oxford University Press, London.
Guttmann, S & Richards, A 2010, ‘Trade openness: an Australian perspective’, Australian Economic Papers, vol. 45. no. 3, pp. 188-203.
Mankiw, N 2011, Principles of Macroeconomics, McGraw-Hill, New York.
McLean, I 2012, ‘Australian economic growth in historical perspective’, Economic Record, vol. 80. no. 250, pp. 330-345.
Nie, J & Taylor, L 2013, ‘Economic growth in foreign regions and US export growth’, Economic Review, vol. 2. no. 1, pp. 31-63.
Reserve Bank of Australia 2014, Economic outlook, RBA, Sydney.
Roberts, F & Bernanke, B 2012, Principles of Macroeconomics, John Wiley and Sons, New York.
Saymeh, A & Orabi, M 2013, ‘The effect of interest rate, inflation rate, and GDP on real economic growth rate in Jordan’, Asian Economic and Financial Review, vol. 3. no. 3, pp. 341-354.
Sikdar, S 2012, Principles of Macroeconomics, Palgrave, London.
Taylor, J & Weerapana, A 2011, Principles of Economics, McGraw-Hill, New York.
Thangavelu, S 2012, ‘Financial development and economic growth in Australia: an empirical analysis’, Empirical Economics, vol. 29. no. 2, pp. 247-260.
Vaughn, E & Bailey 2013, ‘Natural resources endowment and economic growth in the Southeastern United States’, Economic Review, vol. 3. no. 2, pp. 1-24.

