The warning signs that were troubling economists since the beginning of 2008 have been confirmed – the US economy is in recession (Schaefer). The signs of the recession that had been widely debated were increasing unemployment, and declining inflation-adjusted household earning, which eventually led to a decline in consumer demand. But the group of economists and policymakers who were still unwilling to accept the impending recession was due to the acceptable industrial output in two consecutive quarters. But inflation was constantly rising and the growth rate of the economy too was slowing down. The worst hit, due to this recession, is said to be the automobile sector (Chicago Tribune). Especially the US auto giant General Motors (GM) has pleaded for monetary aid from the Federal Government (Reuters). This paper aims to understand how the macroeconomic indicators point to a recessionary phase in the US economy and how this is affecting the auto industry and what consequences will it have on the decision-making of GM.
What is a recession? A country is said to be in recession when its gross domestic product (GDP) sustains a negative growth factor for at least two consecutive quarters. So, if the GDP growth is less than 2 percent then the economy can be said in a recession. In the US, recession is announced and defined by the National Bureau of Economic Research (NBER). According to this definition, the economy is in recession when economic activity declines significantly lasting more than a few months. Due to the vague nature of the definition, a recession, if occurs, cannot be identified till the economy is actually in it for a few months.
Macroeconomic indicators show that the economy is in recession or not. From the above definitions, we will try to see if these definitions are valid. So we will try to analyze the macro data for GDP growth, disposable personal income, inflation, and industrial production and see how they suffice the definition of recession presented above and validate the economic analysis of the current recession.
GDP may be defined as an economic indicator that measures the value of all goods and services produced by the economy within the geographic boundary of the country within a specified period of time, usually a year. The growth in GDP is considered to be a primary indicator of the economic well-being of the country. We compute the GDP growth of the US economy from 2007 through 2008 every quarter. The GDP we consider is chained to 2000 dollars. As figure 1 show that the GDP growth has gone down consecutively for two quarters at the beginning of 2007 when it fell from 1.18 percent from second to third quarter and in the fourth quarter it became negative. But then there was again an increase from the fourth quarter of 2007 to till the second quarter of 2008, but after which it again dipped further to -0.13 percent.
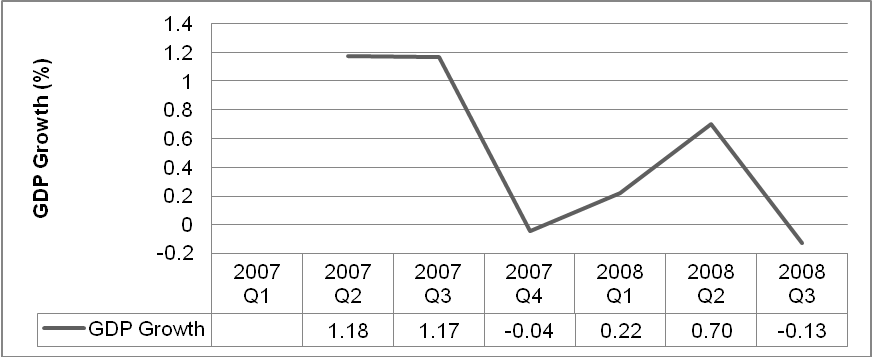
Clearly the data indicate that there has been a decline in the GDP growth in the last quarter. Further, the growth was negative in the last quarter.
Figure 2 shows the disposal income that individuals have in the US since 2007 in each quarter. Disposable income is defined as the income of an individual minus personal taxes. There has been a huge dip in disposable income in the third quarter of 2008. Again in there had been a fall in the disposable income adjusted to 2000 dollars for the two consecutive quarters. Then it fell from 3.1 percent in Q3 2007 to 0.6 in Q4 2007 to -0.7 in Q1 2008. It is interesting to note that the dip in disposable personal income occurs from the same quarter which showed a fall in GDP growth.
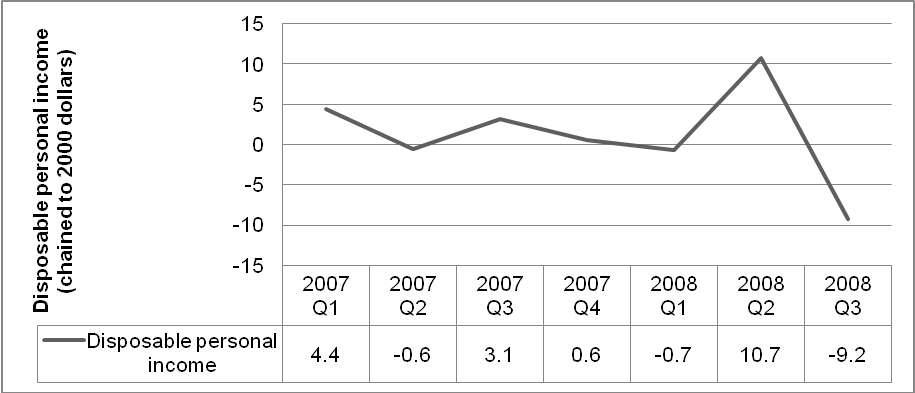
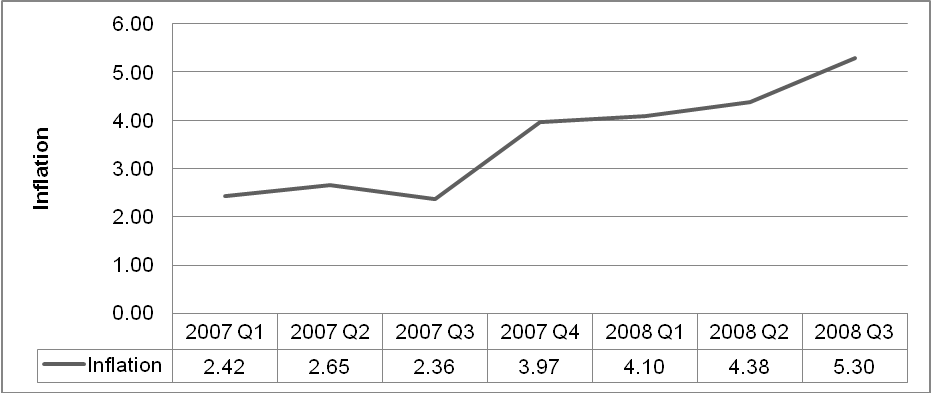
Figure 3 shows the data on inflation. The data shows that inflation has been increasing for the last three quarters of 2008. It has been continuously been increasing from Q3 2007 till Q3 2008. Inflation has reached a two-year high of 5.3 percent in Q3 of 2008. Further, the increase in inflation has seen a continuous increase since Q3 2007.
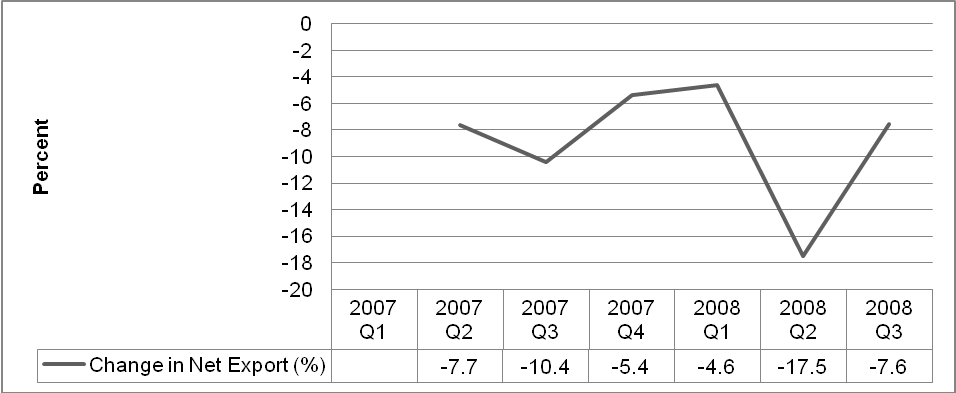
Net export is calculated as an excess of export (adjusted to 2000 dollars) to imports (adjusted to 2000 dollars). Figure 4 shows the percentage change in Net exports every quarter since 2007. This shows that the change in net export has plateaued from Q3 2007 to Q1 2008 before taking a huge slump in Q2 2008 and then again rising in Q3 2008. But in all cases, the figures are negative indicating a trade deficit.
Now we consider the case with unemployment in the US. Figure 5 shows unemployment for every month from January 2007 to October 2008. The figure shows an increasing line which indicates the rate of unemployment has been increasing since September 2007 which coincides with the third quarter of national income accounting.
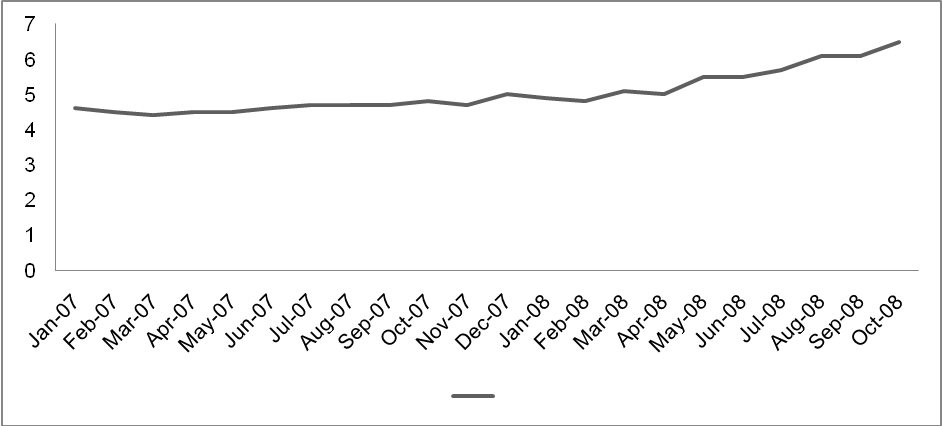
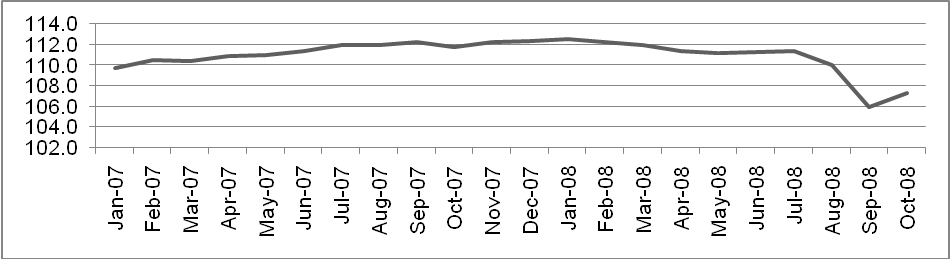
Figure 6 shows industrial output (adjusted at 2000 dollars). The figure shows that industrial output has been plateaued since September 2007, and since March 2008, it has started falling, before increasing slightly in October 2008.
Thus, the analysis of the data collected on major economic indicators shows that the economy has been moving towards a recessionary phase. Further, if we go according to the definition of recession, the US economy has shown all signs of recession from GDP below 2 percent level and negative economic indicators for two consecutive quarters. Even according to the NBER definition, the US economy can be said to be in recession.
Given these figures, we see that as personal disposable income is low, which is indicated by increasing unemployment, the GDP growth is declining too. Another contributing factor in declining GDP growth is non-increasing industrial output. Further, the declining trend in net export shows that the trade deficit is increasing.
If we forecast (using the moving average method) for GDP growth, disposable income, change in net export, economic pressures are falling and inflation for four quarters of 2009, we see that there is expected to be export growth, but all other indicators are showing a gloomy picture.
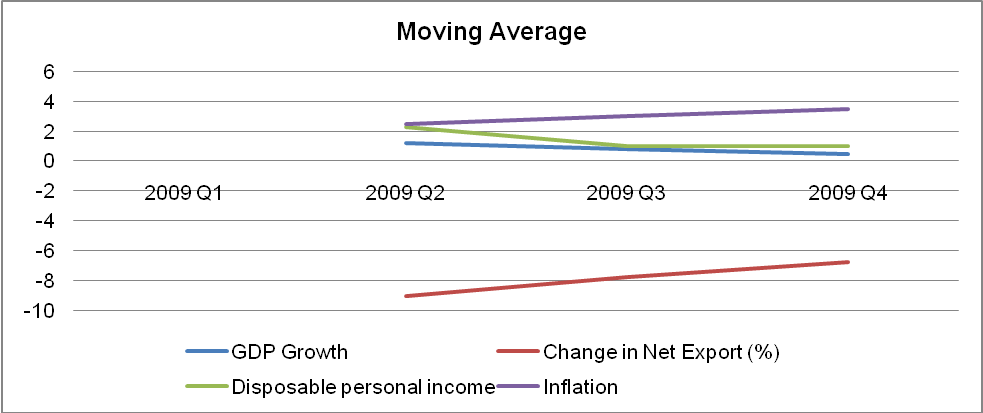
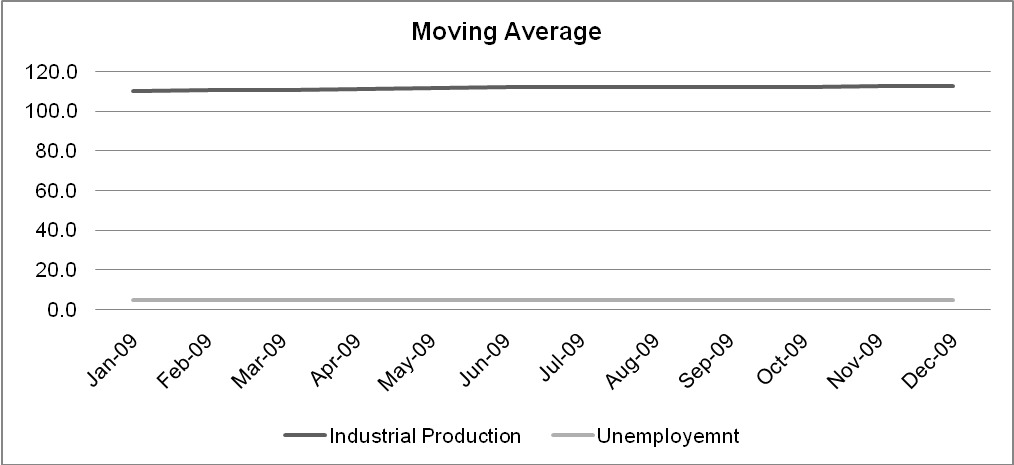
Providing an annual forecast for the Unemployment rate and industrial production for 2009 we see that both these are expected to stay stable throughout 2009. As figure 7 shows that GDP growth is expected to fall in 2009 and so in personal disposable income. Moreover, there is expected to be a rise in inflation.
Now if we consider the case of General Motors, we see that the picture for the company when it comes to economic boosters is bleak. The automobile industry is undergoing a recession as there are economic pressures falling on the industry. With a decline in personal disposable income, consumer demand is declining. So GM is facing a decline in auto demand. Further, with increased inflationary pressure, the prices of oil and autos are expected to rise and the trend is expected to continue, as auto parts too will become costlier. With disposable income expected to decline in 2009, there will be a decline in auto demand. So to increase demand (given expected rise in inflation), production cost has to be reduced to increase profitability. One possible way to reduce production costs is the layoff of employees, which will again increase the unemployment rate.
To summarize, we see that the US economy is facing a recessionary phase because the GDP growth has declined for two quarters consecutively in 2007. There is an increase in unemployment and disposable personal income has declined. This trend is expected to continue in 2009. So the automobile industry which is expected to face the worst blow will have to reduce production costs so that they can increase demand in the market.
References
- BEA. “National Economic Accountrs.” 2008. Bureau of Economic Accounts.
- Bureu of labor Statistics. Databases, Tables & Calculators by Subjec, URL. 2008. Web.
- Chicago Tribune. “GM shifts sales focus to cars Recession, gas prices cited for truck slump.” Chicago Tribune 2008.
- Federal Reserve Statistical Release. Industrial Production and Capacity Utilization. 2008. Web.
- Reuters. “US senators grill auto CEOs, GM-Chrysler deal eyed.” 2008. Web.
- Schaefer, Steve. “America In Recession; Automakers In Focus.” 2008. Forbes.