Introduction
The financial statements and other information available in annual reports for 2008 and 2007 of Wal- Mart Stores Inc. have been analyzed to evaluate its performance for both the years. Basic methodology used is ratio analysis, working capital management evaluation, calculations of weighted average cost of capital to establish required rate of return among other analysis. The required analysis under different sub headings follows here under.
Ratio Analysis
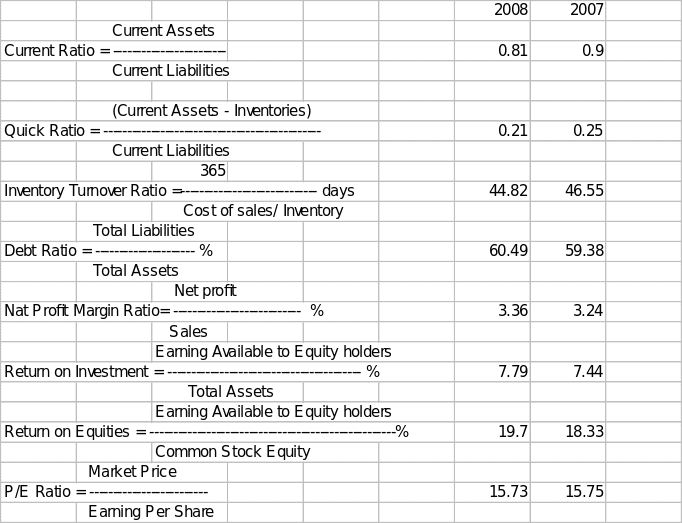
Required ratios are calculated hereunder:

- Current Ratio reflects the liquidity position of the company. It shows the short term solvency of the company. That is to say, whether the company is in a position to meet it short term obligations when those become due. Current ratio of 2:1 is considered optimum for any type of firm. From that point of view Wall- Mart is facing liquidity crunch as its ratio is just 0.81:1 in 2008 and 0.9:1 in 2007. Wall-Mart may be finding it difficult to meet its current obligations when those become due.
- Quick Ratio is similar to current ratio except that in its calculations only those assets are considered that are quickly convertible into cash. That is why inventories are not considered for its calculations. Quick ratio of 1:1 is considered best for all type of firms. The position of Wall- mart is not at all comfortable as its quick ratio is just 0.21 : 1 in 2008 and 0.25 : 1 in 2007.
- Inventory Turnover ratio: this ratio measures the activity of the inventory as to how many times the inventory turned over in a year to meet the cost of good sold for generating total sales. In 2008 the turnover of 8.14 times was better than 7.84 times in 2007. The average age of inventory in 2008 was 44.82 days and that was more efficient than 46.55 days in 2007.
- Debt ratio: Debt ratio expresses the financing pattern of total assets of the firm. That is to say how much debt capital and equity capital is employed to finance the assets of the firm. It is all called the financial leverage of capital gearing of the firm. In 2008 60.49% of the total assets were financed by debt as compared to 59.38% in 2007. The company is high geared as more than 50% of total assets are financed through debt capital. It has got both advantages as well as disadvantages from the point of view of equity holders. During the period of increasing profits the equity holders will benefit as being the residual owner of profits the equity holders will get more after meeting the fixed interest liabilities. It will be reversed during the period of falling profits. This is also called trading in equity.
- Net Profit Margin ratio: This ratio “measures the percentage of each sales dollar remaining after all costs and expenses, including interest, taxes, preferred stock dividend have been deducted.” (Lawrence J Gitman, page 67)1 the higher the ratio the better it is. In 2008 this ratio for Wal-Mart was 3.36% and that was an improvement over 3.24% in 2007. The Wal- Mart has performed very well during both the years considering the industry average of 3.20%. The performance of the company is improving year after year.
- Return on Investment (ROI): Return on investment is another profitability ratio that ‘measures the overall effectiveness of management in generating profits with its available assets.’(Lawrence J Gitman, page 68)2 This ratio is also called Return on Assets (ROI). In 2008 the investments in Wal- Mart generated 7.79 % of profits, 7.79 cents on each dollar of investment. The ratio in 2007 was slightly lower at 7.44%. This indicates that profitability wise the Wal- Mart has progressed in 2008 as compared to 2007.
- Return on Equities (ROE): “Return on Equity provides management and investors with the rate of return earned on invested equity. It differs from Return on Assets (ROA) or ROI in the sense that it measures the return on funds owned by the firm.” (Joanna Ledgerwood, page 223)3 The rate of return on equity invested by Wal- Mart in 2007 was 18.33 and that rose to 19.7% in 2008. Wal- Mart has progressed well in 2008 when considered from the point of industry, as average industry ratio of return on equity is 19.60%. Wal- Mart has better performed than the industry average in the year 2008.
- Price/Earning (P/E ratio): “The most basic and fundamental yardstick for valuing stock is the price earning ratio. The price earning ratio of a stock is simply the ratio of its price to its annual earnings.”(Jeremy J Siegel, page 110)4 P/E ratio indicates how much investors are ready to pay for the face value of share. Like in 2008 P/E ratio of Wal Mart is 15.73; it shows that investors were ready to pay $15.73 for each share of $1 of Wal-Mart. In 2007 the ratio of 15.75 was almost similar to 2008. The industry average P/E ratio is 17.30 and comparing that Wal- Mart is slightly lower than that in 2008. But inter- firm comparison shows a rising trend for Wal- Mart.
Working Capital Management
The objective of Working Capital (or short term financial) management is to manipulate current assets in a fashion to achieve a tradeoff between profitability and risk. Changes in level of fixed assets and current assets affect the profitability.
As increase in fixed assets increases the potential for greater earnings where as a level of current assets are required to maintain the short term solvency of the company in order to meet the current obligations when those become due and achieving a trade off between the two is purpose being strived for by the working capital management. Company’s operating cycle and cash conversion cycle, which is part of operating cycle, play an important role in working capital management. Operating cycle is the tome that starts from beginning of production process and ends with collection of cash from receivable. It is process that is affected by the management of inventory and accounts receivable. Operating cycle is total period of average of inventory (AAI) and average collection period (ACP).
Funding the cash conversion cycle (CCC) is an important aspect of working capital management. The firm may follow an aggressive policy where short term debts are used to finance accounts receivable or a conservative policy where long term as well as short term funds are used. The company must adopt a positive CCC policy that involves use of negotiated liabilities (that is liabilities like bank loans) that carry explicit costs.
This will enable the firm to minimize CCC more easily, as minimizing CCC is main and important factor in working capital management. Minimizing CCC is possible by increasing inventory turn over ratio, shortening average collection period, and paying accounts payable as slowly as possible. For Wal- Mart inventory turn over ratio has improved from 46.55 days in 2007 to 44.82 days in 2008. Average collection period and Average payment period are calculated as under:

Average collection period has rather gone up from 3 days to 4 days. Average payment period is static 39 days for Wal- Mart. It is mixed bag performance so far as working capital management is concerned. Inventory turnover has improved but CCC is affected by increase in average collection period. The CCC has increased but there is little effect of improvement on operating cycle. It can be said that Wal- Mart has to still work more efficiently on working capital management; and this is clearly reflected from its poor current and quick ratios.
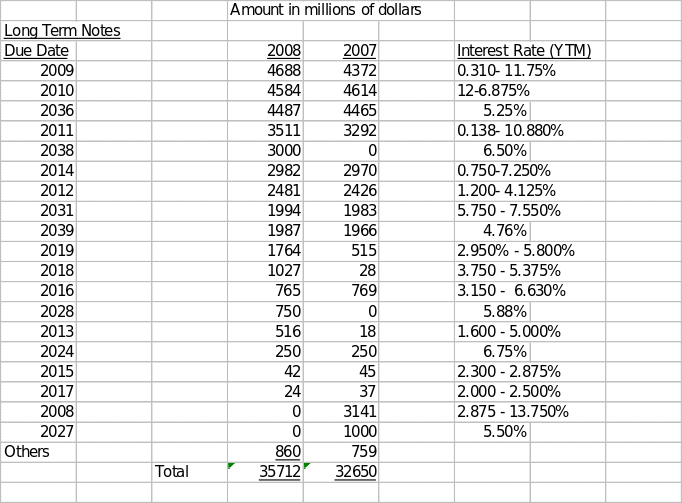
List of Long Term Debts

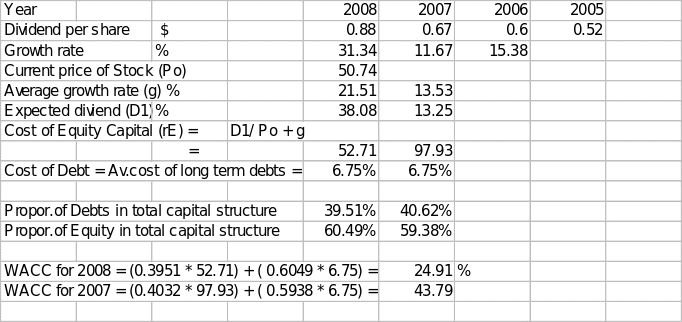
Details of Stocks issued by Wall- Mart Stores Inc.

WACC
WACC= (proportion of equity)(Cost of Equity) +(Proportion of debts)(Cost of debts)
Cost of equity (rE)is the return required by equity holders and is calculated with reference to following formula:
rE = D1 /Po + g, where
D1 =Dividend expected to be paid at the end of year
Po = Current price of stock
g = Expected growth rate
rE = expected rate of return on equity or cost of equity capital
The calculations are as under:

WACC has been calculated using Dividend Model. Hence the required rate of return for Wal- Mart is 24.91%, where as the rate of return for 2008 as per ratios calculated above is 19.7%. For the year 2007 required rate of return is 43.79% and rate of return achieved is only 18.33%.That means Wall- Mart is not covering even its cost of capital on its earning and its performance on this count is less than satisfactory.
Brief analysis of performance
Liquidity position of Wal- Mart is very fragile. The company is finding difficult to meet its short term obligations. There is a danger to its short term solvency. Net profit margins are rising and thus appreciable. Though company is faring better than average industry performance so far as profitability is concerned, yet its performance of overall profitability is not satisfactory. This is as because the company is not even covering its weighted average cost of capital (WACC). Working capital management is not satisfactory. Its cash conversion cycle is rising and thus threatening the liquidity position of the company. The company’s dividend policy is appreciable.
Recommendations
Wal Mart needs to improve its performance basically on two fronts. It has to improve its liquidity and that is possible by improving its inventory turnover and cash conversion cycle. Secondly the company needs to utilize its assets more effectively in order to increase its rate of return, so that at least cost of capital is covered.
References
- Lawrence J Gitman, Principles of Managerial Finance, eleventh edition, Pearson Education, page 67.
- Ibid, page 67.
- Joanna Ledgerwood, Microfinance Handbook, World Bank Publications, 1999, page 223.
- Jeremy J Siegel, Stocks for the long run, McGraw Hill Professional, 2007, page 110.
