Introduction
Seaports are vital maritime transport nodes and critical components of countries’ economic, environmental, and social development. The seaport concept itself has a long history, dating back to the early days of civilization when humans began building large ships and making offshore explorations (Notteboom and Haralambides, 2020). For instance, the ancient port in Byblos, Lebanon, believed to be the oldest in the world, served as an important center for timber shipping in 3000 BC (De Graauw, 2019). Today, countries worldwide have constructed ports of varying complexities and designs in their territorial waters and harbors, including in seas, lakes, and major rivers. These facilities are becoming increasingly important transit and gateway areas, given the rising global trade volume and a need for trade continuity. As such, ports today have become logistical and industrial nodes at the center of complex intertwining global supply chains (Tijan et al, 2012). Regardless of its nature and spatial delimitation, every port aims to achieve seamless and sustainable transportation and information processing.
Without seaports, the world’s economy will grind to a stop. Currently, 80 percent of the earth’s merchandise trade happens by sea. It is a cheaper – though slower – transportation option compared to air transit (Port management series 2020, 2020). Corporations and business individuals worldwide also prefer to use sea transport because it is the least environmentally damaging mode of transporting bulk, including finished goods and raw materials, between countries and continents. However, the effectiveness and reliability of sea transport depend almost entirely on the availability of efficient ports to handle and clear import and export goods with speed (Port management series 2020, 2020). In this regard, a country’s relative capacity to participate in international trade depends directly on its port’s (ports’) efficiency. Ports in developing countries must improve their reliability by expanding and integrating new technologies to fit snugly into the global economy. Developing countries must identify their transport facilitation and trade needs and seek and obtain technical assistance to increase their capacity and sustainably grow their economies.
Global Trade Trends
COVID-19 significantly disrupted global business and affected the movement of goods, people, and services worldwide in 2020. Not surprisingly, the overall value of world trade dropped by 9 percent in 2020, with business in the services sector declining by 16.5 percent and that in goods reducing by 6 percent (Global trade update, 2021). COVID-19’s effect on global trade was severest in 2020’s first half, with a 15 percent drop in value (Global trade update, 2021). Global trade recovery began in the third quarter of 2020 and more strongly towards the end of that year.
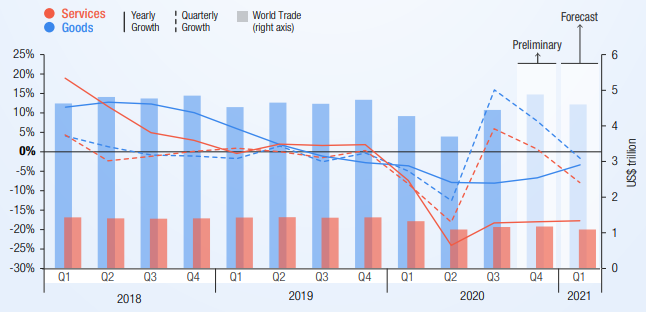
As shown in Figure 1, global trade in goods recovered by about 8 percent (quarter-over-quarter basis) in the last quarter of 2020 (Global trade update, 2021). In the same period, services trade remained almost at its third-quarter 2021 level. Performance in January and February 2021 indicates a possible recovery of goods trade by about 1.5 percent, which will enable it to reach the expected levels that the world trade enjoyed before the pandemic (Global trade update, 2021). It is also difficult to predict with certainty how global trade will unfold in 2021 partly because of continuing concerns about the current health crisis and the uncertainty of the magnitude and timing of stimulus packages in the world’s major economies.
Amid the COVID-19 pandemic, some countries gained significant trade volumes. For example, most East-Asian countries, including China, enlarged their global market share during the pandemic. As seen in Figure 2, China, Taiwan, and Vietnam experienced an increase in the volume of imported and exported goods and services. The United States had a significant drop in exported goods and a slight increase in imports. On average, the rest of East Asia gained in terms of both imports and exports. At the same time, the Organization of Petroleum Exporting Countries (OPEC) and many developed and developing countries experienced a drop in the volume of imports and exports. It is unclear what determined these different trade outcomes during the COVID-19 pandemic, but disaster preparedness and industrial development that allows speedy response to global demands may have played a role. Countries in East Asia have some of the largest and most advanced industries and manufacturing facilities that help them supply high-quality goods at reduced prices to all parts of the world.
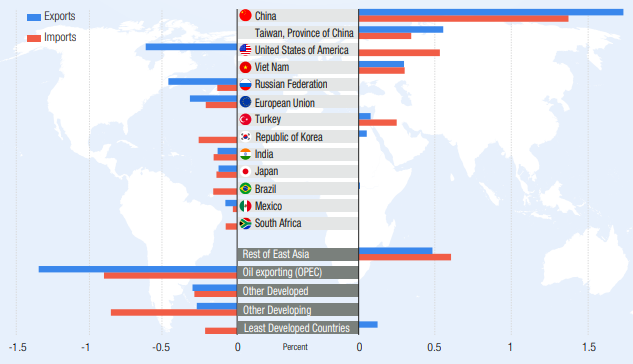
East Asia also has some of the world’s largest and busiest ports. Indeed, nine of the world’s biggest and busiest ports are in East Asia, seven of which are in China, one in Singapore, and one in South Korea. Massive Chinese ports work in the country’s favor as it has emerged as one of the largest exporters and importers in the world. It needs efficient and reliable ports to handle and clear its large annual imports and exports successfully. It implies that other countries must also develop their port’s efficiency to enjoy better international trade returns.
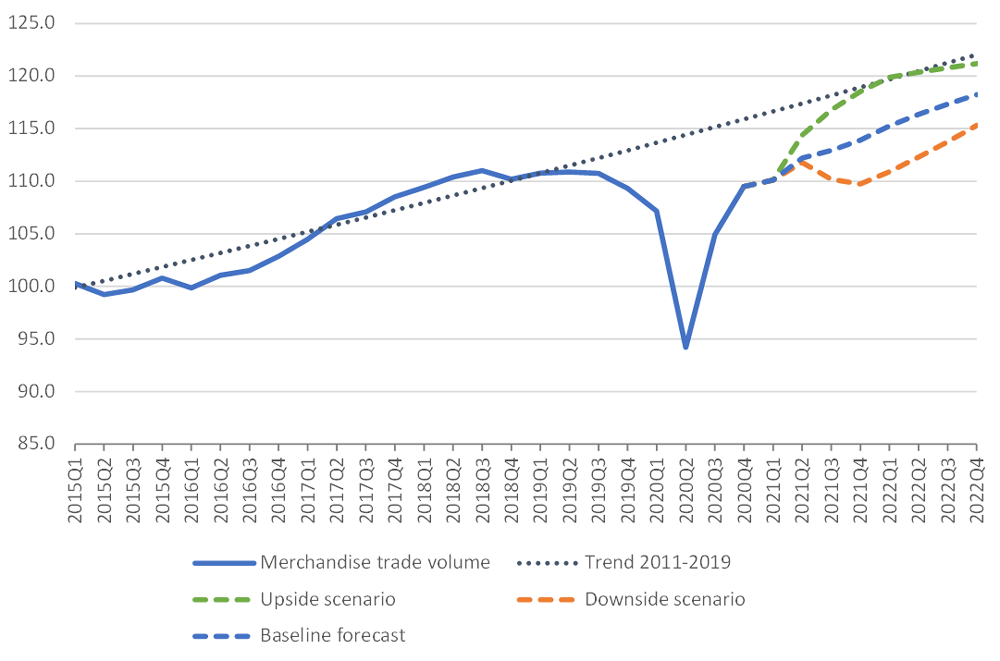
As shown in Figure 3, global trade volume was generally upward from 2015 until it took a significant dip in the first quarter of 2020. Currently, however, prospects for a speedy recovery in international trade have improved as traders worldwide have become more familiar with COVID-19 restrictions and have made the necessary adjustments to work within the new normal confines. In the second half of 2020, global merchandise trade expanded more rapidly than expected, and, in 2021, its volume would increase by 8.0 percent, having fallen by 5.3 percent in 2020 (World trade primed for strong but uneven recovery after COVID-19 pandemic shock, 2021). Likely, global trade volume would slow to 4.0 percent in 2022, and world gross domestic product (GDP) at market exchange rates would experience a 5.1 percent increase in 2021 and a 3.8 percent rise in 2022 after a 3.8 percent contraction in 2020 (World trade primed for strong but uneven recovery after COVID-19 pandemic shock, 2021). In nominal dollar terms, merchandise trade fell by 7 percent in 2020, while commercial services’ export dropped by 20 percent (World trade primed for strong but uneven recovery after COVID-19 pandemic shock, 2021). In 2020, the fuels trade declined by 35 percent due to falling oil prices (World trade primed for strong but uneven recovery after COVID-19 pandemic shock, 2021). The hard-hit sector – travel services – had a 63 percent decline in 2020 (World trade primed for strong but uneven recovery after COVID-19 pandemic shock, 2021). The travel sector is unlikely to recover fully before the pandemic wanes.
Sierra Leonean National Trade Patterns
Sierra Leon is a West-African country bordered by the Atlantic Ocean to the west, Guinea to the north and northeast, and Liberia to the south and southeast. The country’s land area is approximately 72,300 square kilometers, and its 2017 GDP was 3.8 billion dollars (Investing in Sierra Leone country facts, n.d.). In 2017, the country’s population was estimated to be 7.56 million people, around 42.1 percent of whom live in urban areas (Investing in Sierra Leone country facts, n.d.). In 2014, two shocks hit the country; a sharp decline in iron ore prices and an Ebola outbreak. Consequently, the country’s economic performance deteriorated and has yet to recover fully in 2021. The country’s economic growth seemed to pique in 2016 (at 6.3 percent). Still, it slowed again to a 3.7 percent tickle in 2017, primarily due to sluggish recovery of the iron-ore industry and reduced infrastructure investment (Investing in Sierra Leone country facts, n.d.). The 2018 Presidential Election outcomes improved Sierra Leone’s economic outlook, with moderated growth of 5.0 percent attained in 2019 (Investing in Sierra Leone country facts, n.d.). In 2020, like the rest of the world, Sierra Leon suffered negative economic consequences occasioned by the COVID-19 pandemic.
Sierra Leon is dependent on international trade for economic development. As shown in Figure 4, its main exports are derived from fuels and mining. In 2017, agricultural products also accounted for a significant portion of the country’s exports, followed by manufactured products. China is Sierra Leone’s traditional export market, but new emerging and fast-growing destinations include Belgium, United Arab Emirates, and Kazakhstan (Sierra Leone, n.d.). In 2019, the country’s top exports included titanium ore, rough wood, diamonds, and iron ore. In the agricultural sector, the country’s main exports include cocoa, coffee, and seafood (including crustaceans).
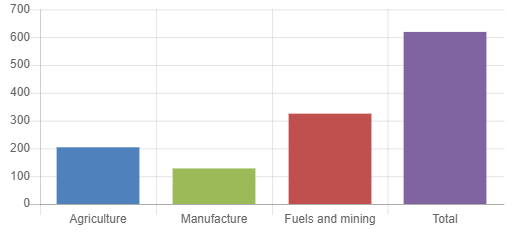
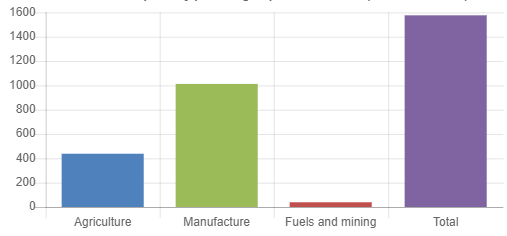
Most of what Sierra Leoneans import from the rest of the world are manufactured products. In 2017, the country imported one billion US dollars’ worth of manufactured goods and agricultural goods worth over 400 million US dollars (Sierra Leone and the WTO, n.d.). The total imports for the year, as seen in Figure 5, were almost 1.6 billion US dollars (compared to slightly over 600 million US dollars’ worth of exports in the same year) (Sierra Leone and the WTO, n.d.). Sierra Leone imports these products from China, India, the United States, and Belgium. Rice is the country’s leading import product, followed by plastic lids and packaged medicaments. It also imports machinery (mostly used in the fuels and mining sector) and cars. Imports enter and exports leave Sierra Leone mainly through the port of Free Town. It has the deepest natural harbor in Africa and a strategic location that Sierra Leon could leverage to grow its economy.
Port of Free Town’s General Description
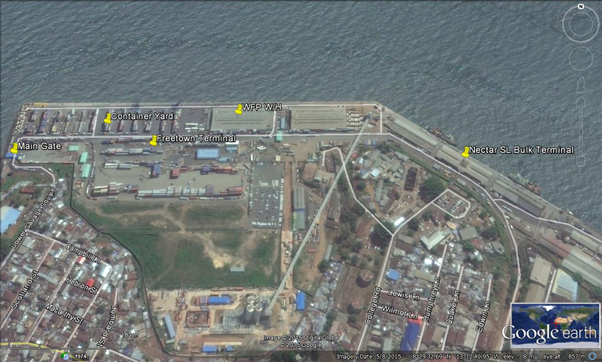
The port’s construction started in 1953 in the former Fourah Bay, with the structure projected to cost £1,470,000 in 1955. Once completed, the building measured 1,067 meters end-to-end, with a 9.1-meter draught allowance. The 1964 Port Act established the Sierra Leone Ports Authority (SLPA) and put it in charge of the facility. SLPA’s heads created the initial policies and regulations for the management of port activities, and improvements to these maiden procedures were made over time. Today, the port enjoys a better outlook than it did in the 1960s or 70s. It also has better computer systems and more skilled members of staff. However, as shown in Figure 6, little has happened in terms of the expansion of the actual port facility.
Port of Free Town’s Administration and Ownership Structure
The facility belongs to the people of Sierra Leone and is managed and controlled by their government. However, several stakeholders exist that improve the facility’s operations and effectiveness. They include Freetown Terminal Limited, which handles containerization and bulk-breaking issues (Sector scan logistics in Sierra Leon, 2018). Other stakeholders include Nectar Bulk Terminal, Africa Link, and Sierra Leone Dock Labor Company. The structure has not changed significantly recently, but improvements to the facility have been occasioned by giving some firms specific functions, including handling containers and breaking bulk.
Trade Passing Through the Port
Main imports passing through the facility include machinery, cars, and rice, while the main exports are minerals, fuels, and coffee. The destination and source of these goods are mainly in Europe, Asia, and America.
Types and Sizes of Vessels Using the Port
The port is used by small, medium, and large container and cruise ships. It also handles fishing vessels, including foreign-owned ones. Military ships from Europe, Asia, or America can also dock at the facility.
Cargo Handling Equipment Used in the Port and Hinterland Connectivity
The port of Free Town controls all marine activities relating to imports and exports. The port also monitors and directs shipping agencies and supervises passengers’ vessels. It has eight industrial forklifts and six berths and can handle more than nine million metric tons of cargo yearly. In 2017, the management increased the facility’s container stocking capacity from 20,000 to 100,0000 (2.1 Sierra Leone Port of Freetown, n.d.). The port is connected to the hinterland by a road network as the railway is no longer operational.
Additional Capacity Requirements
There are no additional capacity requirements for using the port. Usual regulations apply to help ease the movement of goods and people in the area. Services are on a first-come-first-serve basis. There are different docking areas for different vessel types.
Funding Models
The port is funded both by the government and by its users. The government allocates money to the pier every financial year to help with maintenance operations and development. The port authority also charges operators some fees for using the facility. Charges vary depending on the size, function, and ownership of the docking vessel and one’s use of the port. Good cleared and not collected also incur daily charges in storage fees.
Security and Risk Matrix
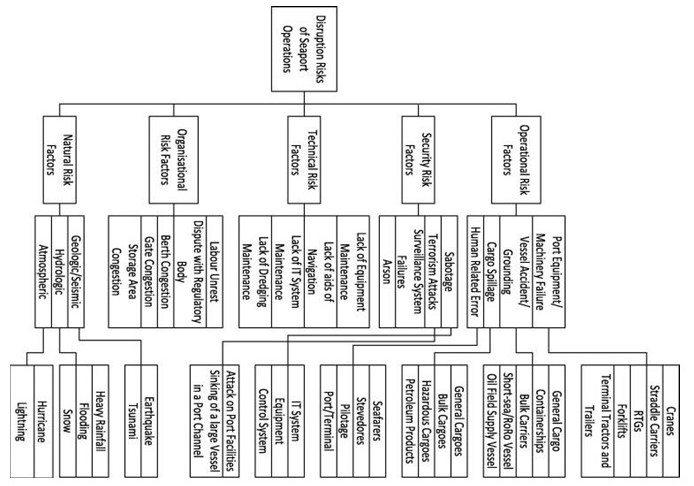
The port’s principal risks are divided into natural, organizational, technical, security, and operational perils. Examples of natural hazards include hydrologic, geologic, and atmospheric risks. Hurricanes and lightning are examples of atmospheric risks, while heavy rainfall and flooding are examples of hydrologic risks. These are real and present dangers given the ongoing climate change and global warming. Figure 7 summarizes several possible risks that could affect the port of Freetown’s operations.
Government laws and regulations are the most likely to affect the port’s operations and development. Given the strategic nature of the port of Freetown, future regulations may aim at making changes to it to increase efficiency, effectiveness, and capacity. For example, an act of parliament established the port’s authority in the 1960s. Standards by international bodies facilitate proper and more effective goods handling and better security. Without a doubt, shipping will become appropriately integrated into the country if Sierra Leon uses global standards and definitions. Examples of international standards include nautical port information standards and Electronic Product Code Information Services (EPCIS).
Reference List
2.1 Sierra Leone Port of Freetown (n.d.). Web.
De Graauw, A. (2019) Ancient port structures: An engineer’s perspective. Rome: Portus Limen Conference.
Global trade update (2021) Web.
Investing in Sierra Leone country facts (n.d) Web.
Port management series 2020. Web.
Sector scan logistics in Sierra Leon (2018) Web.
Sierra Leone (n.d.) Web.
Sierra Leone and the WTO (n.d.). Web.
Tijan et al. (2021) ‘The role of port authority in port governance and port community system implementation’, Sustainability, 13(5), 2795.
World trade primed for strong but uneven recovery after COVID-19 pandemic shock (2021) Web.