Introduction
Port management as a multilevel process has now been regarded as a complex organizational endeavor, in terms of which managers are required to account for a variety of constituents. Some of these challenges include expedition management, the movement of cargo ships, shipment schedule and itinerary, cooperation with the suppliers, warehouse management, finance allocation, maintenance, and even communication with customs. Considering such an amount of responsibility, it is of paramount importance for the business unit to ensure that the port’s performance is recorded and taken into account in terms of planning. The issue has become especially important in the context of today’s port devolution, which means that ports have to allocate finance without considering public aid (Debrie, Lacoste, and Magnan, 2017). Thus, the primary aim of the present report is to analyze and address the current issues taking place at the given port by means of evaluating the Key Performance Indicators (KPI). Such KPIs as traffic volume, earnings, staff sickness, and port congestion will be described. The second part of the report is dedicated to the conduction of risks assessment and outlining the possible options in terms of port condition improvement.
KPI Overview
In order to determine the success scope of any business, the first step would be to indicate measurable variables, the analysis, and comparison of which will eventually reflect the company’s progress over time. In such a way, the notion of a Key Performance Indicator (KPI) is introduced. In the context of port management as an international logistics tool, the shipment volume and average income serve as the most important tangible indicators (He, Xiong, and Cao, 2017). Along with the aforementioned concepts, the present report will focus on such notions of congestion, accident-incident rate, and staff sickness.
Accident – Incident Rate
Port is generally perceived as a dangerous workspace due to a variety of external factors related to location and the overall job description, which requires handling cargoes. Hence, in order to define the extent to which work-related accidents are common in the port, the accident-incident rate calculation per one hundred employees was conducted:
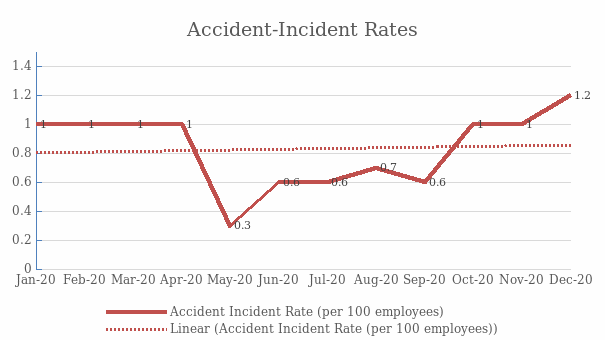
The graph above reveals that the overall accident incidence has been steadily increasing over the past three months, whereas previously, the figures were significantly lower for a long time. In case the following tendency continues, the accident rates will have increased drastically by the end of 2021. Such a scenario leads to significant losses in terms of human capital and the company’s overall reputation in the market, as safety plays one of the most important roles in terms of potential employees’ recruitment.
EBITDA
Although there exists a variety of approaches to income calculation, the most widely accepted scenario is to choose earnings before interest, taxes, depreciation, and amortization (EBITDA) as a major KPI of profitability. Thus, in Figure 2, the actual vs. budget comparison of EBITDA over the past year may be found:
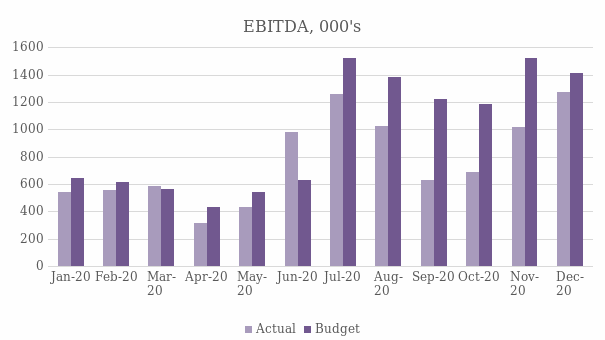
The chart below demonstrates the downward tendency of actual EBITDA over the past months. For the sake of objectivity, it should be mentioned that the overall income patterns were affected significantly by the COVID-19 outbreak. Indeed, it may be seen on the graph that March 2020 became a turning point for budget planning and estimated income per month. The only months that resulted in positive earning patterns compared to the budget were March and June. However, even such a positive turnout is still insufficient for the port proper maintenance and functioning.
Port Traffic Volume
Port traffic stands for the cargo volume handled over a certain time period. In terms of port management, both ship and traffic volume are considered among the most significant factors that indicate the ports’ relevance and demand. For the present report, the KPIs were analyzed for Ro-Ro (roll-on/roll-off) and containers as well as palletized and aggregates volume, as these types of cargoes are the most widespread in the setting.
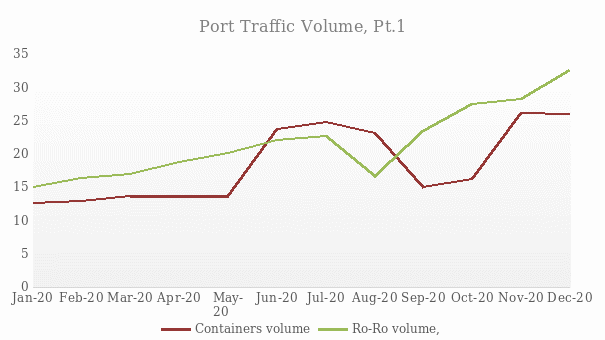
The graph above demonstrates that over the past year, the volume of the container and ro-ro cargoes has been rather unstable. The issue is visible when looking at the pattern of container volume, as after a rapid increase, the volume levels continue to drop. However, when it comes to the ro-ro volumes, they have been gradually increasing since August, creating a positive dynamic for the port and its specialization in ro-ro shipments. However, despite such an increase, the traffic volume struggles with stability, limiting the opportunities for the company’s sustainable growth. Another part of the analysis was dedicated to the quantitative assessment of the palletized and aggregates shipment volume. The results are as follows:
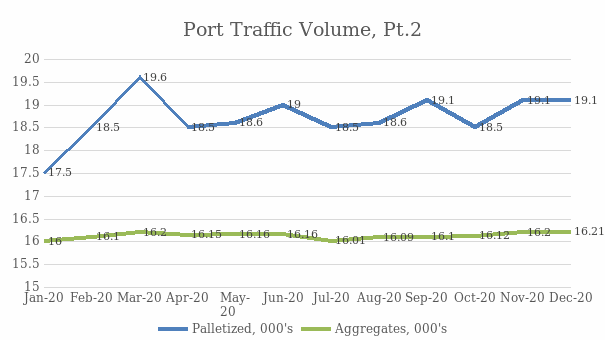
First, it is necessary to address the notion of palletized shipment volume, as the indicators appear to be rather inconsistent throughout the year due to the pandemic disruptions. However, in terms of the same timeframe, the volume of aggregates shipment has remained relatively unchanged while revealing positive dynamics. Such a disparity may be caused by the overall change in the client’s needs during the pandemic. Yet, the outcomes indicate that lack of consistency is a high risk for the company’s proper development. Hence, it may be concluded that the port requires intervention in terms of creating a relevant clientele base.
Port Congestion Volume
The shipments’ time-efficiency is one the most important things clients address when dealing with supplies. For this reason, the KPI of port congestion was analyzed according to five different timeframes of congestion:
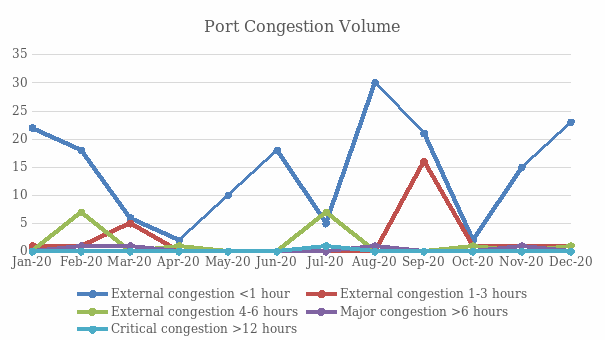
The chart demonstrates that over the past year, the port has not experienced crucial shipment delays lasting more than 3 hours. However, some major congestions in July and September expose that such a process is an external factor they may not be anticipated by the port, yet it should be handled on the shortest possible notice. As a result, it is imperative for the port to reconsider the ways in which critical congestions are averted.
Staff Sickness
The ongoing pandemic has made the notion of staff sickness one of the most significant KPIs in terms of management, as the field of human resources is now to monitor the current health status more often than ever. For this reason, the average number of sick days among the employees in 2020 was analyzed:
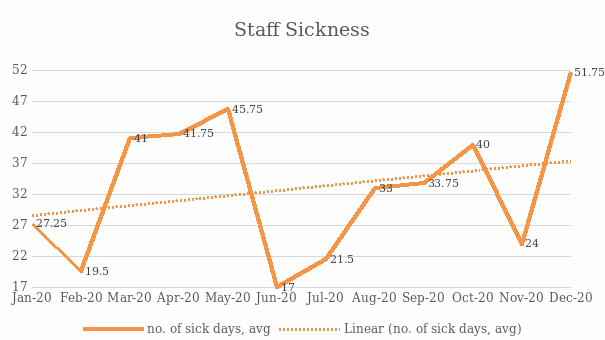
The statistics above reveal that the number of sick days has been steadily increasing over the year. Although a significant improvement may be observed in June, the sick tendency has been increasing drastically ever since. Hence, the sick days’ ratio may serve as an indicator that personal protective equipment (PPE) provision among employees is not sufficient to contain the sickness incidence in the port. Having analyzed the aforementioned KPIs, it is necessary to define which indicators possess the highest risk in terms of the entity’s development.
RAG Analysis
In order to identify a working strategy for the port’s economic development, it is of paramount importance to outline the organizational aspects that require immediate intervention. Such aspects will be identified with the help of RAG (Red, Amber, Green) analysis, which is aimed at dividing risks into categories according to the urgency with which they should be addressed by the management. Although such an analysis is not able to define the tangible measures of dealing with risks, its adoption in the context is justified by the need to identify the overall risks for the port (Anhøj and Hellesøe, 2017). Hence, considering the data represented earlier in the report, the following risks should be put in the red group:
- Human capital deficiency. The dissemination of new virus strain seems to have a severe effect on the staff’s sickness rates, creating a risk of employee deficiency and productivity drop. For this reason, the issues of PPE efficiency and quarantine policies should be reconsidered immediately.
- Port condition. Arguably the most challenging aspect of managing the port is the inability to accelerate the shipment volume due to the critical condition of the two currently operational quays. Apart from blocking the ways of volume increase, the port condition also exposes employees to higher accident risk. Thus, it is imperative that financial support is allocated for the repair works, as this process predetermines the overall KPI dynamics.
Such a number of the most urgent risks is justified by the fact that addressing these issues would inevitably affect the other less immediate yet significant risks. The next risk category, also known as amber, includes the risks that should be addressed by the directory, but their condition is not currently critical. The following group includes:
- Port congestion volume. The inconsistencies revealed by the analysis demonstrate that the port’s equipment does not obtain sufficient resources to avert the shipment delays. Although some of these reasons, such as weather conditions, are somewhat difficult to control, such issues as communication with the customs or port malfunction are capable of being dealt with by the directory.
- Port traffic volume. This particular risk is placed in the amber group due to its inconsistency as well. The high volume ratio within a year indicates that the port is currently incapable of making any long-term financial commitments such as repair works. Thus, it is necessary for the port to reconsider its communication with clientele in order to find long-term shipment customers.
- EBITDA. The income patterns presented over the past year indicate the lack of proper financial sources, thus putting the whole entity at a disadvantage. The rapid spikes in the port’s EBITDA disrupt the management’s ability to secure relevant budget objectives.
The last risk category is the green group, the purpose of which is to state the options that may be addressed at present for them not to turn out into a full-scale threat for the business. Having considered the KPIs, the only risk that may be categorized as green is the notion of accident-incidence rates. Indeed, when evaluated through the prism of the other ports, the indicator of 1.2 is relatively low for the industry, and thus, the issue does not require immediate action. However, the problem with this KPI is the growing incidence dynamics.
Port Condition
Out of all the notions discussed in the risk assessment, the need for port quay repair is rightfully considered the most urgent. Thus, in order to allocate the financial support for the repair, it is necessary to define the potential external sources, as the internal capabilities of port maintenance are currently insufficient for the port service. Thus, cooperation with the government in terms of sponsoring the repair would be the most appropriate way to address the issue, as proper port functioning is generally in the best interest of the state. The estimated repair cost for two quays constitutes 3 million, so even the complete budget re-allocation will not be able to cover the expenses.
Conclusion
The primary aim of the present report was to analyze the current state of affairs in the port. The port’s overall growth and tendencies were addressed with the help of KPI assessment, including accident incidence rate, EBITDA, port traffic volume, congestion volume, and staff sickness rate. The analysis has revealed that the current port condition has a downward tendency in terms of relevance and financial performance. After analyzing the three major risk categories, it was estimated that the first tangible step towards the port’s prosperity would be to address the port’s quay repair. Once this goal is met, the port will be capable of handling more cargoes and securing safety for the workers. Considering the current financial performance, external support from the government or investors is required.
Reference List
Anhøj, J. and Hellesøe, A.M.B. (2017) ‘The problem with red, amber, green: the need to avoid distraction by random variation in organisational performance measures’, BMJ Quality & Safety, 26(1), pp.81-84.
Debrie, J., Lacoste, R. and Magnan, M. (2017) ‘From national reforms to local compromises: The evolution of France’s model for port management, 2004–2015’, Research in Transportation Business & Management, 22, pp.114-122. Web.
He, J., Xiong, W. and Cao, Y. (2017) ‘A conceptual model of excellent performance mode of port enterprise logistics management’, Polish Maritime Research, 3, pp. 34-40.