Introduction
The memo seeks to provide an elaborate explanation of various concepts and principles that are associated with financial accounting. Specifically, the paper will discuss the financial statements and net working capital.
Balance sheet
The balance sheet shows a summary of various balances of an entity. The balance sheet gives an overview of the financial standing of a company. The statement of financial position has three segments. The first segment shows the balances of assets held by the company at the close of a financial year. The assets are categorized into current and non-current. The current assets have a short life in the books of account of the company. Examples of these assets are cash, inventory, accounts receivables, and short term investment among others. The second category of assets is the non-current assets. Examples of the items that are recorded under non-current assets are property, plant and equipment, intangible assets, and goodwill. The assets in the balance sheet are arranged in order of liquidity or permanency. The second segment of the statement of financial position shows the balances of liabilities. These are the balances that the company owes other parties. The liabilities are categorized into current and noncurrent. Examples of the current liabilities are accounts payables, portion of long-term debt that will fall due in less than one year, and accrued liabilities among others (Atrill, 2009). The non-current liabilities are made up of long-term debt and deferred tax liabilities. The third section shows the various components of the stakeholder’s equity. The balances that are recorded in this section are additional paid in capital, issued shares, retained earnings, treasury stock, and other reserves.
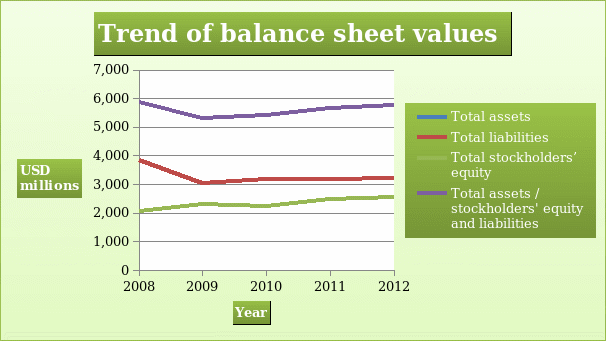
The information in the table above indicates that there was a decline in the financial position of the XYZ Construction Company between 2008 and 2009. This was caused by the global economic meltdown. Thereafter, the company reported growth in the financial position. This can be seen in the growth of the balance of total assets / total liabilities and stockholder’s equity.

Income statement
The income statement shows the balances of revenue and expenses of a company. The statement is vital because it gives information on the profitability of a company. Expenses incurred by a company are deducted from revenue to give profit earned for a given period. Further, the income statement is categorized into operating segments and non-operating segments. The operating segment gives information that directly relates to the ordinary operations of the business while the non-operating segment gives information on income and expenses that do not directly relate to the ordinary operations of the company. The information also helps various stakeholders to predict future profitability of the company. It also gives information on the earnings per share. However, preparation of the statement has a number of limitations. For instance, the balances reported highly depend on the accounting method used by the company and personal judgement.
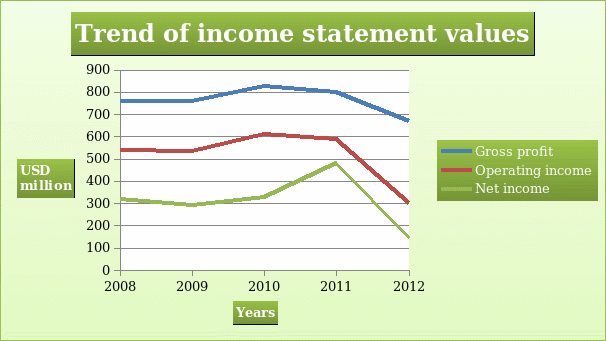
The revenue earned by the company declined over the five-year period. Revenue is a vital element of the profitability of the company. The cost of revenue had a similar trend as revenue. The gross profit margin, operating expenses, operating income and net income were volatile during the five-year period. The volatility can be explained by the swings in the market condition in which the company operates. It may also indicate that the company has not reached the maturity stage. At this stage, the values in the income statement grow at a constant rate.

Operating cash flows
The operating cash flow is the first segment of a cash flow statement. The other sections give information on investing and financing activities. The operating cash flow gives a summary of cash in and cash out from ordinary operations of the business. The cash flow is generated from activities such as sales, purchase of inventory, payment to suppliers, and collection from debtors. The value of operating cash flow is arrived at after deducting items that do not involve movement of cash (such as depreciation) from net income (Brigham & Ehrhardt, 2009). Operating cash flow gives information on the ability of the company to generate positive cash flow from operations. It also gives information on the periods when the company will require external funding.
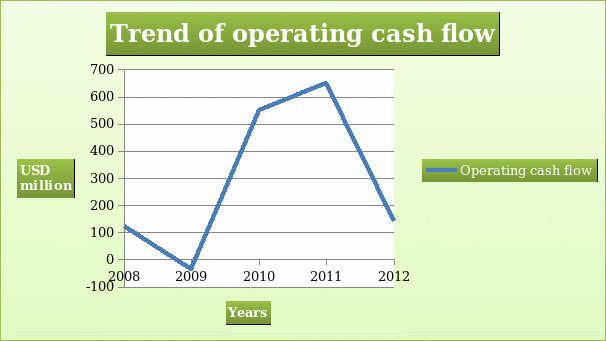
The information in the table indicates that the company was able to generate positive cash flow in all the years apart from in 2009. The negative value shows that the company required external financing to support its operations. It can also be pointed that the company has not been consistent in growing operating cash flow.

Statement of retained earnings
The statement of retained earnings records changes in the amount of retained earnings. The ending retained earnings is arrived at by deducting dividends paid from beginning retained earnings and adding net income earned in the same period (Collier, 2009).
The value of retained earnings for the company increased over the period. The increase is explained by the ability of the company to earn net income over the period.
Net working capital
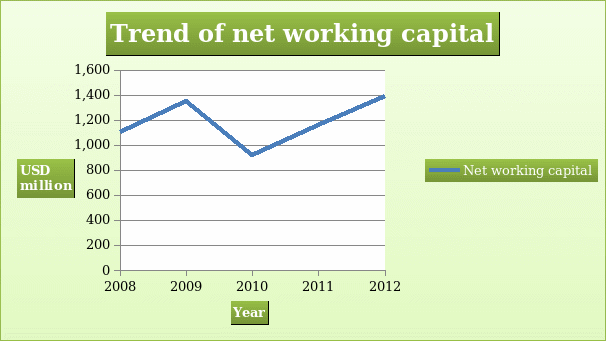
Net working capital is important because it gives the status of the short term financial health of the company (Collier, 2009). The values of net working capital are presented in the table below.
The table shows that the company had positive net working capital during the five year period. This shows that the company is able to meet short term obligations. This shows that the company has sound short term financial health.

Conclusion
In summary, the financial statements discussed above are interrelated. The output of one statement is an input of another statement. Therefore, the statements need to be analyzed concurrently.
References
Atrill, P. (2009). Financial management for decision makers. USA: Prentice Hall.
Brigham, E., & Ehrhardt, M. (2009). Financial management theory and practice. USA: Cengage Learning.
Collier, P. (2009). Accounting for managers. London: John Wiley & Sons Ltd.

