Ticker: 2330 Recommendation: Hold.
Price: SR 41.40 Price target: SR 54.58
Highlights
- The company presents a strong financial position in all five years. Its profitability declined in 2012, but the firm recovered in 2013. Al Rajhi Capital (2014) estimates indicate that the firm’s revenue will decline by 13.2% in 2014, and then increase by 10.5% in 2015.
- The firm’s net income and net profit margin improved in the five-year period except for the year 2012. The net profit margin shows the firm’s increased efficiency in generating profits.
- Analysts’ ratings indicate that the firm outperforms the sector. It is also considered a low-risk investment. It’s ROE and ROA indicate improvement in four out of the five years. The company is expected to maintain an ROE of about 16% in the next two years.
- The firm’s current ratio and quick ratio, throughout the five years, indicate favorable liquidity conditions. Its liquidity has improved in the five-year period.
- The interest coverage ratio has increased year after year in the five-year period. The company shows an increased ability to pay interest expenses. The company is likely to maintain its dividend trend because interest expense and debts can be easily covered.
- The cash flow adequacy ratio also shows improvement, and the ability to cover its operational needs.
- The firm has consistently reduced the proportion of long-term debt within the five years. It shows the reduced risk for shareholders. The debt ratio and debt to equity ratio have declined year after year in the five-year period.
- A target price of SR 54.58 is generated from the valuation analysis. It is 13.4% higher than the current market price. The P/E ratio and P/BV ratio have been used to compare the market value and the book values, which are derived from its financial statements. The DCF model and the DDM are used to evaluate the intrinsic value of the stock, considering 40 years of operation for the DDM, and 5 years for the DCF.
- The main risk is the firm’s reliance on two products, propylene and polypropylene. Considering the proportion of dependency on the two products, the firm needs to diversify its product mix.
Business Description
Advanced Petrochemicals was established in October 2005 with a capital base of SR 1.64B (Advanced Petrochemical Company, 2014a). It is listed as a joint-stock company on the Saudi Stock’s Exchange (Tadawul). Its initial public offer on the Saudi Stock Market was on January 20, 2007. The company offered 141,375,000 shares at a price of SR10.00, and its opening price was SR 18.50 (GulfBase, 2014).
It was initially known as Advanced Polypropylene. National Propylene Ltd., from where it was formed, owns 7.9% of the company. General Organization for Social Insurance owns 6.30% (Mubasher.info, 2014). The two companies are the major shareholders. Mr. Khalifa Al Mulhim and Mr. Monther Laheeq were the partners, who owned National Propylene that facilitated the formation of Advanced Petrochemicals. Mr. Khalifa is now chairman (Advanced Petrochemical Company, 2014a). Eng. Abdulah Mogbil Al Garawi is the CEO responsible for all operations of the firm. The management has a mandate to make forecasts, plans, and ensure the effectiveness and efficiency of operations. The company has 300 employees (GulfBase, 2014). In 2012, it entered into a joint project with a Turkish firm, Bayegan Group, worth US 1 billion to build a Propane Dehydrogenation (PDH) and polypropylene plant (4-traders, 2012).
The company produces “455,000 tons of propylene, and 450,000 tons of polypropylene annually from its manufacturing facilities found in Jubail Industrial City” (Advanced Petrochemical Company, 2014a, para. 3).
The company has been granted rights to use the PDH-C Technology and the Novolen Technology for the production of its propylene, and polypropylene. PDH-Catifin is owned by Lummus Global Inc, which is a U.S. company. The Novolen Technology is owned by Lummus’ affiliate company, Novolen Technology Holdings. It has been engaged in contracts to supply its products to major players in other industries such as Mitsubishi Corporation, and Vinmar International (Advanced Petrochemical Company, 2014a).
The company’s vision is to act “responsibly towards all stakeholders” (Advanced Petrochemical Company, 2014b, para. 1). Its mission is to “provide quality products through professional work environment to maximize profit in a socially responsible and sustainable manner” (Advanced Petrochemical Company, 2014b, para. 2). The company’s values include excellence, customer satisfaction, continuous improvement, team spirit, and transparency.
Its products are used for the production of common plastic products used by households. It also manufactures products used in other industries such as construction, automobile, retail-packaging, and textile (Advanced Petrochemical Co Ltd. (TADAWUL: 2330), 2014). Polypropylene is used in the manufacture of plastics. Vinyl acetate is used in paints, paper, and textiles. Ethylene glycol is used for making synthetic fibers such as polyester. Styrene is used in the manufacture of rubber, and plastics (Advanced Petrochemical Co Ltd. (TADAWUL: 2330), 2014). There are also other products in the company’s product mix. The products are derivatives of petroleum. The company supplies large manufacturing companies in the Middle East and North Africa, which provide a stable market.
Industry Overview and Competitive Positioning
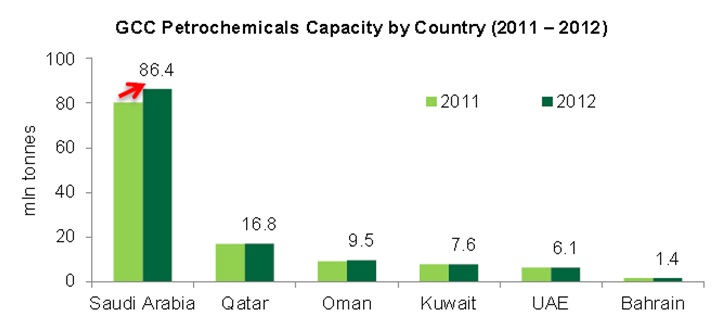
Advanced Petrochemical Co. falls under the petrochemicals industry sector in Tadawul. The sector has 14 companies listed on the Tadawul Stocks Exchange (TASI). The Saudi petrochemical industry is the largest in the gulf region occupying 67.6% capacity for petrochemicals in the region (KFH Research Ltd., 2013). It constitutes a capacity of 86.4 million tons, which includes a 7.5% increase from the 2012 capacity.
The GCC capacity reached 127.8 million tons in 2013, inclusive of a 5.5% increase from 2012. Qatar is the second with a capacity of 16.8 million tons (KFH Research Ltd., 2013, Please see appendix 1). It is clear that Saudi Arabia has a higher growth rate compared to the GCC in general. The Saudi Arabia companies also invest in China. They also consider investing in North America to take advantage of the emerging shale gas & oil extraction.
The Saudi petrochemicals sector has a high expansion rate. The need for investment ensures that more capital is used in the sector to increase production. Global macroeconomic conditions are favorable, and the world GDP is expected to grow at a rate of 3.5% in 2014, and 4.0% in 2015 (Samba, 2013). The Saudi GDP growth rate was 4.4% in 2013, and 4.2% is expected in 2014 (Samba, 2013, Please Appendix 2).
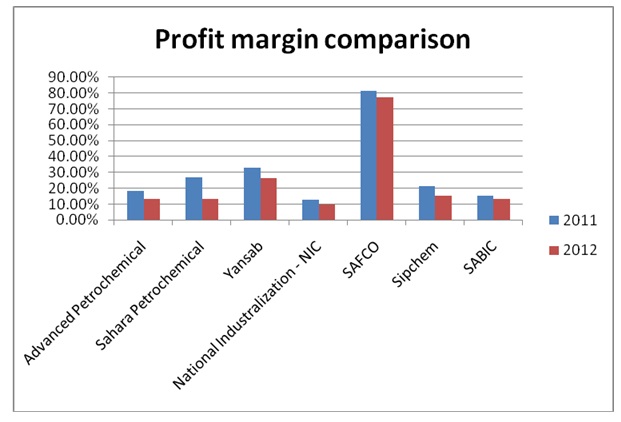
Favorable global economic conditions may favor exports. Advanced Petrochemical is expected to be the second most profitable firm in the sector. In 2013, three firms’ profitability captured 89% of the sector’s profits, which is SR 34.77 billion (Taha, 2014). SABIC by itself accounted for 72% of the sector’s profits in 2013. However, profit margins are within the same range (see Appendix 3).
The Saudi petrochemicals sector is expected to grow at a higher rate because of the level of investment in the sector. There are about 80 new plants under construction in Saudi Arabia. NCB (2011) estimates indicate that projects under construction are worth about USD 63 billion. The U.S. -Saudi Arabian Business Council (2011) projects that the sector may invest about USD 90 billion in the next 10 years to build plants. The petrochemical sector is expected to grow by 17.4% in 2014 at a cost of SR 40.1 (USD 11 billion) (Zawya, 2013). The Saudi petrochemical industry is the fastest-growing sector in the country. It is also among the fastest-growing petrochemical industries in the world.
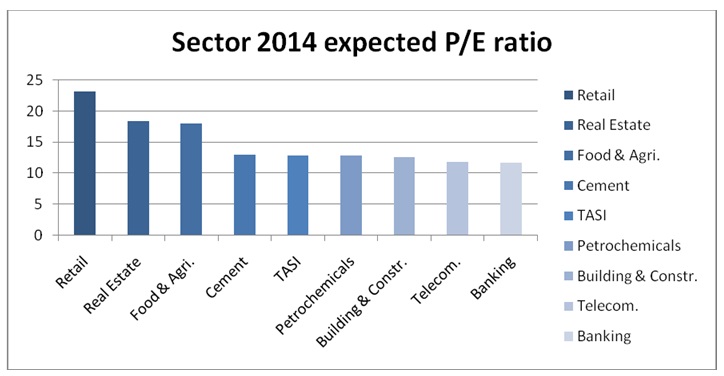
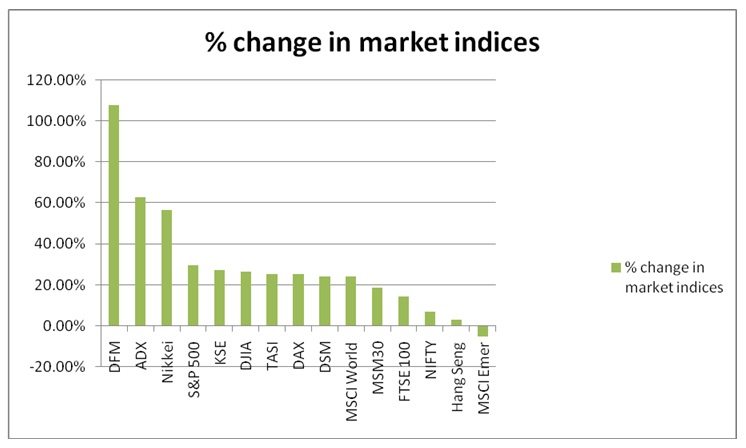
Advanced Petrochemical Co. had a better performance than the market average in 2013. The retail sector had the best stock performance in 2013, followed by Real Estate (Al Rajhi Capital, 2014). The expected stock performance is slightly below the expected average for TASI (Please see Appendix 4). TASI’s performance compared with major global markets is considered average (Please see Appendix 5 & 6).
Investment Summary
The price target of Advanced Petrochemical stock is SR 54.58, its current price is around SR 41.40 (Al Rajhi Capital, 2014. The target price is 13.4% higher than the current market price. The price to book value ratio is used to compare the gap between the market price and the book value, which is supported by assets. The DCF model and the DDM are used to evaluate the stock’s expected value.
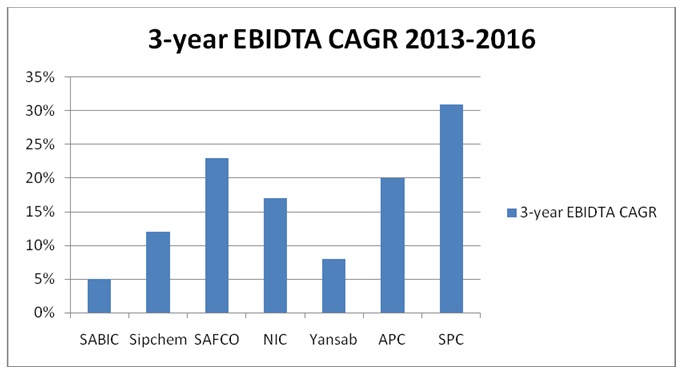
Increased efficiency is likely to increase the firm’s performance in 2014. Advanced Petrochemical profitability (EBIDTA) is expected to grow at 20% CAGR from 2013 to 2016 (Please see Appendix 5). The expected growth rate is the third-best on the list.
The expected revenue for 2014 is SR 2,375 million, a decline from SR 2,736 million, which is the actual revenue in 2013 (Al Rajhi Capital, 2014). EBIDTA margin is expected at 27.5% in 2014, and 20.8% in 2015. Net profit margin is expected at 16.3% in 2014, and 16.7% in 2015. ROE is expected at 15.8% in 2014, and 16.2% in 2015 (Al RajHi Capital, 2014). The 2014E figure represents a decline of about 9% from the 2013 ROE percentage.
Advanced Petrochemical is considered volatile because of an overreliance on propylene and propylene as its main products. Cheap propane feedstock from Saudi Aramco is likely to boost its profitability. A new contract that increased supply from Saudi Aramco, in January 2014, is likely to create a competitive advantage (Al Rajhi Capital, 2014).
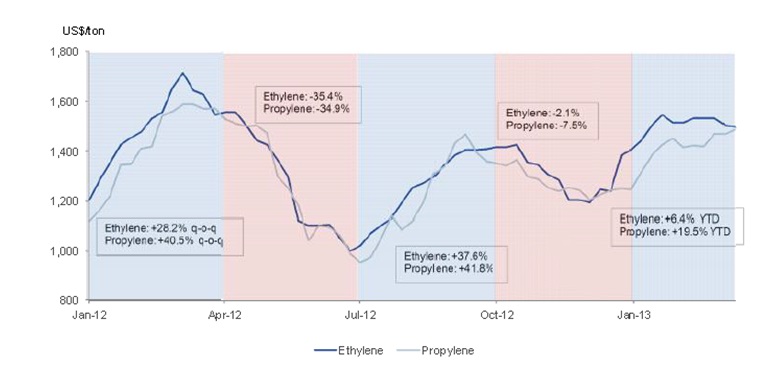
The main risk that is likely to affect Advanced Petrochemical’s performance is price volatility, especially in its key products (Please see Appendix 7). However, from mid-2013, the prices have improved compared to the past years. The shale oil & gas production in North America is likely to reduce the competitive advantage of firms that do not produce in North America but operate in the global market (NCB, 2011).
Valuation
The price/ earnings ratio has been used to compare the performance of the firm with other firms. An investor is likely to consider how much he is likely to earn by holding the firm’s stock compared with others. The price/ book value ratio is used to show that there is strong investor confidence in the firm’s stock.
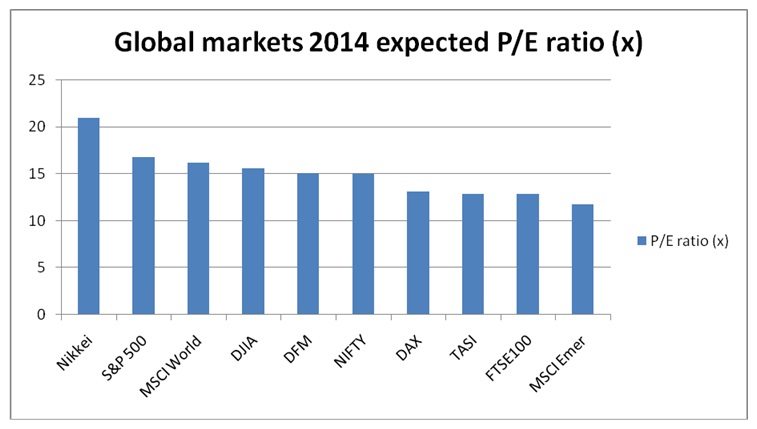
Advanced Petrochemical actual P/E ratio was higher than most of its peers in 2012, but it was much lower in 2013 (Please see Appendix 8). The expected P/E ratio for 2014 and 2015 is higher than most of its peers. In 2013, the industry’s average was 11.9 compared with APC’s 12.0 (Bloomberg, 2014). It is also higher than the expected P/E averages for major stock markets across the globe (Please see Appendix 9). The P/E ratio indicates what an investor expects to earn relative to the price. Similar earnings at a higher price will result in a higher ratio, which indicates that a higher ratio portrays investor confidence in the firm’s stock.
The P/BV ratio indicates that Advanced Petrochemical’s stock is overvalued by investors compared to most of the companies in the sector. In 2013, the industry’s average P/BV ratio was 2.9 compared with 3.0 for APC (Bloomberg, 2014). It may also indicate that investors are more confident about the stock compared with the other firms in the industry. Only SAFCO presents a higher P/BV ratio than APC (Please see Appendix 10). The mismatch between the market value and the book value is expected to decline in 2014 and 2015.
Using the discounted cash flow model (DCF), and the discounted dividend model (DDM), the target price of the stock is set at SR 54.58 (Please see Appendix 11). In the calculations, the DDM takes a weight of 90%, and DCF has a weight of 10%. The DDM model considers 40 years of the firm’s operation and an annual growth rate of 10%. The DCF considers five years’ future cash flow, which uses the net change in cash flows. The growth rate used in the DCF model is 16% annually.
Financial Analysis
The financial analysis considers net income, EPS, ROA, and ROE as the key indicators for the analysis of Advanced Petrochemical’s financial position from 2009 to 2013. Net income margin shows the firm’s efficiency in converting revenues into profit. EPS and ROE show how well the firm adds value to shareholders’ holdings. ROA shows the efficiency of utilizing assets (Please see Appendix 12).
2010 APC net income increased from SR 127.123 million to SR 328.317 million. The net profit margin increased from 8.67% in 2009 to 16.17% in 2010, which indicates increased profitability. ROE increased from 7.61% in 2009 to 18.13% in 2010. EPS increased from SR 0.78 to SR 2.00. ROA increased from 3.72% to 9.76%.
2011 APC’s net income moved from SR 328.317 in 2010 to 512.804 million in 2011, which represents an increase of 56.19% from the previous year. The net profit margin increased from 16.17% to 18.37%. EPS improved greatly, from SR 2.00 in 2010 to SR 3.13 in 2011.ROE also improved from 18.13% to 25.28% showing the firm’s increased improvement in creating value for shareholders. ROA increased from 9.76% to 15.17% in 2011, which indicates increased efficiency in utilizing assets to generate profits. Profits were boosted by increased utilization of capacity to 100%, and discounts from Saudi Aramco propylene feedstock (Al Rajhi Capital, 2014).
2012 saw APC’s net income decreased by 35.99%. It dropped from SR 512.804 million in 2011 to SR328.237 million in 2012. The decline in net income is attributed to the decline in revenues from SR 2.79 billion in 2011 to SR 2.47 billion in 2012. EPS declined from SR 3.13 to SR 2.00. ROE also declined from 25.28% in 2011 to 16.07% in 2012. ROA declined from 15.17% to 10.18%. It shows that the firm generated less profit from assets when the firm reduced its assets.
2013 saw APC’s net income increase by 69.65% from the previous year. The net profit margin increased from 13.28% to 19.99%. The increase in net income is attributed to an increase from SR 2.472 billion in 2012 to SR 2.785 billion in 2013, which is back to the same level it was in 2011. EPS increased from SR 2.00 to SR 3.40. ROE increased from 16.07% to 24.70%. ROA increased from 10.18% in 2012 to 17.27% in 2013. 2013 represents a year that assets were utilized more efficiently than the other years in the five-year period.
2014 Al Rajhi Capital (2014) expects that APC will report a net profit margin of 16.3% in 2014. Revenues are expected to decline in 2014 to SR 2.375 billion, and then increase to SR 2.624 billion in 2015. EPS is expected to drop to SR 2.36 in 2014.
Overall
APC’s net profit margin shows a trend of increasing efficiency in generating profits, utilizing assets, and increasing the shareholders’ wealth. The EPS trend indicates that the company is committed to maintaining an upward trend. The company will need to find ways to increase its revenues. It appears its limit is set to the 2011 value. Net income relies on revenues, which are reliant on propylene, and polypropylene sales.
Other indicators
Other indicators used to evaluate the financial performance of the firm include the current ratio, debt ratio, debt to equity ratio, interest coverage ratio, and cash flow adequacy ratio.
- The current ratio has increased over the five years, which indicates improved liquidity for the firm.
- The debt ratio indicates a decline in long-term debt. Shareholders’ risk has been reduced over the five-year period. Shareholders’ risk refers to the ability to retain equity and share dividends.
- The interest coverage ratio has increased over the five years, which indicates that Advanced Petrochemical’s ability to service debts has improved. The firm will find it easier to share dividends.
- The cash flow adequacy ratio indicates that the proportion of cash available from operating activities has increased. The firm’s operational needs are well-covered.
- The debt to equity ratio shows that the proportion of debt has become smaller in the firm capital, which indicates a reduced risk of bankruptcy.
Investment Risk
There are three major risks that face Advanced Petrochemical Co.
- Diversity risk: The firm relies on two main products for its revenues. Any decline in revenues, as seen in 2012, greatly affects the profitability of the firm. The firm needs more diversification to reduce wide fluctuations in its revenues (Al Rajhi Capital, 2014).
- Price of products: The global market prices of products are volatile, which increases risk. It may require hedging, which may increase the cost of its operations (Al Rajhi Capital, 2013).
- Competitive risk: Lower production costs in North America, attributed to shale oil & gas production, reduce the advantage of firms operating in the Middle East (GPCA, (2013a).
Appendices
Appendix 1
Appendix 2
Appendix 3 Al Rajhi Capital (2014).
Appendix 4 Source: Al Rajhi Capital (2014).
Appendix 5
Appendix 6 Source: Al Rajhi Capital (2014).
Appendix 7
Appendix 8
Appendix 9 Source: Al Rajhi Capital (2014).
Appendix 10
Appendix 11
Discounted Dividend Model
According to the DDM Model (Damodaran, 2012), Value per share = Σ E(DPS)/ (1 + Kc)t, where Kc is the cost of equity, t is the number of periods, and DPS is expected dividends per share. Assuming the cost of equity at 7%, and expected DPS SR 1.99 in 2014. The DDM model considers 40 years of the firm’s operation and an annual growth rate of 10%. It uses future value annuity for 40 years at 10%, which is 442.5926.
Value per share of stock = (1.99 * 442.5926)/ (1 + 0.07)40 = 880.7592/ 14.97 = SR 58.83.
The Discounted Cash Flow model
According to Grossman & Livingstone (2009), the DCF value = CF1/ (1 + i)1 + CF2/ (1 + i)2 ……CFt/ (1 + i)t. Cash flow to shareholders = after-tax net income + Depr. & Amort. – Interest expense – increase (+decrease) in working capital requirements + increase (-decrease) in long-term debt. It is almost similar to the cash flow presented in the financial statements. The DCF considers five years of future cash flow, which uses net change in cash flows.
Fair value = (0.9*58.83) + (0.1*16.30) = SR54.58
DDM has a weight of 90%, and DCF has a weight of 10%.
References
Advanced Petrochemical Co Ltd. (TADAWUL: 2330). (2014). Web.
Advanced Petrochemical Company. (2014a). About Advanced. Web.
Advanced Petrochemical Company. (2014b). Vision, Mission, and Values. Web.
Al Rajhi Capital. (2014). Saudi Arabia: Equity market outlook. Web.
Al Rajhi Capital. (2013). Saudi petrochemical sector: Challenging times ahead. Web.
Bloomberg (2014). Advanced Petrochemicals Co (APPC: Saudi Arabian Stock Exchange). Web.
Damodaran, A. (2012). Investment valuation: Tools and technique for determining the value of any asset. Hoboken, NJ: John Wiley & Sons.
GPCA. (2013a). GCC petrochemicals & chemicals industry: Facts & figures 2012. Web.
GPCA. (2013b). Unlocking the full economic potential of Saudi Arabia’s petrochemicals industry. Web.
Grossman, T., & Livingstone, J. (2009). The portable MBA in finance and accounting. Hoboken, NJ: John Wiley & Sons.
GulfBase. (2014). Advanced Petrochemical Co. APPC. Web.
KFH Research Ltd. (2013). Saudi petrochemical: “Tread with caution”. Web.
Mubasher.info. (2014). Advanced Petrochemical (2330). Web.
NCB. (2011). The Kingdom’s comparative advantages propel its global position in petrochemicals. Web.
Samba. (2013). Saudi Arabia: Baseline forecast 2013-15. Web.
Taha, S. (2014). Three petchem firms capture 89% of sectors profits in 2013 [Press release]. Web.
4-traders. (2012). Advanced Petrochemical Co Ltd: Advanced Petrochemical Company and Bayegan Group Signs Memorandum of Understanding for US$1 billion PDH-PP Plant in Turkey. Web.
U.S.-Saudi Arabian Business Council. (2011). The petrochemicals and plastic sector in the Kingdom of Saudi Arabia. Web.