Introduction
This assignment evaluates a basketball shoe manufacturing company. The company is currently able to sell an average of 1,000 shoe pairs every month at $100 per piece. The fixed cost incurred by the company monthly is $35,000 and the changeable costs are 40% of sales. The director in charge of marketing operations of the firm is asking for an increase in the amount of money budgeted for carrying out advertising to $1,500 monthly. She wants to start marketing the company products in a new area around the West Coast where she is anticipating a 50% increase in demand.
Consequently, in such a scenario, the expected increase in the cost of advertising is considered to be a fixed cost. Therefore, the operations of the company are definitely affected by the increased cost. On the contrary, the manager in charge of all production believes that increased sales caused by higher product demand could put more pressure on the line of production. As a result, the manager expects that there will be a $2.00 increase in labor cost incurred in every unit.
By using the monthly income that has been calculated above, the number of units that the company is required to sell to attain the first figure of monthly income will be calculated. Additionally, the required volumes of break-Even sales will be determined as well. There is also a requirement that a summary of the analysis of the results be done. Therefore, this can be achieved by determining the following: how to perform calculations of the original income of doing operations and break-even point before changes. Finding the break-even point after the inclusion of the effects of the increased cost of advertisement and standing cost, comparing the two outcomes of break-even points, and finally making recommendation whether it is right for the company to make changes or not.
Organizations calculate their break-even point to identify whether they lose money in certain situations. In accounting, the break-even point is where earnings are equal to the total costs (Batkovskiy et al., 2017). This is a point where a firm is neither making profits nor losing any money. Therefore, calculating the break-even points in an organization helps it know the price and the number of products the company is required to sell to break even (Batkovskiy et al., 2017). Analysis of break-even considers the total number of variable and fixed costs (Batkovskiy et al., 2017). Rather than just determining a break-even point, their analysis highlights the expenses incurred, income gained by the company as well as the areas that need improvements to decrease its costs and increase gains.
Many firms calculate the break-even point in terms of units. This means that a firm can calculate the number of units it is required to sell so that in can break even (Batkovskiy et al., 2017). Therefore, the firm divides the sum of fixed costs by the unit’s contribution margin. Analyzing the break-even point is beneficial to the company because it provides important information. For instance, if the break-even shows that the sale price of a product is low, then the firm might decide to increase the price of the product or decreased the cost of producing the product (Batkovskiy et al., 2017). Nevertheless, increasing the cost of the product might make it more costs than other competing products in the market. Hence, the resulting higher competition might harm the total sales of the units, and the organization might not come near to breaking even (Batkovskiy et al., 2017). Therefore, a company’s profits, volume of sales and costs are vital components in identifying the break-even point of a company.
The Number of Units that the Company Is Required to Sell to Attain the First Figure Monthly Income
The request submitted by the director in charge of advertising to increase her budget by $1,500 per month upturns the initial fixed cost of the company, which burdens the break-even point. As a result, dealing with the additional cost caused by the increased cost of advertising requires the company to sell additional units (Park, 2018). Additionally, an increase in the cost of labor is can adversely influence the profit margin of the company per unit (Park, 2018). Therefore, the company will tend to sell an increased number of shoe pairs to cover up for the increased cost with a lesser margin.
What is the break-even sales volume needed?
The 584 units are mandatory to be sold to attain break-even sales before the director decides to invest in advertisements.
Summary of the Analysis of the Results
At the start, the firm is operating at a fixed cost of $35,000 and 40% of sales variable cost per unit which is $40. Before making earnings, the organization ought to attain the cost of standing costs of $35,000. Therefore, the organization gains $60 per unit as a margin of contributions after deducting the varying expenses from the unit sale price to attain the cost of $35,000. Therefore, the firm is supposed to sell a minimum of 5834 pieces to achieve the fixed costs, where other additional sales make a profit for the company.
Calculation of Break-Even and Cost of Operation
From the earlier discussion, it is evident that the firm should work on a fixed cost of $35,000 before deciding to invest its funds into advertising. For that reason, the margin of the contribution of every piece is divided by the fixed cost (“Break-Even Analysis,” 2021). Therefore, break-even unit calculations were 584 units. Calculation of the cost of the organization’s cost of operation is done by deducting the variable cost and the fixed cost from the total sales which equals $25,000 (“What is Operating Income,” 2020).
New Break-Even Point after Inclusion of the Effects of the Advertising and Increasing the Cost of Variable
Comparison of the Two Break-Even Results
Because of the rise of the expenditure incurred when doing advertisements, there has been an increase in Break-Even Point. This has been caused by the volume of sales that have been increased up to $47,500. Therefore, I propose that the company needs to proceed in incurring the expenditure (“Break-Even Analysis,” 2021). This is because the total effectiveness has improved as evidenced by the high volume of sales (“Break-Even Analysis,” 2021). However, it is important to note that improvements in the Break-Even point never signify that the firm ought to raise the level of activity.
Calculation of The New Profits after doing Advertisement will be:
Assumptions
The assignment makes the following postulations
A piece is regarded as a Pair of Shoes.
Break-Even Analysis
Comparison of Break-Even Point in Two Scenarios
Because of the increased cost of advertising, the break-even point has also increased, but this has altered the volume of sales. Therefore, the firm ought to accept incurring these expenses such as higher advertisement cost and cost of labor because in the end there is total profitability from the increased sale of products (“Break-Even Analysis,” 2021). Conclusively, it is important to note that an increase in the level of BEP does not indicate an increase in the level of activity.
Budgeting
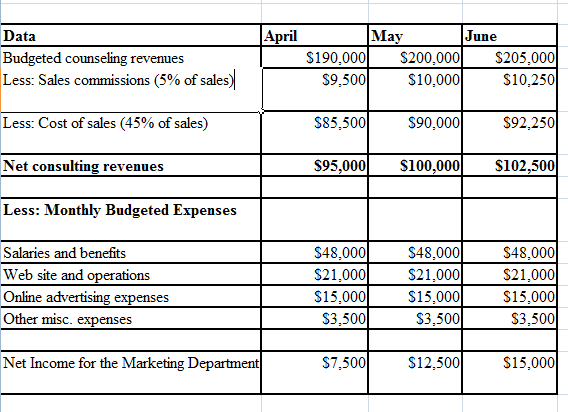
The managerial accountant has been tasked with the duty of helping manage the master budgets of the marketing department. The role played by the marketing department is selling the consulting expert services to other small firms, hiring subcontractors, and management of the firm’s marketing. The most frequent expenditure of the firm is the cost incurred when doing advertisements, operation and website maintenance, benefits and salaries of $48,000 per month, and finally other various expenses of $3,500 per month. The estimated sales for consultation services for April, May, and June are $190,000, $200,000, and $205,000 consecutively.
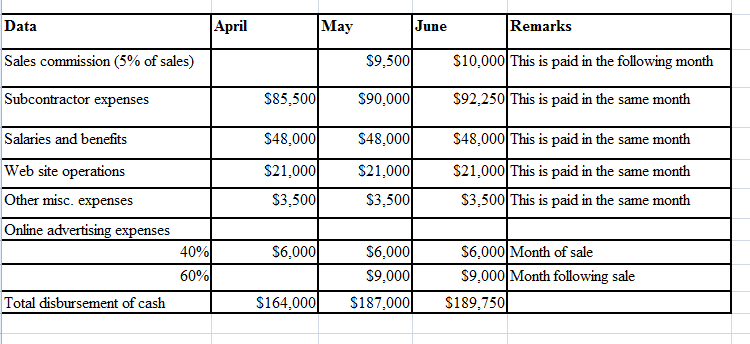
A commission of 5% on sales is paid every subsequent month. The anticipated expenditure of subcontractors on sales is 45% and is paid following the month that they are billed. 20% of the fee charged for consultation services is collected in the month of sale, 70% in the month that follows, and 10% in the second month that follows the sale. The accountant has to create a master budget for the marketing sector. The task to be completed comprise completing the schedule that has been attached for a master budget meant for the marketing sector and supporting plans meant for collecting and disbursing cash.
The accountant’s suggestions are based on the budgets and take actions to develop the master budgets for the marketing department, create a plan for the predictable collection of cash, and provide appropriate advice according to those budgets. Budgeting refers to a strategy that a firm uses when spending its resources. By observing appropriate budgeting skills, a firm can stay away from financial dilemmas and use the available assets in the most effective way (Kausalya & Bist, 2017). Additionally, budgeting enables a firm in preparing and forecasting thus improving its effectiveness (Kausalya & Bist, 2017).
A master budget is made up of inclusive monetary planning. It is made up of low-level budgets contained by the operational budget and the monetary budget (Kausalya & Bist, 2017). It also provides an organization with a wide outline of its resources and is normally employed as a tool for essential scheduling.
The operational budget reveals how the firm’s income generation happens, expenses, and income resulting in a budgeted financial statement. A master budget comprises of Capital Expenditure, Budgeted Balance Sheet, Cash Budget, administrative Budget, Cost of Goods Sold Budget, finished Goods Inventory, Labor, Direct Materials, Production Schedule, and sales budget (Kausalya & Bist, 2017). Therefore, the financial plan outlines money outflows and inflows as well as the rest of the fundamentals of the firm’s economic condition which originates from the financial plan.
Marketing Department Master Budget
A master budget includes complete financial budgeting; it encompasses a lower-level plan controlled by the financial and operating budget. It is provided by an organization with a brief outline of its resources and is used as an essential tool for business planning (Oyebode, 2018). Observing the master plan, it is evident that after deducting the sales and expenditure on a monthly budget, there has been an increase in net revenue from April to June. Therefore, the organization is now able to work on decreasing the expenses incurred on advertisements and online website activities to decrease the expenses. The other important recommendation is by working to decreased commission on sales.
Net Revenues from Consultation
[April = 190,000 – 9,500 – 85,500 = 95,000]
[May = 200,000 – 10,000 – 90,000 = 100,000]
[June = 205,000 – 10,250 – 92,250 = 102,500]
Net Income for the Marketing Department – Net Consulting Revenue – Expenses
April [95,000 – 48,000 – 21,000 – 15,000 – 3,500 = 7,500]
May [100000 – 48,000 – 21,000 – 15,000 – 3,500 = 12,500]
June [102,500 – 48,000 – 21,000 – 15,000 – 3,500 = 15,000]
Reliable Company Marketing Department Master Budget
Schedule of Expected Cash Collection
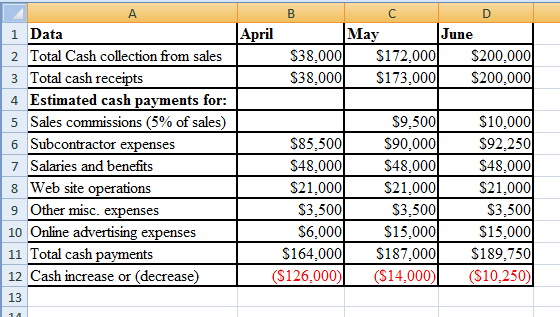
Collection of cash refers to the process of collecting funds from companies that have been issuing invoices by the firm. It makes sure that the flow of cash is regular and it is collected at the right time before the due date (Oyebode, 2018). Collecting cash helps to avoid funds from being changed into bad cash (Oyebode, 2018). Examining the process of collecting cash, it is evident that the process has been excellent and the company is in a position to retrieve a good amount (Oyebode, 2018). The appropriate suggestion would be to keep the process in operation to decrease losses by not changing debit into bad cash.
Cash Collection
April – 20% of 190,000 = 38,000/May – 20% of 200,000 = 40,000
70% of 190,000 = 133,000/70% of 200,000 = 140,000/10% of 190,000 = 19,000
Total cash collection from sales = April 38,000/May [133,000 + 40,000 = 173,000]/June [41,000 + 140,000 + 19,000 = 200,000]
Calculation for Cash Collection from Sales

Disbursement of Cash
Disbursement of cash is known as funds that the company pays in exchange for goods and services provided to the company, dividend payment, or customer payment (Bragg, 2021). Below is a table showing how disbursement has been increasing. Therefore, some disbursements can be restricted by using alternative methods for subcontractors or management of online expenditure to lower operating costs.
Total Disbursement of Cash – April = [85,000 + 48,000 + 21,000 + 3,500 + 6000 = 164,000] / May = [9500 + 90,000 + 48,000 + 21,000 + 3500 + 6000 + 9000 = 187,000] / June = 10,000 + 92,250 + 48,000 + 21,000 + 3,500 + 6,000 + 9,000 = 189, 750]
Calculations for Cash Disbursement
Expected Flow of Cash
The expected flow of cash is referred to as the future flow of cash expected by a company from a starting project. This reveals the overall cash going out and coming in a firm associated with the project (Bragg, 2021). The incoming funds are low compared to outgoing funds in May and April. However, the funds coming in, in June in more compared to money going out. Therefore, it is suggested that cash outflow is controlled so that balance can be maintained between cash flowing out to cash flowing in a project. This is important because it enables to control of the overall cost of the project.
Conclusion
A budget needs to be a more living document meaning that it ought to encompass all current events and be regularly updated. From the budget, I can recommend various suggestions. Examining the master budget, it is possible to plan and design the budget of sales. This comprises of cost of administration, staff requirements, and procurement. As the accountant, one can identify the level of demand and rate of manufacturing with the assistance of production division, advertising, and collection of cash from sales has been excellent. Therefore, from the budget, the organization is capable of increasing the rate of production, thus hiring more subcontractors.
Additionally, the statement on cash flow helps an organization in planning and management of the flow of cash. Also, it helps to examine funds and allows people to understand when expenses are due. Overlooking the flow of cash and only focusing on profits is a fault made by many firms. Using the master budget, the account will be in a position to perform variance analysis. Also, this information helps in analyzing where there were differences in projections from the real performance. Therefore, this helps the management team in reviewing the information and using it to examine where there needs advancement and the interventions that can be pursued.
References
Bragg, S. (2021). Cash collection cycle definition — Accounting tools. Web.
Kausalya, M. P. R., & Bist, B. (2017). A Study on capital budgeting with reference to Signware technologies. International Journal of Pure and Applied Mathematics, 116(18), 71-75. Web.
Oyebode, O. J. (2018). Budget and budgetary control: A pragmatic approach to the Nigerian infrastructure dilemma. World Journal of Research and Review (WJRR). Budget and Budgetary Control: A Pragmatic Approach to the Nigerian Infrastructure Dilemma, 7(3), 1-8. Web.