Executive Summary
Beijing Enterprises Holdings Limited (BEHL) is an investment holding firm that holds a portfolio of diversified businesses. The primary business of the company is the distribution and sale of piped natural gas in China. The natural gas business comprises 54% of the total revenue for BEHL in FY2011. Other businesses of the company include a brewery, construction of sewage treatment plants, consultancy services in water supply, and construction of roads. The company is Head Quartered in Hong Kong and is listed on Hong Kong Stock Exchange. BEHL is a subsidiary company of Beijing Enterprises Group (BVI) Limited.
Recent earnings performance and analyst opinions rank BEHL among premium companies in the industry. The prospects are strengthened by BEHL’s large stake in China Gas, making it the biggest Gas supplier in China. Financial analysis for BEHL has been performed according to audited results of 2008-2011. Discussion of significant accounting policies indicates several risk areas, but no major departure from generally accepted accounting principles is seen.
Significant Accounting Policies in Financial Statements for FY2011
Financial Statements for the year ending Dec 31 2011 have been prepared with consolidated results of the company’s core operations and its subsidiaries. A critical analysis of the significant accounting policies is discussed below:
Revenue Recognition
The recognition policy for services-based businesses is always looked at critically by auditors and analysts since it is usually difficult to ascertain when the services and risks have been fully transferred (Kokenge 2012). BEHL is using the percentage-of-completion method for recognizing revenue from service contracts which is one of the allowed methods under IFRS and HKFRS. For the company’s gas business, customers are billed once the gas is delivered for the month (BEHL 2011). A more prudent approach, in this case, would be to recognize revenues upon completion of the contract. In that case, Receivable Days for the company will increase. Revenue recognition for the sale of goods is usually less critical.
Depreciation
BEHL is using a straight-line method for charging depreciation of property, plant, and equipment. The risk associated with such policy is that companies tend to record less depreciation in earlier years whereas actual deterioration in value is more than that in later years (Parikh 2012).
Gain on Investments
BEHL recognizes short-term investments as available-for-sale through profit and loss. Gains and losses on the fair value of these investments are recognized in Income Statement. These gains tend to distort the actual income on Income Statement since the gains are non-cash (Schmidt 2004).
Provisions
The company recognizes provisions on probable bad debts and contingencies. BEHL has recognized HK$ 196 M of provisions in the year ending Dec 31, 2011. Provisions related to bad debts are made after the evaluation of collectability and aged analysis of accounts receivables. BEHL has reported absolute values of provisions in Notes to Financial Statements; however, the policy of calculating provisions on receivables is not disclosed. This is a risky area because there is significant management discretion. Provisions are often reported less than actual to improve profitability. On the other hand, they are sometimes increased to show decreased Profit before tax, resulting in decreased tax payable (Bushman 2011). Ideally, the company should disclose provisions percentage and policy.
Impairment of Goodwill, Fixed Assets, and Inventory
Impairment is another area where there is the possibility of earnings distortion. Impairment on available-for-sale securities is usually fair since the changes in stock prices can be checked back. However, impairment in the value of inventory and assets holds significant management discretion. BEHL has charged HK$7.8 M under impairment in goodwill. This impairment is based on the fair value of the operating unit. Estimating cash flows and discount rates offer significant room for discretion. A more prudent approach could be valuation by a third-party evaluator.
Financial Strengths and Weaknesses
Key figures and ratios and corresponding analysis for BEHL for the four years 2008-2011 are presented below:
Sales
Revenue from the Gas business comprised 54% of total revenues in 2011, and the brewery business comprised 43%. The gas business has witnessed a growth of 16.58% and the brewery witnessed growth in revenues of 26.81%. BEHL has maintained gross margins, operating margins, and net margins without any significant decrease over the last 4 years. This is an indication of the company’s better cost controls and operational efficiency.
Turnover and Profitability: BEHL has maintained its turnover and profitability ratios within a consistent range over the past four years. However, BEHL seems to be underperforming slightly compared to industry averages.Table1: Industry Averages, Jan 2012
Comparison with industry averages shows that BEHL has underperformed slightly. Reasons for this could include competitive pricing pressures faced by BEHL in China as a result of pricing regulations, high costs, and conglomerate nature (CleanBiz 2012).
Coverage and Solvency: Current ratio and Interest coverage ratios are in an acceptable range. Interest coverage has decreased significantly in 2011. The reason for this is the increased use of short and long-term financing. The company used more debt in 2011 compared to previous years. A loan of HK$ 1b was availed for the acquisition of toll road (Mock, 2011). Later in 2011, the company sold bonds worth 500 million Yuan (Evans, 2011).
Table 2: Long term Debt and CPLTD.
The above table shows how the debt has increased resulting in increased finance cost and decreased coverage.
Leverage: BEHL has maintained its leverage in an acceptable range despite the increase in leverage due to the use of additional debt in 2011. Still, BEHL’s leverage ratios are better than industry averages (refer to Table 1 above). BEHL’s D/E ratio was 44.66% on Dec 31, 2011, compared to an average of 57.46% in the gas sector. With leverage, the securitized assets have also increased (Nicholas 2011).
Activity: Operating cycle is the most alarming area for BEHL in 2011. Although Receivable Days have been maintained at 32, Inventory Days have increased sharply. On the other hand, Payable Days have decreased, bringing the cash cycle for BEHL to 84 on Dec 31, 2011, from 16 on Dec 31, 2010. This indicates that the company has not been able to manage working capital efficiently during the year.
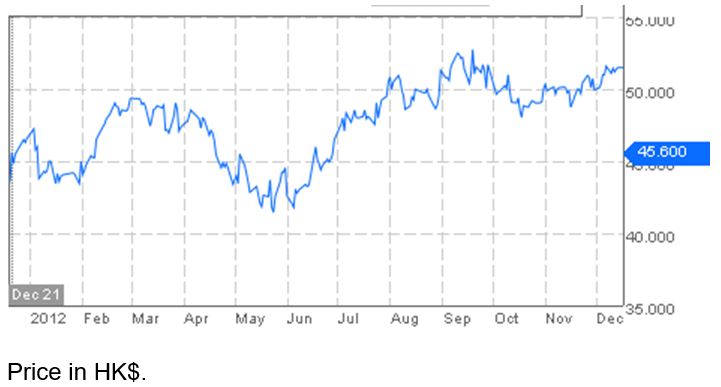
Market Perception and Analyst Opinions: BEHL is considered a red chip company in HK and China in the conglomerate sector. It has efficiently diversified its business risk. Analyst opinions generally indicate a buy rating for the company. Recently, BEHL bought additional shares of China Gas, increasing its market share in the gas sector (Aibing 2012).
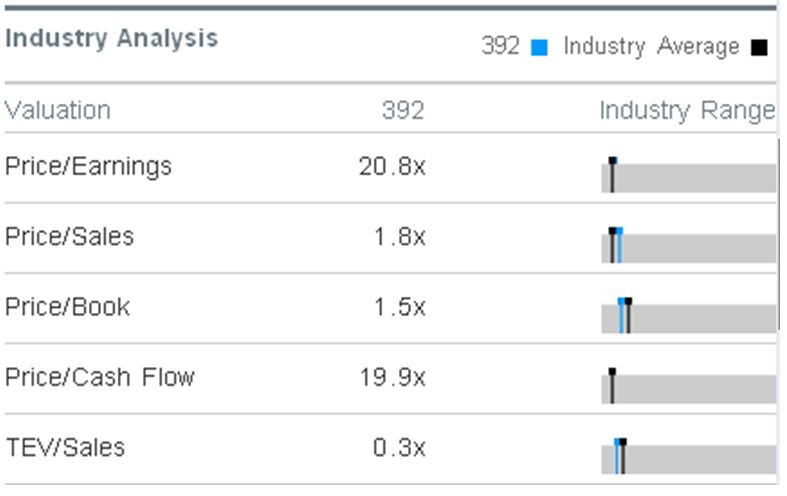
Key valuation ratios for the company are shown below along with the industry averages. P/E is almost at par with the industry average, which means that analysts expect the stock to perform by the market. The stock is neither overvalued nor undervalued at present. (Travlos 2012).
The price Sales ratio on the other hand is higher for BEHL than the industry average making it less attractive for investment compared to its peers (Green 2012). A Higher P/S ratio means that the stock is slightly overvalued. The price to book ratio is lower than the industry average. This again reflects that stock is less attractive for investment compared to its peers.
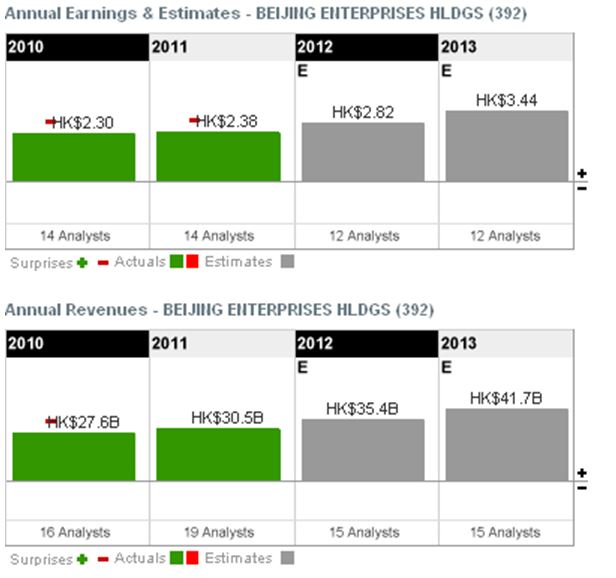
Earnings Forecast
Earnings forecast for BEHL is generally positive. Analysts have projected EPS of the company to reach HK$ 2.82 in 2012 and HK$ 3.44 in 2013. The projection for 2012 is mainly backed by half-year and quarterly results for 2012. Revenues are expected to reach HK$ 35.4b and HK$ 41.7b in 2012 and 2013 respectively.
References
Aibing, G. 2012. Beijing Enterprises Group Buys More Shares in China Gas. Web.
BEHL. 2011. Annual Report 2011. Web.
Bushman, R.M. 2011. Accounting Discretion, Loan Loss Provisioning and Discipline of Bank’s Risk-Taking. Web.
CleanBiz Asia. 2012. China getting started on its dash for gas. Web.
Evans, R. 2011. Beijing Enterprises Sells 500 Million Yuan bonds, Terms Say. Web.
Green, R.V. 2012. Price Earnings Ratio vs Price Sales Ratio. Web.
Kokenge, C. 2012. Revenue Recognition. Web.
Mock, W. 2011. Beijing Enterprises Said to Seek at least HK$ 1 Billion Loan. Web.
Nicholas, K 2011. Beijing Enterprises Said to Seek Pledges for DBS-Arranged Loan. Web.
Parikh, Y. 2012. Straight Line Depreciation Method. Web.
Schmidt, M. 2004. The Meaning of EBIT. Web.
Travlos, D. 2012. Why is Apple’s P/E so Low?. Web.