Introduction
Demand can be defined as a schedule that shows various quantities that consumers are willing and able to buy at a given time, other factors being constant.
Below is a schedule of demand and a corresponding demand curve.
The Law of Demand
The law states that ‘if the price goes up the quantity of goods demanded goes down, and if price decreases, the quantity of goods demanded goes up. As it is evident from the chart below, an inverse relationship is represented by downward sloping curve from left to right. Downward sloping is due to the diminishing marginal utility of the commodities.
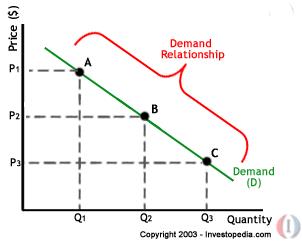
A, B and C are points on the demand curve. At point A, the quantity demanded will be Q1 and the price will be P1, and so on. The demand relationship curve illustrates the negative relationship between price and quantity demanded. The higher the price of a good the lower the quantity demanded (A), and the lower the price, the more the good will be in demand (C).
Change in quantity demanded
When the price of a commodity changes, the demand for that commodity will not change but it is the quantity of the commodity demanded that will change. The change is a movement along the same demand curve. An illustration is shown in the chart below:
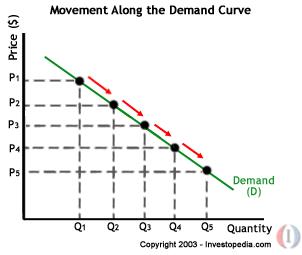
When the price of the commodity changes from P3 to P4, the quantity of the commodity will change from Q3 to Q4. It can be realized that this change has not affected the demand schedule or the demand curve.
Shifts in demand curve
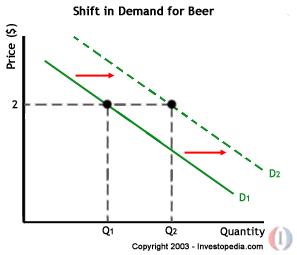
The demand curve will shift to the right when there is an increase in demand. This means that the quantities will increase for the same prices.
For instance, if the price for a bottle of beer was $2 and the quantity of beer demanded increased from Q1 to Q2, then there would be a shift in the demand for beer. For a decrease in demand the curve will shift to the left. This means the arrows in the chart below will point to the left. Changes in demand are normally caused by non-price determinants of demand. Some of the non-price determinants of demand include; expected price, price of other goods, income, number of potential consumers, and tastes and preferences.
Demand for convenience foods
several convenience foods are available in the market today. They range from fresh fruit juices, nuts, canned meat, milk, candy, beverages and many more. Due to the changing lifestyles, people tend to look for ways in which they can save time to do other productive activities. For instance, time will greatly be reduced by foregoing to cook and opt for a convenience food that is ready to eat. Some foods also take a very shorter time to cook and are easy to cook at the same time. There is an intense campaign by food manufacturing companies to advertise their products in the media especially through television and other electronic media. This creates awareness to people about the variety of convenient foods available in the market. Various food manufacturing companies are coming up with innovative ways of manufacturing food. An example is where they are manufacturing food with low fat and sugar and/or sugar. These are meant to ensure people consume food that is good for their health. All the factors mentioned above will increase the consumption of convenience food that increasing the demand. A graphical illustration is shown below. Given the factors above, consumers will tend to buy more of the food at the same price. The demand curve will shift from D1 to D2.
Demand for products purchased on the internet
The internet is being widely used throughout the world in many transactions. It is applied all sectors of the economy and used in almost all business transactions.
The market for internet shopping is huge and has the potential to grow rapidly. The demand for internet shopping is high and will continue to increase in the next coming years. The total online market in the year 2004 was estimated to be £6.3 billion. The demand increased in the following year and the total online market was £ 8.2 billion and 10.9 billion in 2005 and 2006 respectively. It is estimated that the demand for the net online market will keep on increasing and will reach the staggering amount of £14 billion and £17 billion in 2007 and 2008 respectively. Some factors that lead to shopping online include the convenience in doing transactions. One can do his shopping at the convenience of his office, home or even while traveling. He can also pay for the same transactions in any location. Purchasers also have a wider choice when buying through the internet. Just by one click, a wider option of products and their corresponding sellers is displayed giving the purchaser a choice to make. The person is able to select products with lower prices. In the recent years, Internet Service Providers have put in place security measures for online payment. These include giving shoppers a right to cancel their transactions within seven days with a full refund incase they are not satisfied with the products. The convenience and secure environment of the internet will increase the demand for goods purchased through the internet in the coming few years (Office of fair trading, n.d).
Demand for Fax Machines
Fax machines have been in use for quite some time, but the advance in technology has greatly affected its use. The advent of e-mail has made the use paper documentation useless. E-mail is paperless and thus reduces costs on stationary. Our culture’s demand has changed to more electronic and paperless formats rather than hard copy which enables greater control, more security and manageability of the documents are increased. Use of fax also increases costs due to its maintenance and manpower required. It will require people who will respond to the mails but in mail, one person can perform a task that could have been undertaken by a couple of guys. Fax machine is still used in various parts since 25 per cent of the world have no access to the internet yet but have the access to the fax machine. The demand of fax machine is decreasing and will continue to decrease in the near future.
A graphical representation of this is as shown in the chart below. The reduction in demand for fax machines will cause the demand curve to shift from right to left as indicated (China 3C Group, 2008).
Demand for Film and Cameras
The market for digital cameras is attaining its maturity phase, therefore the demand for film and cameras will decrease slowly in the coming years. The shrinkage of the digital camera market will start in the year 2011. There was a rise of 15 per cent in global shipments of digital cameras in 2006. There is a strong demand for the advanced models in emerging markets but the demand is expected to decrease 8 percent according to Economists. IDC have estimated a negative growth of digital cameras in 2011 after a complete saturation of all regions and markets. The DSLR market is controlled by Japan’s canon and Nikon with over 80 percent of World’s DSLR market. Sony is a major and leading player of digital market as well. The demand of the Worlds digital market will decrease due to the saturation of market in all regions (The Age, 2008).

Demand for video rented from retail outlets
An in-depth study on the market of Europe’s rented video reveal that, the average rental price of a DVD in the year 2004 was € 3.26 and the total spending on DVD rental was € 2.1866 million. In the subsequent year the average rental price of a DVD decreased from € 3.26 to € 3.21 while the total spending on DVD rental increased to € 2.3353 million. In the year 2006 the average DVD rental price increased € 0.01 to € 3.22 and the total spending on DVD rental decreased to € 2.1504 million.
The demand for rented videos from retail outlets is deteriorating due to various factors. One of the factors is the internet. Through the online multimedia, one can have access to a wide selection of movies and other videos. There are also free pirated videos on the internet. These can be downloaded by any individual. Another factor that is affecting the demand for rented videos from retail outlets is that original videos can also be found at very affordable prices. Thus one can buy a video for his house instead of renting from a retail outlet. This in away is greatly reducing the demand for rented videos from retail outlets (IVF, 2007).
Demand for pay-per-view television programming
According to a journal titled Pandoras Box Shaking up the broadcasting Industry, terada and Kuzishima(2006), they indicate that there are three services that provide pay per view satellite broadcasting in Japan. WOWOW is one of the leading providers of pay per view TV programming which uses a broadcasting satellite. The future of the pay per view broadcasting services is not so good and is a bit harsh. In case of WOWOW the growth of satellite broadcasting service has slowed down. The numbers of registered subscribers have been decreasing in the past years. In the year 2004 there were 1.86 million customers registered. The figure came down in the following years. In 2005 the figure was 1.66 million and in 2006 the number of registered customers kept decreasing to 1.46 million. The demand of pay per view customers is expected to decrease in the next coming years to 1.26 million and 1.07 million in 2007 and 2008 respectively. The decreases of customers are due to various reasons. Major TV operators are making focused effort on providing consumers digital multi-channel services incorporating terrestrial digital broadcasting which is a new and appealing feature. They are also providing triple play service which includes telephone, broadband and broadcasting. The pay per view satellite broadcasters are unable to math the value added services given by the major TV operators. The demand for the pay per view TV programming is gradually decreasing (NRI, 2008).

Supply
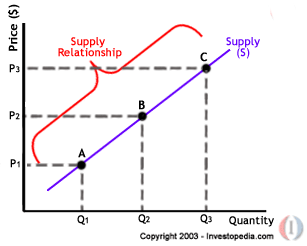
Supply is a schedule which shows various commodities that businesses are willing and are able to offer for sale at various prices, all other factors being constant. Supply in itself is the quantity that is available for sale, but it the schedule that indicates various prices and various quantities.
Supply schedule and curve
When the price of a commodity increases, the supply of that commodity also increases. This means that the slope of the supply curve is upward sloping from left to right.
The law of supply
The law of supply states that the price of a commodity is directly proportional to the quantity of that commodity supplied.
Below is a hypothetical supply curve.
Factors affecting the supply of Crude oil
The demand for crude oil and its products is on the rise. The same demand is set to increase in the coming years. The total Global sale of crude oil in the financial year 2002/2003 was 475 million liters. In the financial year 2003/2004, a 541million liter of crude oil was sold and in 2004/2005 the sales increased to 579 liters. However there is a limited supply of oil given the fact that crude is non-renewable source of energy. Global crude oil demand is expected to grow by about 1.3 million barrels per day in 2008. Due to the limited resources, the supply of crude oil is going to slow down in the coming years. Most counties are unable to harness other cheaper sources of energy. For instance solar energy is abundant but the costs involved in harnessing it are exorbitant. This makes crude oil to be heavily relied on. The consumer demand for crude oil is increasing every year. This makes supply of crude oil to reduce (PIRSA, 2008).
Factors affecting the supply of computer memory chips
DRAM is the most favorably used memory chip in both Laptops and Desktops. DRAM is manufactured largely buy Samsung. In 2004, the revenue for the company was $ 8,119 million and the following year’s revenue was $ 8,020 million. According to forecasts the sales of DRAM was expected to grow by 33 % this year. The supply of computer memory chips is expected to increase owing to an increase in its demand worldwide. The demand for memory chips is brought about by affordability of computers and laptops. Computers are used in every businesses and therefore their demand is high. The internet is also widely used. These factors make it necessary to increase the sales and supply of computer memory chips (Samsung-US, 1995-2008).
Factors affecting supply of Hotel rooms
A study carried out revealed that London is most visited city in the world. The study also concluded that 2000 extra rooms per day will be required between the year 2007 and 2016. London also successfully bid for the 2012 Olympic and Paralympics. This adds to its popularity. Economist’s analyzed that, 90 million international visitors spent one night in 2004, and the number of visitors increased to 155 million in 2026 which is a 72% growth. The number of hotel rooms available in 2004 is 98,421 and in 2005 is 10,0122, the number of rooms available in 2006 was 101,232. In 2008 the number of rooms that were expected to be available was 105,876. The number of rooms available is expected to rise in the coming years (London, n.d.)
Supply of fast food outlets in emerging markets
We shall take the case of Saizeria co. Ltd, in located in Saitama, Japan which is a chain of fast food restaurants. The annual report of the company is examined and the demand and supply is analyzed. In the year 2004, the number of restaurants were 666 and the total number of customers arrived was 106,525. The following year supply increased with the increase in demand. In 2005 the total number of customers was 106,856 with an increase in the number of outlets to 713 and the increase continued to 730 outlets in 2006 with a total number of customers to 111,561. The supply and demand are expected to increase in the following years due to various reasons. The use of fresh vegetables and Italian food which is loved worldwide increase the demand. Well balanced, serve well healthy meals at affordable price increases the number of customers which they can enjoy every day and the increase in number of stores regularly also attracts the customers. The supply will keep on rising in the future with the rise in demand (Saizeriya, 2007).

Supply of Credit cards issued by financial institutions
The market of credit cards is growing. The growth of credit cards is 30 – 40 % in India. Credit cards issued by ICICI bank was examined and found that, the total number of cards issued was 13.1 million, 17.5 million in the financial year 2005 and 2006 respectively. The number of cards to be issued this year in 2007 is expected to be 22.6 million. There is a constant growth of demand and supply of credit cards in India. Nowadays there is wider acceptance of cards by merchants and with more banks and foreign, public sector units coming in this market is more aggressive than ever. Main reason of rise in demand and supply are the innovative schemes and irresistible offers to the cardholders and various partner merchants with co-branded cards with added benefits on specific usage. However only 2% Indians carry cards till now, so the figures will rise in the future. Nowadays more customers prefer to make payments through credit cards rather than cash, moreover it’s easy to carry and safe to travel which makes it popular and the acceptance level is high. The interest level is also very nominal for the facilities and convenience provided by the credit cards. These factors will result in the rise of supply of credit cards in future (The HBL, July 2007).

Supply of laptop computers
The affordability of laptops have made it popular day by day and it’s the main reason for the rise in demand of laptops. To meet the high demands the supply has also increased. The annual sales of laptops in India are taken in to consideration in this case and conclusion is acquired. Laptop sales recorded a high growth of 97 %, with a rise of 41 % in the business segment. Affordability increased the sales in households. In the financial year 2004-05 total number of laptop sold was 177105 which increased in 2005-06 to 431834. This year in 2007 it is expected to reach a highest number of sales of 850860. On an average the cost of an entry level Laptop now ranges between RS 31000 to RS 40000 compared to last year’s range between RS 58000 to 80000. Some laptops now also cost around RS 10000 which is driving buyers to opt for Laptops. Government policies also helps in increase of sales, for instance government now allows duty free import of Laptops as baggage. Laptops have also amalgamated next generation technologies like Wi-Fi, Bluetooth, and Infrared with mobile computing which brings added utility to Laptops and attracts the youth as well. The demand of Laptops will increase in the future due to the factors discussed above and the supply will also increase to meet the demand.
Bibliography
U.S. International Trade Commission. Web.
Office of fair Trading, United Kingdom (2008). Web.
China 3C group (2008), The Kingdom of 3C Retail, China. Web.
The Age (2008), Australia. Web.
International Video Federation, Bruxells, Belgium. Web.
Nomura research Institute (2008). Web.
Department of Primary Industries and Resources. Government of South Australia (2008). Web.
Energy Information Administration, U.S Government.(n,d.). Web.
Samsung Electronics-U.S (1995-2008). Web.
London (n.d,),Planning and Development, Mayor of London, United Kingdom. Web.
Saizeriya Company Ltd. Japan (2007). Web.
The Hindu Business Line (2007), The Hindu group of Publications. Web.
www.investopedia.com
Questia On-line library (2008). Web.
Hubert D. H. (1922): Supply and Demand, Harcourt, Brace.