Introduction
Eastvaco Corporation Ltd. Being incorporated in 1899 as West Virginia Pulp and Paper Company is involved in the production of papers and paperboards in the United States. It is involved in the process of converting paper and paperboard into other several final products. Besides, it is involved in producing lumber, selling timber from its own land and it is involved in land development. The company runs several subsidiary companies across the world as one of its expansionary plans.
Some of the countries where the company runs some plants are Brazil and Czech Republic. Actually, we can say that the management of this company has utilized both vertical and horizontal marketing integration strategies effectively. Its operations are vertically integrated in the sense that it grows its own timber; it processes the timber into final products and does the marketing and distribution for itself. It is also horizontally integrated because it spreads its operations across several parts of the world hence minimizing the risks. One of the major objectives of this company is to maintain its strong financial position and strengthen its operations to realize highest profits possible (Camelia & Laura, 2002).
Case 1: Performance Measurement- The Balanced Scorecard
Two approaches are mainly preferred in measuring the performance of any business. Smart economists advocate that both financial measures and non- financial measures should be used to assess how the firm has been performing. However, some companies tend to ignore non-financial measurement that from economist’s point of view is equally important. The financial measures mostly used are, profit margins, mark-ups, Internal Rate of Return (IRR), Return on Equity (ROE) among others. Non- financial measures include customer satisfaction, production efficiency, environmental compliance etc.
The main link between companies’ actions towards its objectives and planning is the balanced scorecard. This is a very critical tool of monitoring the performance of a business (Kaplan & Norton, 2008). Any business entity relying on a balanced scorecard must incorporate non – financial measures in its performance. The balanced scorecard can be viewed in four different perspectives. These are financial, in-house business, client, education and development.
Financial Perspective
It is always important for managers to avail reliable, adequate and accurate financial data, which can be used to evaluate the performance of an organization (Kaplan and Norton 2008). Any financial information must be precise and whenever originality is required, it should be fully complied with. A slight error in any financial data will lead to wrong misinterpretation of results hence wrong final financial statements will be generated. Some of the financial measures that can be used by the Eastvaco are, Return on Assets (ROA) %. This is the key indicator of profitability. It is computed by net profit after taxes divided by net sales. A lower percentage of this is preferred.
Client/Customer Perspective
Almost all the businesses are driven by two major goals, profit maximization and customer satisfaction. The customer is an important aspect in any business activity since without him there would be no production. Eastvaco should aim towards producing high quality products to satisfy the needs of the existing customers and retain them as well as attracting new customers. This must happen indeed, if this company needs to get large market share in the market bearing in mind this is an international company.
In-House Business
This perspective emphasizes on production processes taking place in the company. Here two measures of performance can be applied, suppliers retention and process improvement. The management of Eastvaco company should be as efficiency as possible. In this case, the company will gain the supplier’s confidence since suppliers of materials are not interested in entering business deals with companies whose futures are uncertain (Camelia & Laura, 2002). In addition, the production processes should be more efficient to offer high quality products.
Education and Development
This perspective focuses on growth and improvement of the quality of personnel Eastvaco can achieve this through provision of training programs and facilities within the company in order to improve the personnel quality.
Case 2: Controlling Cost and Financial Measures
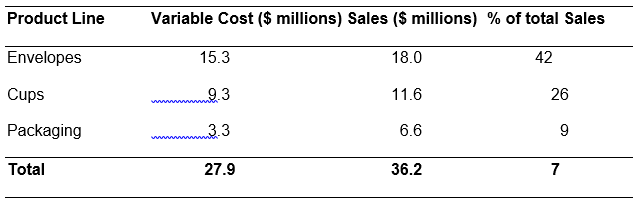
As earlier stated both financial and non-financial measures are important while measuring the performance of an organization as well as controlling costs. In the case of Charlotte plant there are three products in question which are made both from recycled materials. Since there is a heated debate amongst the three managers, some measures of non- financial measurement of performance such as customer satisfaction should be taken into consideration by looking at the demand side.
Historical records and market survey should show which product among the cups, envelopes and packaging materials seems to be having high demand and focus the production on it due to shortage of raw materials. Production efficiency of every product should also be taken into consideration and the only product, which seems to be effectively produced, should be considered. These two will help bring the costs of the company to a bearable level.
In the event that the manager of Charlotte relies purely on financial measures, the results would not give the true picture of the company. Secondly, the company might not be in a position to control costs since financial measures alone are not adequate and cannot be relied on.
Case 3: Variance Analysis
Variance is the difference between a budgeted, anticipated outcome and the actual outcome realized from a process. Variance analysis is a budgetary tool control used to analyze the difference between the standard and actual costs. In the case of Charlotte Company, four different variances were observed.
Material Price Variance (MPV)
It occurs when there is a disparity between the actual cost of the material and the budgeted cost. Since the Charlotte, plant shows that their variance was favorable; it is a clear indication that the cost incurred while purchasing the raw material was less than the anticipated cost. This might have happened because the company was given quantity discount or there was a reduction in material prices during the time of purchase.
Material Quantity Variance (MQV)
It occurs when there is a disparity between the actual material that was used and the budgeted material quantity at standard cost. The variable seems to be unfavorable in Charlotte’s plant meaning that the material that was used was more than what was anticipated. This might be because of misappropriation of the units needed or wastage of some material during production.
Labor Rate Variance (LRV)
This is the difference between what the actual number of hours worked did cost and what it should have cost. Again this is unfavorable in Charlotte’s plant a clear indication that the actual cost of the hours worked was higher than that was anticipated. The reasons behind this might be extra payment for overtime to finish the work in time, or overpayment of laborers.
Labor Efficiency Variance (LEV)
It is the difference between how many hours were worked for the number of units actually produced and how many hours should have been worked valued at the standard rate per hour. This can be due to improvement of labor efficiency or adoption of laborsaving machines.
Scrap materials: They decreased because high quality materials were purchased or improvement of production efficiency. This could lead to favorable Material Quantity Variance because the actual quantity of material used was less than the budgeted one.
Return Orders: This might have been due to production of mediocre products or emergency of anew competitor in the industry offering similar goods. This is an indication of unfavorable Labor Efficiency Variance
Rework time: It decreased because of adoption of high labor saving machines or product quality. The obvious outcome for this is favorable Labor Efficiency Variance
Average Unit cost: The increase was due to poor production techniques, inexperienced personnel handling the production machines or even poor raw materials used. This led to unfavorable Labor Efficiency Variance and Material Quantity Variance.
Unexpected downtime: The reason for the increase was as a result of incompetent and poor labor provided by workers. This led to unfavorable Labor Efficiency Variance
Sales: They were less than budgeted because of reduction in demand of the final product due to poor quality. This might have been due to unfavorable labor Efficiency.
Volume related revenue: This was less than anticipated because of reduction in sales that could have been because of poor quality goods. This was due to unfavorable Labor Efficiency in other related products of the company.
Case 4: Costing, Budgeting and Internal Reporting
Variable Cost schedule
Contribution margin (CM) = Sales- Variable Sales; CM weight = % of sales/ 100
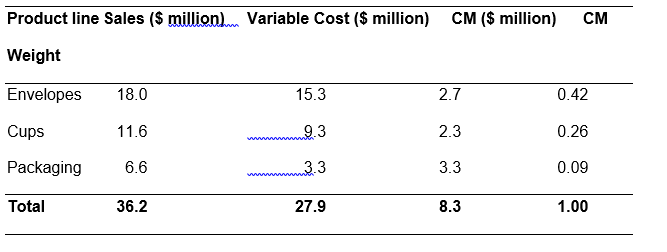
WACM = CMe.We + CMc.Wc + CMp.Wp = (2.7 X0.42) +(2.3X0.26)+(3.3X0.09) =1.134 + 0.598 + 0.297 = $2.02 million
Breakeven for 2007 = Fixed Cost divided by P/V ratio
$ 6.5 million/$8.3 million * $36.2 million = $28.3 million
How the company profits would increase after increase in revenue
New total sales = (19 + 13 + 8) $40 million dollars,
Variable Costs are 77% of sales
Variable costs = 0.77*40 = $30.8 million.
Contribution margin = 40-30.8 = $9.2 million
Marginal CM = $ 0.9 (9.2-8.3) million
Marginal Fixed Cost = $0.2 (3.8-3.6) million
Incremental profits = 0.9-0.2 = $ 0.7 million
Other ways of allocating fixed manufacturing costs
Besides absorption-costing (product costing) used in the above there is another way of allocating fixed manufacturing costs. The method is called marginal costing.
Case 5 Investment Decisions
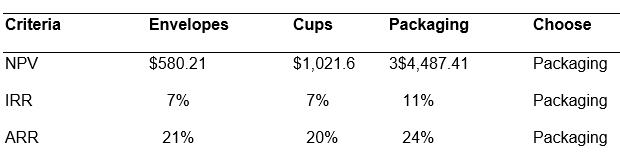
While making investment decisions, certain criterion is adopted while analyzing projects that are mutually exclusive. Some of these methods are Payback Period (PB), Accounting Rate of Return (ARR), Net Present Value (NPV) and Internal Rate of Return (IRR). Usually, the projects with the highest ARR, NPV and IRR are most preferred. The project with the shortest PBP is chosen since it can payback itself the earliest (Kaplan and Norton 2008).
PBP calculations= Envelopes 5 yrs+500/8300, Cups=4yrs+1700/4300, Packaging=3yrs+1200/6200
The packaging materials would be preferred since the envelopes have short payback period
NB: see the above calculations from the excel sheet attached.
While comparing more than two projects that are mutually exclusive, usually the one with the highest NPV is accepted. In this case, the packaging has the highest NPV. The IRR requires that the present value of the cash inflows equal the present value of its outflows. If IRR exceeds the cost of capital the project is worthwhile. But since the IRR for all projects is higher than 6 percentage which is the cost of capital, the packaging is accepted since it has the highest IRR.
Again, the packaging has the shortest PBP and therefore it will take the company shortest time to recover the capital invested. ARR estimates the accounting rate of return that the project should yield. More often, a target rate of return is taken and if the projects exceed this rate then it is acceptable. But in this case the packaging has the highest ARR so it is the most appropriate.
Case 6: Company Comparison and Evaluation
Company comparison and evaluation can be better approached using financial ratio analysis. Ratio analysis to financial statements is used by the businesses to evaluate the performance, progress or failure in a business entity. Ratio analysis helps financial managers to compare the performance and financial situation of their business entities with other business entities in the same industry (Camelia and Laura 2002).
NB: see the above calculations from the above sheet attached.
From the above calculations, it is evident that Eastvaco is more liquid than MeadWestvaco. This is because it is Quick and Current ratios are the highest meaning it can cover its current liabilities with those current assets readily convertible into cash. However, MeadWestvaco seems to be having higher return on assets an indication that it is financial health and being well run.
Case 7: Organizational Structure and Inter-Company transfers
Charlotte plant is an investment center. This is because it has direct control over its own revenue, cost and investment funds. Besides, the plant has its own budget. The manager of the plant plans all the production and also facilitates the sales.
Advantages and disadvantages of a decentralized structure
Decentralized organization is the one in which decision making of the companies are spread along different levels in an organization instead of concentrating them on the top (Kaplan and Norton 2008). The bottom level and the subordinate staff are involved in the decision making of the affairs of the company. Some of the advantages of decentralized organizational structure are, transparency in the running of the organization, the final decision of the organization represents the entire members opinions and it allows much better performance evaluations as the responsibility and authority of managers is well known.
The disadvantages of this form of organizational structure are conflict of interests in decision making between the top-level staff and lower level staff and also the bottom level staff may not be competent enough to make certain strategic decisions.
The Charlotte plant should opt to buy the material from the Carolina at $ 120. This is because the Carolina Company has already decided to offer its product to the open market at this price and therefore it would be better to purchase it directly from the company under the principle of Inter- Company transfers. Another reason for this once this material has been subjected to the open market it might attract other extra costs like taxes hence becoming relatively expensive.
Case 8: Global Commerce
The information that should be contained in the report should be adequate for the report to be adopted. The target market should be researched thoroughly to see whether the newly produced goods would have ready markets. In addition, the president should give information regarding the availability of the needed raw materials so as to avoid production delays. In addition, to be included in the report is how easily supportive requirements for a factory can be accessed including water availability, electricity and transport means. The political and economic structure of Asia should be carefully looked into to see whether the new project could be well accommodated in its country.
The major company’s strength is strong liquidity, ability to make high sales volume, efficiency in production and strong asset base compared to other companies like MeadWestvaco. Its weaknesses are low return on assets, low return on net worth and low level of profitability, which is below that of average industry. If the report seems worth, then the company can go ahead with the proposed expansion.
References
Camelia, S. & Laura, P. (2008). Managerial communication. Romain Journals, 7172(23), 1-12.
Kaplan, S.R. & Norton, D.P. (2002).The balanced scorecard. New York, NY: Harvard Business School Press.