The main market structures that business can take place are four. Although, they are interrelated in some ways, the dynamics of trade in each is different (Albarran, 2009, p. 31). The main market structures taught in this course are perfect competition, oligopoly, monopolistic competition and monopoly.
Oligopoly market structure
An oligopoly market structure is defined as an imperfectly market with a handful of large dominant firms (Tucker, 2010, p. 227). The firms are characterized by having a small number of sellers besides having homogenous or differentiated products. In addition, many entry barriers to the market for new firm in this market are a characteristic (Tucker, 2010, p. 227). Comparatively, oligopolies present an easiest structure that enables the few firms available on the market to form collusions. This is difficult under perfect competitions. Furthermore, oligopolies are practical market structures unlike perfect competitions, which approximate the real market world. Lastly, as compared to other market structures, particularly perfect competitions and monopolistic structures, many barriers hamper entry to this market (Tucker, 2010, p. 227). Examples in Australia include brewery and petroleum industries.
Monopolistic market structure
Monopolistic market structure is another example of an imperfect completion. It is defined as a market structure with many firms offering products that are close substitutes (Gitman & McDaniel, 2008, p. 25). In comparison to perfect markets, monopolistic competitions have a high product differentiation. Besides, there easy entry and exit to this market. Additionally, firms and industries operating under monopolistic competitions have a relatively higher control over prices than in perfect markets (Gitman & McDaniel, 2008, p. 25). An Australian example is the Felt and Textiles, Ltd. Found in Melbourne.
Monopoly market structures
Single seller, unique products and impossible entry to the market characterize monopoly market structures. This compares with perfect competitions such that they hardly exist in a real world. In addition, there are no products, which are close substitutes in monopoly market structures. With respect to prices, buyers get product prices dictated by the seller (Tucker, 2010, p. 241). Monopolies can be created if a firm owns a vitally important resource thus preventing others admirers from accessing the resource. Other firms are prevented from entering the market of a monopoly. The second way relates to legal barriers granted by a government. An Australian example is the Australian Metropolitan Gas CO, Melbourne.
Perfect competitions
Perfect competitions are market structures that have many firms selling homogenous products. It is reported that firms in such a market structure firms are small. One firm, as compared to monopolies, cannot influence Price fluctuations. In addition, the market structure has few restrictions to the entry or exit to the market (Tucker, 2010, p. 213). Because of the conditions of operation, firms operating in a perfect competition are price takers (Tucker, 2010, p. 213). In Australia, Barossa Range Mining Company stands as an example.
Cyclone Yasi’s short run impact
Considering that the market for the bananas is perfectly competitive, and that the market has a fixed number of players, Cyclone Yasi’s entry to the market is expected to influence price to a small extend. If the fact there is a 13.8% spike in the prices of fresh produce because of entry of cyclone Yasi and Flooding in some parts of Australia, then the supply is strained. However, other competitors in this perfect market need to remain profitable by selling more units of bananas. Let us consider the supply and demand curves for the market before cyclone Yasi. This curves are drawn on the assumption of cyclone was drawn to the market as a result the price spike. In addition, an assumption is taken that Woolsworth represents the overall response of the industry to prices because of cyclone Yasi. Figure 1 below shows the equilibrium.
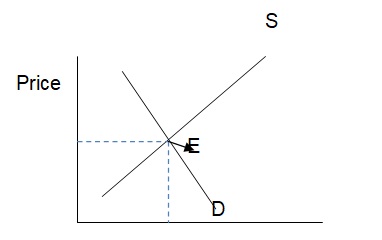
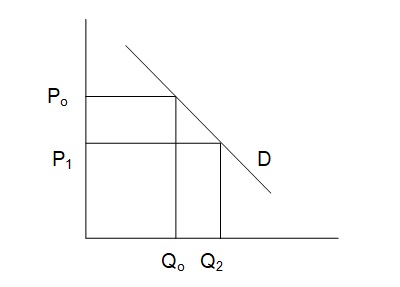
In the figure above, E represents the equilibrium price and demand before the at 38% spike. At present, Woolsworth management has realized that the supply of bananas is limited but competition is high. To sell more of the bananas as opposed to cyclone and other possible competitors. As mentioned earlier, Woolsworth represents old players to the perfect banana market. Nevertheless, the cut in prices is not the overall representation of the whole market, as done by Woolsworth (Baumol & Blinder, 2011, p. 200). Let us consider changes in the equilibrium because of response to cut in prices by Woolsworth. Before looking at the changes in the equilibrium, we have to put in mind that there may be little or no changes in the overall prices offered by the market. The implication is that the short run effect of cyclone to the prices may be insignificant to the overall market price trends. To substantiate this allegation, we have to tag a presumption on bananas that they are a necessity as a foodstuff (Mankiw, 2011, p. 90). Figure 2 below shows the shift in equilibrium as a response of Woolsworth to cyclone Yasi.
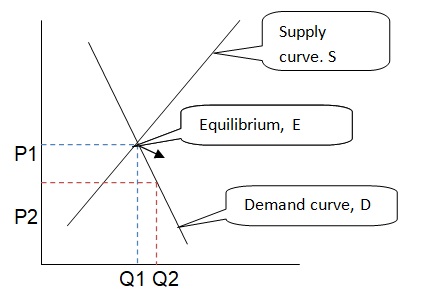
The figure shows that if prices drop to P2, the quantity supplied also shifts to Q2 in response. The tactic here is that each supermarket will strive to keep its customer base by lowering the prices, while making sure that it is profitable. In the short run, Woolsworth is expected to sell more at the lowered prices. This does not imply that Cyclone will exit the market in the short run. The reason is that in the perfect banana market, customers may be indifferent to the price changes. Remember that we assumed bananas to be a necessity to consumers. Besides, the supply of bananas is low due to floods in Victoria and Queensland. Price wars are expected to be intense for competitors in close proximity to one another. Despite the presence of any price wars, of these price wars, no supermarket shall command market power (Boyes &Melvin, 2010, p. 537). The overall impact on Cyclone Yasi on the equilibrium depends on the business model they decide to come up with as new entrants. If they play their game intelligently, the consumers of bananas will benefit from reduced prices.
Surplus
Surplus of bananas is characterized in two ways: producer surplus and consumer surplus. Producer surplus in our case is limited to the availability of bananas due to floods that hit Victoria and Queensland. In the figure below, an illustration is given of the producer and the consumer surpluses.
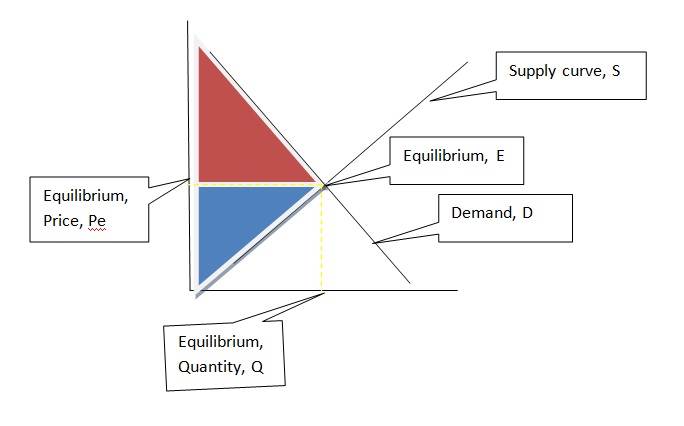
The blue triangle represents the producer surplus of the bananas in the given perfect market. The surplus of bananas that the consumer will enjoy most is represented by the red triangle. The figure implies that anything consumed above the equilibrium price is the consumer surplus.
Long run impacts
This presents a market entry due to attractive banana prices. Initially, the prices of bananas are high because of reduced supply from producers due to flooding in some important banana-producing regions. Consider figure 4 below.
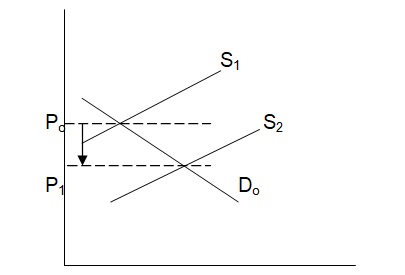
Before the entry of Cyclone Yasi to the banana market, the prices had spiked by 13.8%. Supermarkets that were main players to the market were selling at an equilibrium price Po. This equilibrium level enabled them to make substantial profits. The entry of cyclone Yasi to the market has an impact of causing an increase in the supply of bananas to the market (Carbaugh, 2010, p. 103). This increase is followed by an inevitable fall in prices of bananas. Consequently, the new equilibrium price shifts from Po to P1. At the new equilibrium, more bananas will be demanded because the prices are low. In the long run, the market will not sustain all the players in the banana business. This shall have an effect of some Supermarkets exiting from banana business. In addition, other firms will continue to enter the market while other s exit. This pattern is stimulated by losses as opposed to profits because of lower prices of bananas. The sequence of entry and exit of Supermarkets from the market will continue until a new equilibrium in prices and demand is reached where new and old Supermarkets neither makes high profits nor abnormally low losses from the banana business(Wigham, 2001, p. 9).
Surplus in the long run
Supermarkets and consumers of will experience the highest surplus for the bananas in the market due to the entry of cyclone Yasi. If examined in two perspectives, Supermarkets will be exposed to lower long run cost of trading in bananas, thus stimulating the market to have a very high surplus. Despite the fact that the market is experiencing lower banana production due to flooding in some areas of Australia, both consumer and producer surpluses will be high(Mastrianna, 2009, p. 112).
Price elasticity of demand
Price elasticity of demand compares percentage variations in quantity demanded as a ration of percentage change in the prices. From the information provided, price elasticity will be,
ED= percentage change in quantity of bananas demanded
Percentage change in prices of bananas
ED = 40/70 = 0.57
Two firms operating in a perfectly competitive market dominate the grocery market.
Case1. No collusive agreement
There is expectation that each firm will determine prices individually. If the focus points at the two firms, while ignoring other smaller firms, there will be price wars. These wars will not command the overall market prices since each firm is a price taker in a perfectly competitive grocery market. Although, firm A and B command market dominance, other small firms are expected to adjust the prices such that they remain competitive on the grocery market. Considering the two dominant firms, the following situation is expected to occur. Diagrammatically, each firm shall adjust its own price and demand equilibrium as shown below.
The essence of each firm is to maintain a substantial number of customers for groceries. Each firm will effect Price reductions in order to command sales. Supposing the price that the market offers is Po as shown on the diagram, each firm will device a price reduction strategy that will enable it to make profits while trying to avoid loses. The new equilibrium price will be located at P1. This new equilibrium price will only be applicable to each firm according to its price strategy. In addition, the setting of P1 for each firm depends on the competitiveness of other small firms participating in the market. If the small firms are competitive enough as to pose a pricing challenge to the two dominant firms, then the P1 prices for each dominant firm will be insignificant in their difference. This is the situation when there is no collusive agreement between the two firms.
Surplus without collusive agreement
The two firms operate as dominant holders of the market but are not monopolies in their singular entities. Consequently, perfect competition will still characterize the market. Since there are two dominant firms, consumers of their products will enjoy surplus in this market structure. There will be some consumer welfare in that market as well.
With a collusive agreement
The collusive agreement of the two firms in this market will make them operate like monopolies. The smaller firms are disadvantaged in that there is a likelihood of the two dominant firms to dictate the prices of the grocery market. Collusion is meant to manipulate the prices of the market. If an agreement stands, then the two firms can operate under the agreed terms. The effect of the collusion agreement two firms on the equilibrium of demand and prices will be as explained below. In the first place, the agreement affects each firm in two ways. Firstly, each firm will trade at the agreed price. Secondly, the agreement will be binding so that no firm raises its groceries on the market. If there is no cheating in the collusive agreement, the diagram below indicates the equilibrium.
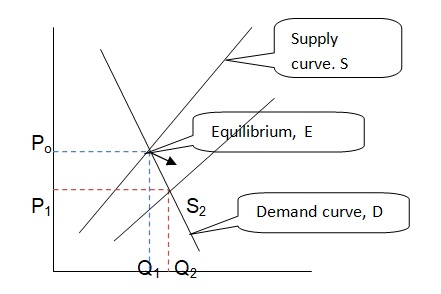
If we consider that the equilibrium was at E before the collusive agreement between two firms, Q1 will be the grocery quantity that the firms could offer to the market. The firms discover that their output remains at Q1 and equilibrium price Po. The output for this point is lower than each could offer to the market. An incentive for the two firms will be to lower their market prices to P1. The effect of doing this will be the two firms have an opportunity to supply an agreed upon quantity at a given price while making substantial profits at a point of equilibrium S2. There is a disadvantage however to such a collusive agreement. The disadvantage is that the agreement only holds when there is honesty between the two dominant firms. One firm may be disadvantaged if the other decides to increase its output or lower the prices. If such a case occurs, the dishonest firm raises it profit margin through the sale of many units of groceries on the market.
Surplus under collusive agreement
Under a collusive agreement, the customers and producers will enjoy an increased surplus and welfare. The agreed upon prices under a collusive agreement by the two firms will definitely be lower than the former equilibrium prices that were enjoyed by the customers before the agreement. Consequently, customers will have a higher surplus under this arrangement.
With repeated collusions
If collusions are to be repeated in future, it depends on the type and outcome of the first collusion between firm A and B. since the two firms are playing the same game of price setting and output control, cooperation in future will be influenced by the benefits of price setting for both firms. Repeated collusion is an opportunistic strategy for firms A and B to develop strategies that will counter the effects of either firm’s strategy to influence the equilibrium prices on the market. Strategies can develop in the market such that both firms A and B adopt similar strategies without consulting the strategies of the other. If the games of equilibrium price setting by the colluding firms become suspicious, cheating will become the behavior of either of the firms. Suspicions will occur until prices and strategies used by both firms are almost similar to settle Market Equilibrium Prices.
Repeated interactions also make the firms to establish reputations so that they can further be included in cooperation in future. The overall effect of repeated interactions of firm A and B will make it possible for prices to fluctuate between the equilibrium the market price and a price lower than the equilibrium. In the long run, customers will enjoy a surplus in the grocery market.
2008 ACCC grocery inquiry findings
The major findings relates to issues of protection of small retailers in the grocery business from main market holders. This was conducted with Coles and Woolsworth in sight. In the light of price setting, 2008 ACCC confirmed a major concern that small grocery sellers were facing a market duopoly of Coles and Woolsworth. This was to be prevented by policy intervention in grocery shopping and selling areas such as discriminatory shopping hours (Wanna, 2009, p. 91)
. Competition of small grocery retailers in the Australian market would be affected by freedom of major market holders to acquire extended grocery markets. In addition, price discrimination and discounting, although bad sounding to major players was a possible policy to making small retailers competitive.
The ACCC found out that competitiveness and reduction or regulation of grocery consumer prices were affected restrictive barriers to the entry. The barriers have significant impact to modern-format supermarkets to enter the grocery market. An additional finding revealed that large operators like Woolsworth and Coles do not have incentives for their full-strength price competition between themselves as well as the independent sector (Wanna, 2009, p. 9
Recommendations
The major recommendations provided included lessening of market entry barriers to the grocery market. This also included enlargement in retailing and whole-scale sellers in the independent sector of willing supermarkets and newcomers. Additionally, leasing of new sites for establishment of new grocery supermarkets should consider the potential of the interested retailer (Wanna, 2009, p. 90)
Giving an example of Woolworth’s interest to acquire a lease to establish another supermarket in Southern Australia, it was argued that competition would be lessened, no matter who worn the lease. To the new supermarkets, despite high competition from already established supermarkets, ACCC emphasizes on strategy to entry (Wanna, 2009, p. 90)
To show the importance of change of strategy, an example is given of Aldai. Despite the fact that Aldai is a small service provider to the grocery market, it managed to induce significant attention from Coles and Woolworth. The point is that entry to the grocery market depended on change of game-play by new comers as opposed to the strategies already put in place by major market holders. Such strategies are encouraging since they have a comparative advantage to consumers of groceries in Australia (Wanna, 2009, p. 91)
Reference list
Albarran, A.B. 2009. Management of Electronics Media. Mason: Cengage Learning.
Baumol, W.J & Blinder, A.S. 2011. Economics: Principles and Policy. Mason: Cengage Learning.
Boyes, W. & Melvin, M. 2010. Economics. Mason: Cengage Learning.
Carbaugh, J.R. 2010. Contemporary Economics: An Applications Approach. New York: M.E. Sharpe.
Gitman, L.J. & McDaniel, C. 2008. The Future of Business: The Essentials. Mason: Cengage Learning.
Mankiw, G. 2011. Principles of Microeconomics. Mason: Cengage Learning.
Mastrianna, V.F. (2009). Basic economics. Mason: Cengage Learning.
Turker, I.B. 2010. Microeconomics for today. Mason: Cengage Learning.
Wanna, J. 2009. Critical reflections on Australian Public Policy: selected essays. Canberra: ANU E Press.
Wigham, D. 2001. Managerial economics using Excel. Mason: Cengage Learning.