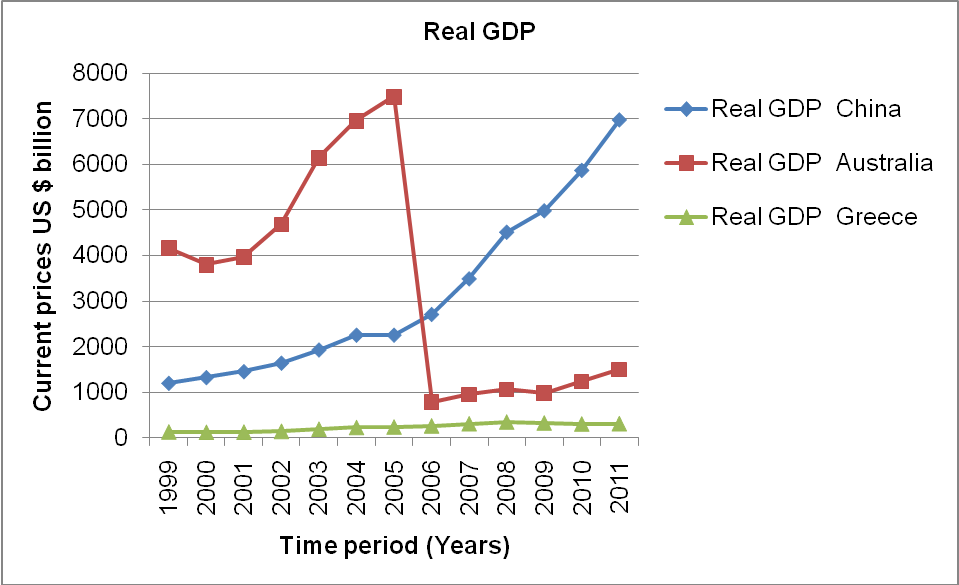
Gross Domestic Product (GDP) at the purchaser’s price is the gross value added by all citizen producers in a given economy added to product taxes fewer subsidies excluded in the value of the goods. This value is excluded depreciation to natural resources. In the figure above, China’s GDP has since witnessed a steady growth from its lowest levels of almost 1000 dollars in 1999 to a high of 7000 dollars in 2011.
For Greece, the real GDP is almost negative and has not changed over the review period of 1999-2011. However, Australia posses mixed results with a massive drop from its highest levels of over 7000 in 2004 to below 1000 level in 2005. From 2006, the country has experienced a renewed hope in the movement of its GDP but the speed of its growth is still not at its optimum levels compared to previous years.
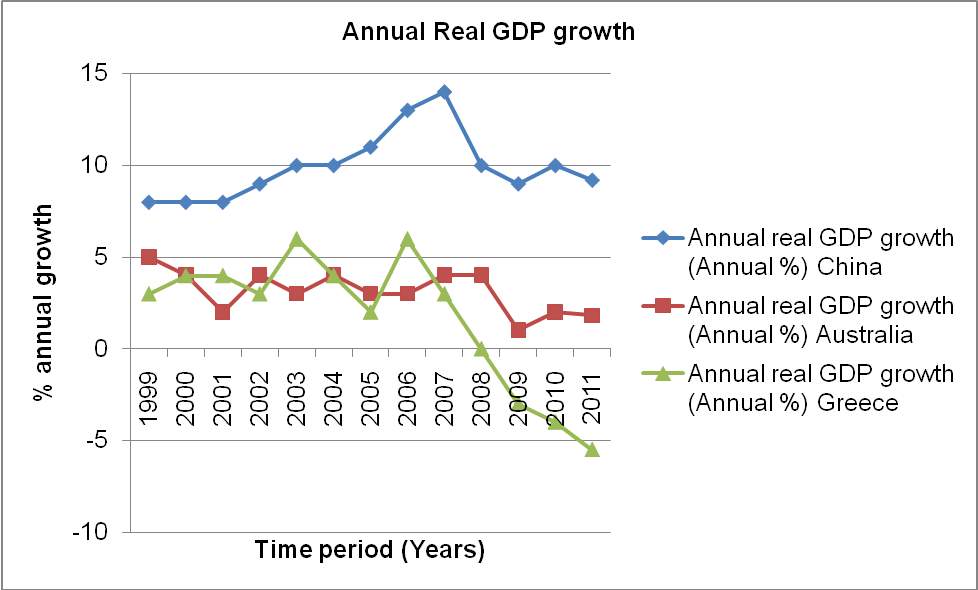
THE annual GDP in almost all three countries are on their downward trends. Greece has since recorded a steady negative economic growth from its highest of over 5 percent to lowest levels at below negative 5 percent. China, on the other hand, has also recorded a slight decrease as a result of the financial crisis of 2007-2008. But after the crisis, the economy is stabilizing again but still a sluggish trend is evident. Finally, Australia has managed to maintain its growth at a balanced level and even recorded a positive value between the 2007-2008 crisis periods. After 2008, the economy recorded a slight decline but is on the recovery trend.
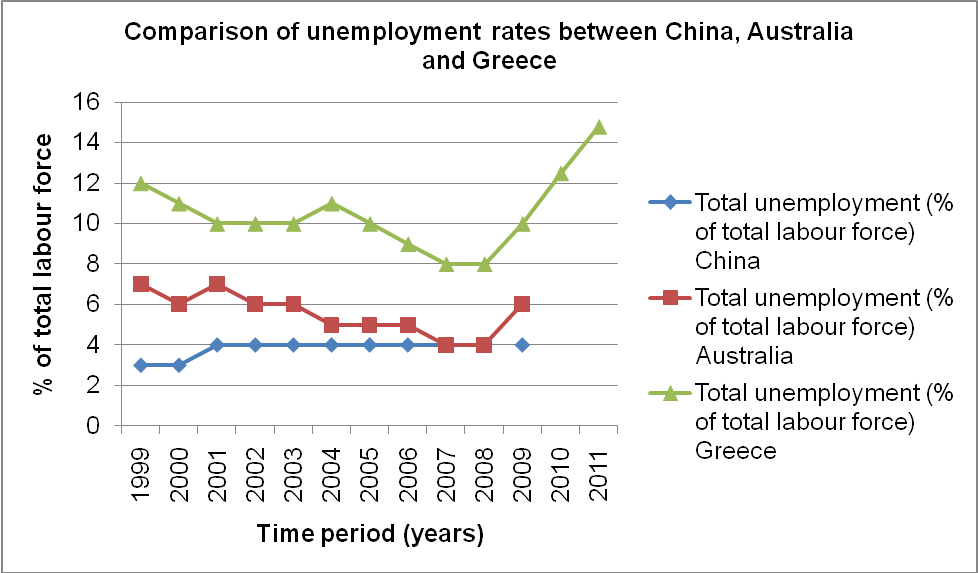
Unemployment is a state in which persons aged 16 years and above are not employed but are actively looking for employment. In Greece, the rate from 2008 levels has increased steadily from its low levels of 8 percent to almost fifteen percent. Australia on the other hand has witnessed a decrease in the unemployment levels but after the crisis, the level has since increased. It is only, China which has since maintained its employment levels from as early as 2001 to 2010 at 4 percent. Even during the crisis periods, the country was able to maintain a similar rise of 4 percent per annum. This might be attributed to the country’s industrialization strategies and stable manufacturing sector.
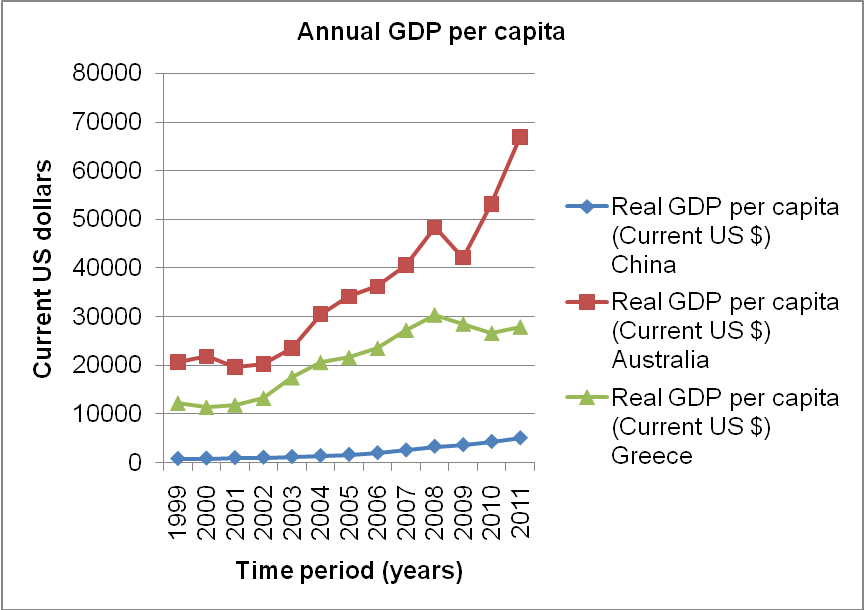
Annual GDP per capita measures a country’s GDP divided by its population size. Due to China’s 1 billion population, its annual GDP is the lowest of the three countries. However, the condition is improving partially due to its adoption of birth control mechanisms for the period under review. Both Greece and Australia recorded positive growth in annual GDP but during the financial and economic crisis, both of the countries recorded a decline in GDP per capita.
Australia, after the crisis, has since continued with its positive GDP per capita growth with a rise of over 3000 from 2009-2011. Greece on the other hand has since recorded a reduction in growth rate after the financial crisis of 2007-2008.
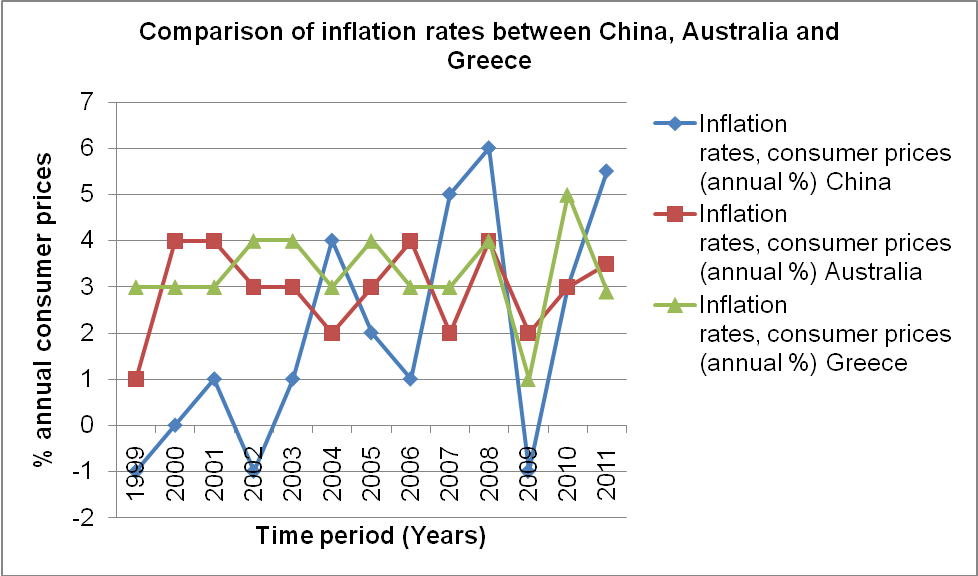
Inflation is a general increase in the prices of goods and services over a given period of time. Of the three countries, China recorded the most negative inflation rates between- 1999, 2002, and 2009. However, Greece and Australia both recorded positive figures during the said periods. Specifically, Greece has a wider negative variation especially during the crisis compared to Australia. Forecasting from 2010 levels and beyond, Australia levels have since increased. In conclusion, China is the most volatile of the three economies (China economic fact sheet 2010; Australia economic fact sheet 2010; Greece economic fact sheet 2010).
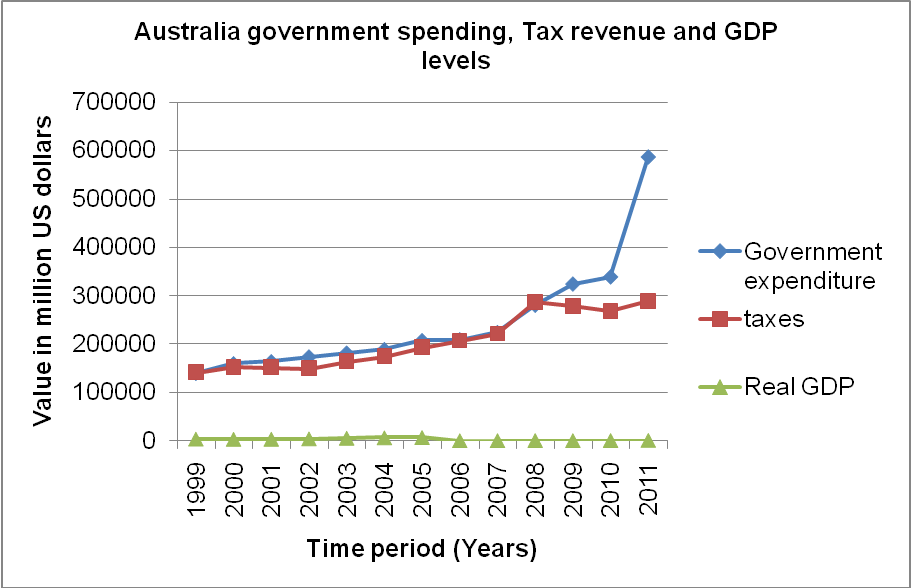
Most of the Australian expenditures are met with its local revenue collection. Interestingly, during the financial crisis of 2007-2008 periods, the country had equaled revenue collection to its expenditure levels but in 2009 the revenue base fell slightly off the target. This might be partly attributed to the effects of crisis which have negatively reduced the earning potential of its citizens. Secondly, the government investment in rebuilding homes for flood-affected victims and offering tax exemptions to the affected citizens with a taxable income of less than $ 50,000 has also contributed immensely to this condition (Australian government n.d.; Reserve Bank of Australia 2011).
However, from 2010 onwards, the country has witnessed a massive expenditure increment. The revenue has since stagnated at below 300,000 marks with exports recording a downward trend. The GDP levels remain at negligible levels compared to taxes and revenues (Australia government expenditure and taxes 2010).
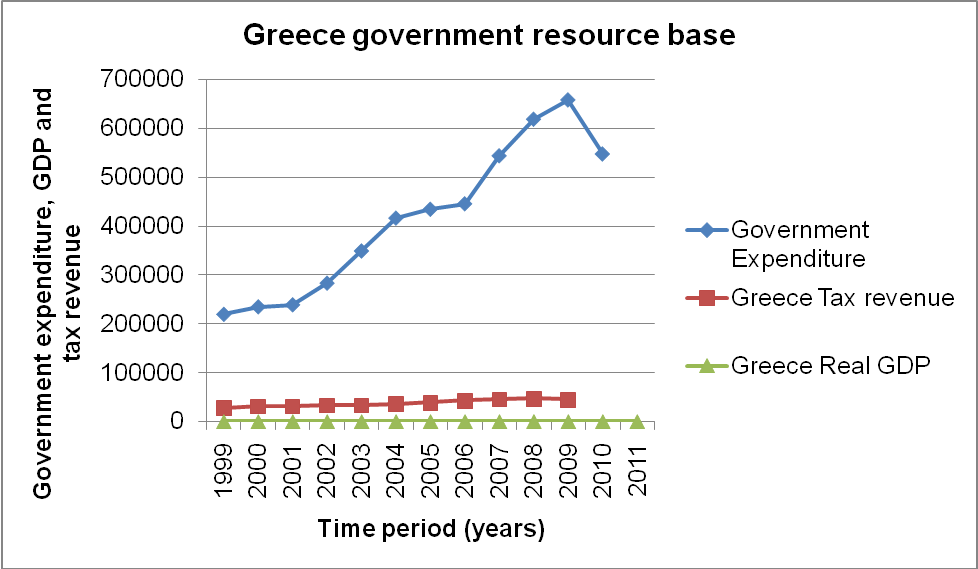
Greece’s government spending is in excess of its revenue collection levels. For instance, between the years 2005-2009, there was a steady increase in its expenditure levels but a meager increase in tax revenue collection. Therefore, the government had to rely on external funds like borrowings and bond issuance for sustenance. Specifically, Greece government sources its finance mainly from international markets to support its current account and budget deficits.
This international exposure has made this country to be vulnerable to foreign investments. To start with, the Greece crisis was mainly attributed to its low revenue collection guidelines and policies and the structural changes coupled with its deteriorating international competitiveness. Secondly, the country also suffered from external international factors necessitated by poor European policies added to its weak rules enforcement mechanisms which encourage more borrowings. To help move Greece out of crises, strict financial regulation and strict local revenue collection are very important.
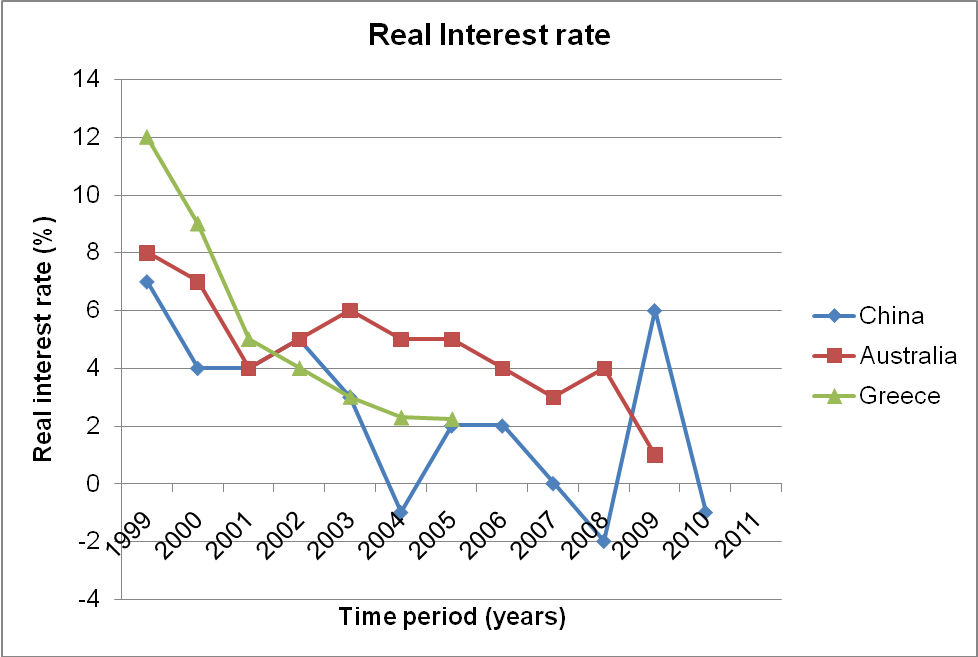
Real interest rate percent represents the lending rate corrected for inflation. In the figure above, most of these countries portray a similar downward trend in the real interest rate. For instance, between 1999 and 2001, all these countries had high positive interest rates of between 4 and 12 percent. From 2001-2002, Australia and China recorded a positive trend but Greece continued with its negative trends.
After 2003, only Australia recorded a steady positive interest rate growth with China recording a sharp decline in its interest rate which dropped to a negative value of 1.8 by mid-2004. During the financial crisis period of 2007-2008, Australia and China both recorded a decline. China’s interest rate dipped to its lowest levels of negative 2 percent but Australia was on the declining trend but with a positive figure. Nevertheless, as the economy stabilized, China recorded an improved trend to outweigh Australia with the highest interest rate of 6 percent. Therefore, it is clear to conclude that with these trends; more negative trends might be expected from these countries.
The global financial crisis first has increased the level of uncertainties in the planning process of these countries. These concerns over fiscal sustainability have increased the likelihood of corruption scandals thus slowing the rate of economic growth and development. Moreover, it has increased the persistency of risks like high debt levels and low growth especially amongst developed countries, high unemployment, and limited access to affordable finance by developing countries, and high food prices. Secondly, the global financial crisis usually lowers the level of investment from individual and corporate investors.
This is because investors are concerned about their investment returns and might opt for other avenues like gold; silver or bronze while others might opt for debt and equity markets of least developing countries as a safe investment avenue. Finally, the global financial crisis has complexed the dim future of the banking industry’s ability to raise enough capital to leverage their operational costs. In all three states, the global financial crisis has negatively influenced the growth of almost all the sectors with much of the effect being felt in Greece. These effects differ significantly because, first, these countries vary in resource endowment levels.
For instance, Greece’s economy depends wholly on the agricultural sector with much of its exports being skins and veterinary products compared to China’s and Australia’s minerals and a small percentage of agriculture. Secondly, the difference might be a result of poor policy initiatives proposed by an individual country which has lowered the investors’ confidence in these countries. For instance, Greece’s poor policies at the start of the 2007 crisis have resulted in lowering its short-term yields of sovereign debts.
The third cause is the low demand for most of the country’s exportable products. Specifically, countries depending wholly on the agricultural sector for its GDP growth were highly affected by the crisis. This might partly explain why Greece performed poorly during this time compared to China and Australia which depend on minerals and other products for GDP support. The fourth reason is the expansion of the manufacturing sector amongst East Asia countries.
This resulted in the stabilization of the East tiger economies thereby creating employment avenues for citizens. This increased their purchasing power. Finally, external factors like the uncertainties within the trading blocks of these countries also can partly explain the variability. Greece falls in the Eurozone which is characterized by poor lending policies which have facilitated the economic crisis thus affecting most of its members (World Bank report 2012).
AE diagrams (Aristotle-Euler diagram) – These diagrams represent 450 lines showing the relationship between macroeconomic variables. It helps explain the effect of a one percentage change in one variable and its effect on another. These diagrams are considered complete and yield valid conclusions. They thus represent a pictorial classic model for making conclusive inference on structures thereby supporting efficient judgment making between variables.
References
Reserve Bank of Australia. 2010. Statistical tables- Australia government expenditure and taxes. Web.
World Bank report. 2012. Country macroeconomic indicators. Web.
World Bank report. 2012. The financial crisis. Web.
Reserve Bank of Australia. 2011. Statement on monetary policy. Web.
Australian government: The treasury. n.d. Rebuilding after the floods. Web.
Australia economic fact sheet. 2010. Australia fact sheet. Web.
Greece economic fact sheet. 2010. Greece fact sheet. Web.
China economic fact sheet. 2010. China fact sheet. Web.
The Australian government. n.d. The treasury. Web.