Introduction
Water is one of the most important natural resources. Lives for plants and animals cannot go on when water is not available and this is the reason why some authors have written books and articles with the titles, “Water is Life”. Almost all lives on earth depend on water but what varies is the quantity of water needed to support different lives (Cosgrove, 2004). Even though water is a vital resource that supports lives, it is a scarce resource and its limited supply in most areas impacts negatively on the lives of many people. It is because of water scarcity that households in Western Australia are forced to pay both annual service charges and usage charges for water (Gans, King, Stonecash, & Mankiw, 2000).
Market structure
In Western Australia, Water Corporation is the only body charged with the responsibility of supplying water to the residents in rural areas and urban centers. This means that there is no other institution or company other than the Water Corporation that is legalized to collect and supply water in Western Australia. The Water Corporation uses surface water and groundwater as the two primary sources of water to supply water to the residents (NLWRA, 2001). The fact that the Water Corporation is the only major player in the provision of water and it uses natural sources of water creates a natural monopoly situation. Unfortunately, this natural monopoly situation is allowed to exist in Western Australia. When there is a monopoly in the market, the quality of goods or services offered to the market may be compromised because the producer has no competitors and thus the goods or services will have to be sold even with lower qualities. When there are other competitors in the market, every producer tries as much as possible to come up with high-quality products to remain relevant in the market and outdo other competitors. If competitors join the market for water provision in Western Australia, the water provision services will improve to a greater extent because every market player will be trying as much as possible to attract more customers.
Demand and supply
In normal business scenarios, business individuals usually supply more goods and services to the market when the demand for such goods and services increase. In other words, the supply for a commodity should increase with increase in demand of the commodity. However, there are some situations that are beyond the control of suppliers of commodities and one of such situations is the scarcity of water in Western Australia. The demand for water is higher than its availability throughout the world and therefore water is considered a scarce resource. The demand for water is increasing every year in Western Australia and water being a scarce resource, its supply is lower than the demand of the Australians.
Modern agricultural activities are some of the factors that have led to the increase in demand for water in Western Australia. For example, intensive agricultural irrigation consumes a lot of water in Australia. It was indicated that agriculture industry consumed the highest amount of water that was available in Australia between the year 2000 and the year 2001. The agriculture industry consumed about 16,660 trillion liters of water in Australia. The second highest consumers of water in Australia were households that used about 2,181 trillion liters of the available water. The third highest consumer of water were companies that offered water and sewerage services accounting for about 1,794 trillion liters of water and the next highest consumers were companies that used to supply gas and electricity consuming about 1,688 trillion liters of water (ABS, 2005). The demand for water has been increasing in Australia while its supply has been remaining constant and sometimes decreasing. The supply of water is low and the water demand in Australia is not satisfied because of the scarcity of water. The proportion of water usage by different industries in Australia between the periods of 2000-2001 can be represented in the chart below.
From the above chart chart, 67% of water was consumed by agriculture industry and it was the industry that consumed the highest amount of water supplied in Australia. Water supply and sewage industry consumed 8% of the available water. Households were the second highest consumers of the available water that accounted for about 9% of the total volume of water available for consumption. Companies that supplied gas and electricity consumed 7% of water that was available for consumption. The remaining 9% of the total water (represented by others in the chart) were shared by other industries that included manufacturing and mining industries (ABS, 2005).
Price and quantity
When the supply of a commodity is low and the demand for the commodity is high, the price for such a commodity will tend to rise. The demand for water in Australia is very high while the supply of water is low. This has led to increase in the price of water especially in Western Australia and even though the price for water has been increasing, its demand has always remained high. When the prices of goods increase, most customers tend to buy substitutes for the goods that may have lower prices. Unfortunately, there are no close substitutes for water and therefore even if the price per liter of water is increased the quantity demanded by individuals may not change to a greater extent (Brown, 2005). In Western Australia, the price of water has been increasing but the quantity of water has not been affected by the price increase. This means that people have been paying high prices for low quantities of water simply because there are no substitutes for water.
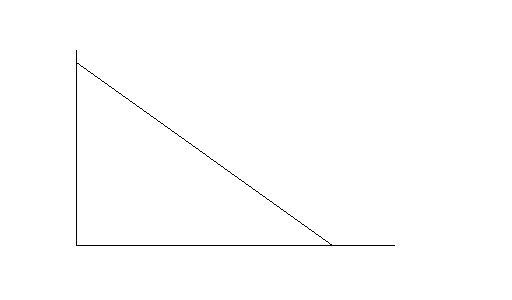
As a monopoly market structure, a production possibilities frontier (PPF) diagram can be drawn with a straight line. The slope of the straight line has an inverse relationship implying that if the quantity of one variable increases, the quantity of the dependent variable has to decrease. The diagram also represents demand/supply and price/quantity relationships that have been describe above with a non-price factor. This is represented below;
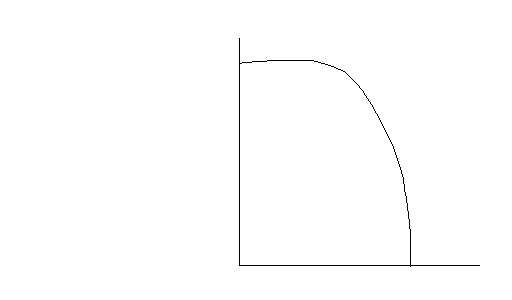
In 2056, the future PPF diagram would represent the rate at which production possibilities frontier curve shifts outward with economic growth, population growth and new technology. Such situation can simply be represented as;
Public and private good characteristics of water
Water supports life and therefore if there is no water, no life can exist on earth. Most international organizations recognize water as very important and that every person has the right to access safe water for drinking and domestic purposes. It is the responsibility of every government to ensure that the rights of its citizens are protected. Most governments around the world take the responsibilities of providing water to their citizens. Public authorities such as municipal councils and city councils are responsible for supplying water in urban centers (Cosgrove, 2004). Public authorities in Australia are responsible for funding the development of new water supply infrastructure, setting standards for water quality and collecting water tariffs and thus making water to be considered a public good. For example, most municipal water treatment plants are operated and maintained by public authorities that obtain funds from the public. In most countries, public authorities are responsible for water supply and thus water is considered a public good (Cosgrove, 2004). In addition, every person has a right to use water of acceptable quality without any discrimination.
Water is sometimes considered a private good when a private firm is contracted by a government to collect and sell water to citizens (Cosgrove, 2004). In such cases, water belongs to the firms that have been contracted to supply the water and any person who needs the water must buy it from the firms because it is considered a private good. Private firms are usually contracted to oversee the provision of safe water to citizens so as to improve the quality of services offered to the intended population. Most governments around the world have many responsibilities and they contract private firms to offer some services to the public with the view of improving service delivery to the public (Cosgrove, 2004).
Water in the year 2056
Currently water authorities in Australia are looking for new water sources and at the same time consumers are being advised to use water more wisely. It is expected that by the year 2056, water will be more expensive because the population of people in Australia is expected to increase and at the same time the water that will be needed for agricultural irrigation is expected to increase to a very great extent (ABS, 2005). These are some of the factors that will increase pressure on scarce water resources in Australia given the fact that Australia has very limited water resource base. The erratic weather conditions together with the negative effects of global warming are likely to reduce the amount of rainfall in Australia and all over the world and therefore resulting into reduction of available water. This will certainly make the available water in Australia to be more expensive in 2056 than it is now (ABS, 2005).
Reference list
ABS, (2005). Water Account for Australia, ABS Catalogue 4610. Canberra: Australian Bureau of Statistics.
Brown, J. (2005). Water Service Subsidies and the Poor: A Case Study of Greater Nelspruit Utility Company. Mbombela Municipality, South Africa. Web.
Cosgrove, W. (2004). Water for Growth and Security, is it a myth or reality? London: Taylor and Francis Publishers.
Gans, J., King, S., Stonecash, R. & Mankiw, N. (2000), Principles of Economics, Sydney: Harcourt.
NLWRA, (2001). Australian Water Resources Assessment 2000, Surface water and groundwater – availability and quality. Canberra: National Land and Water Resources Audit.