The Current State of the US Automotive Industry
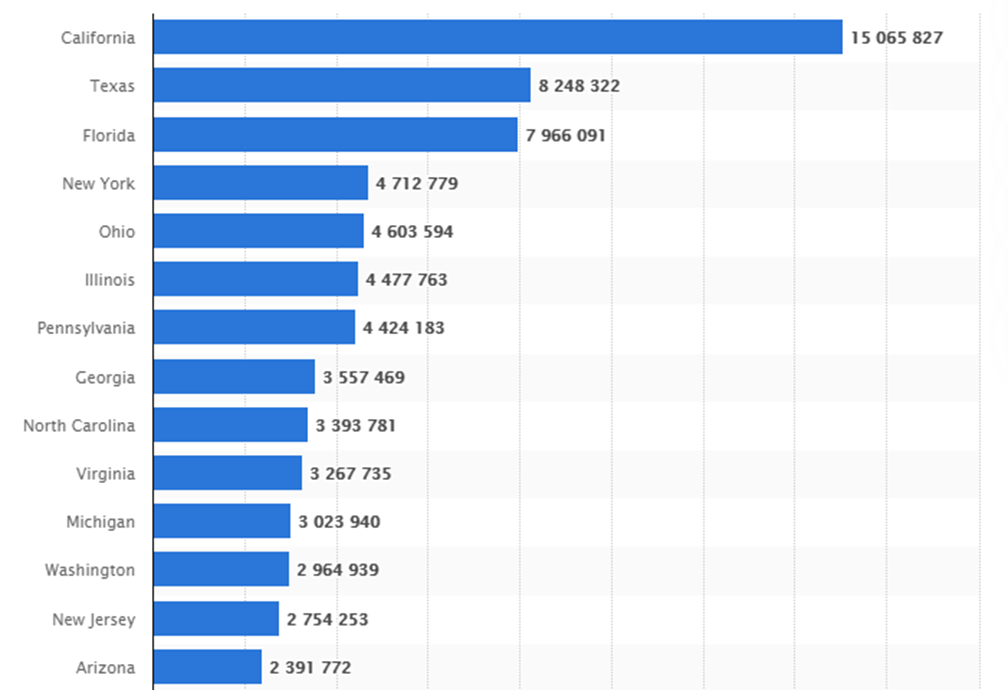
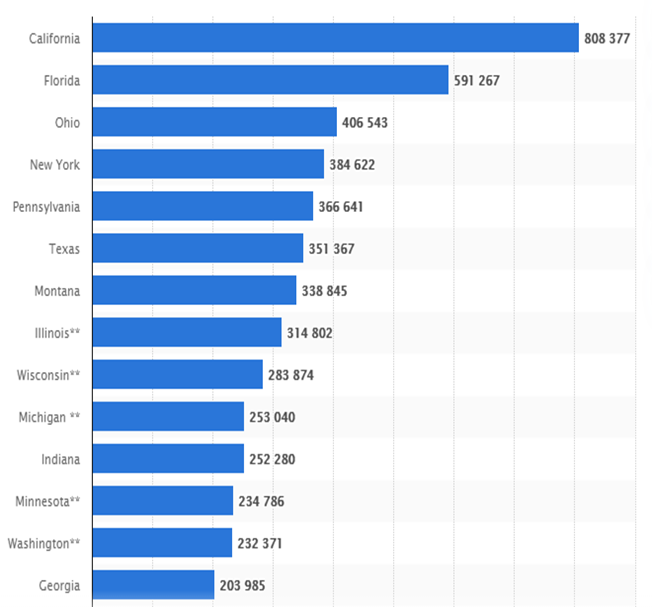
Recently, car sales have been the highest in the western United States, according to the chart presented in Figure 1. Based on this data, one can notice that the number of cars sold in this region exceeds that in Texas, the nearest state in terms of sales, by almost double. The figures in the east of the country are inferior to those from California. At the same time, the sales indicators from Arizona should be considered the lowest of the 15 positions presented. Given that this state borders California, one can conclude that not all western regions are characterized by high demand for cars. As a result, when planning business promotion and expanding the sphere of influence, particular attention should be paid to California as the target state with the most cars sold in the country.
Sales by Fuel Type
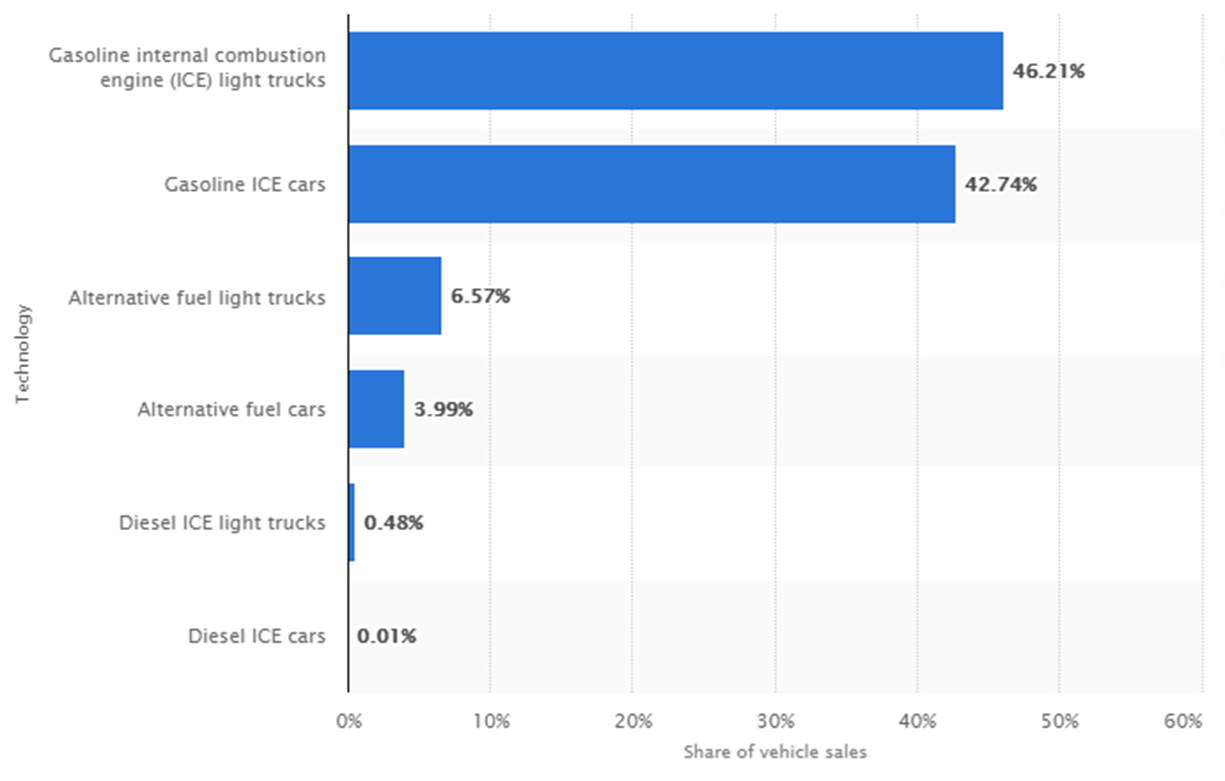
Based on the share of sales of fuel types used in modern cars, one can infer the main preferences of Americans. According to Figure 2, combustion engines running on traditional fuels are in the highest demand among the population and account for almost half of all sales. Regarding the statistics of the distribution of fuel preferences from the perspective of car body types, the ratio is approximately the same. Cars running on alternative fuels account for a significantly lower percentage of sales, although recently, this situation has changed due to the trend towards green production. In the automotive industry, in recent years, much attention has been paid to minimizing harmful emissions from fuel combustion products. In this regard, the transition to alternative energy sources seems an objective decision due to unfavorable environmental situations in densely populated regions.
The Current Automotive Industry Trends
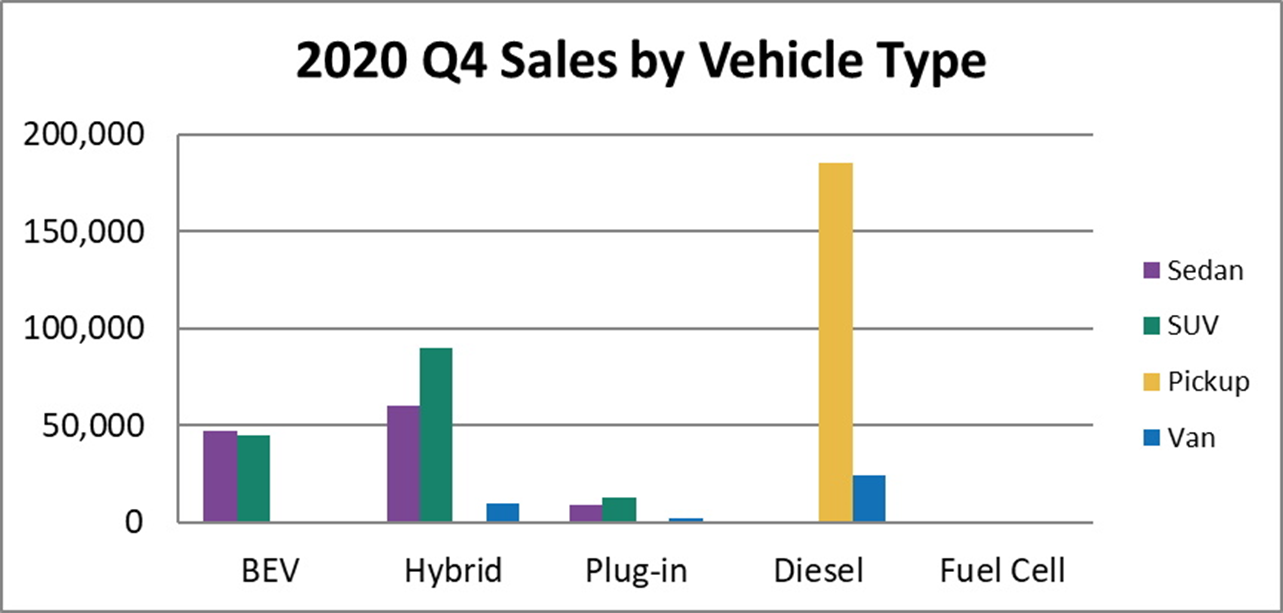
Despite the trend towards green production in various industrial areas, including the automotive industry, vehicles using environmentally friendly motors have not become dominant in recent times. According to the chart in Figure 3, diesel cars are still the leaders in sales. One of the possible explanations is that these vehicles are more affordable than, for instance, electric cars, which, despite being environmentally friendly, are more expensive. Moreover, this type of car does not even occupy the second line of the sales ranking since diesel engines are followed by hybrid models. At the end of 2020, the number of electric vehicles sold did not reach 50,000, while diesel vehicles were sold in the amount of approximately 180,000. Based on this, one can assume that, despite the trends, traditional models have retained their relevance and are actively sold.
Customer Demands
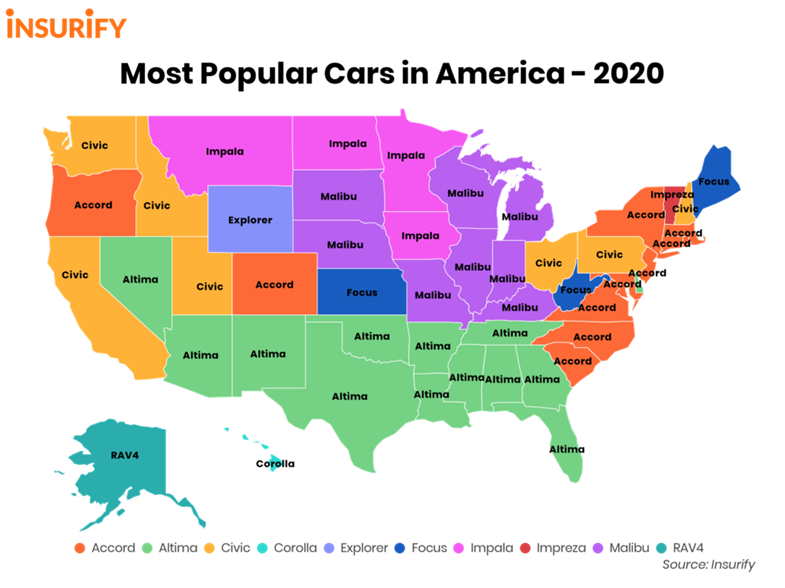
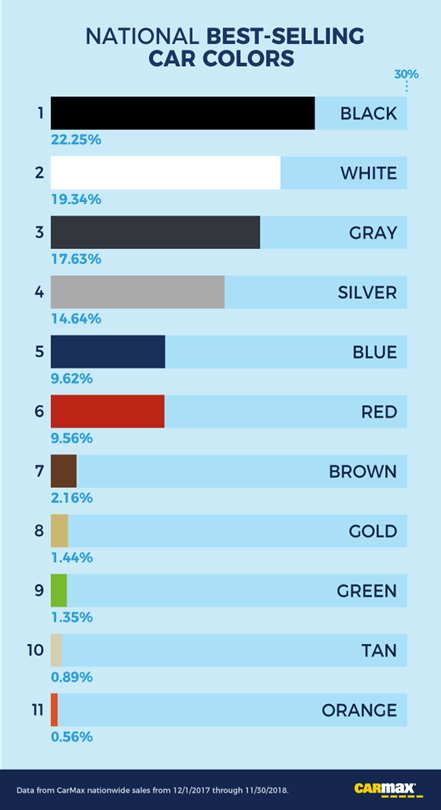
Consumer trends in the automotive industry can help identify the key preferences for such parameters as vehicle models with specific options and their colors. According to the statistics presented in Figure 4, the Altima model by Nissan is the most common car in the United States, and in all southern states, it occupies a leading position. Cars by Honda and Chevrolet are also popular with Americans and represent a large percentage of total sales. In terms of color preferences, black is the dominant color in the car market, judging by the infographics shown in Figure 5. It is followed by white and gray, while brighter shades, such as green or orange, make up a small percentage. Thus, the choice for practicality and reliability underlines the current trends in the automotive industry.
Body Types
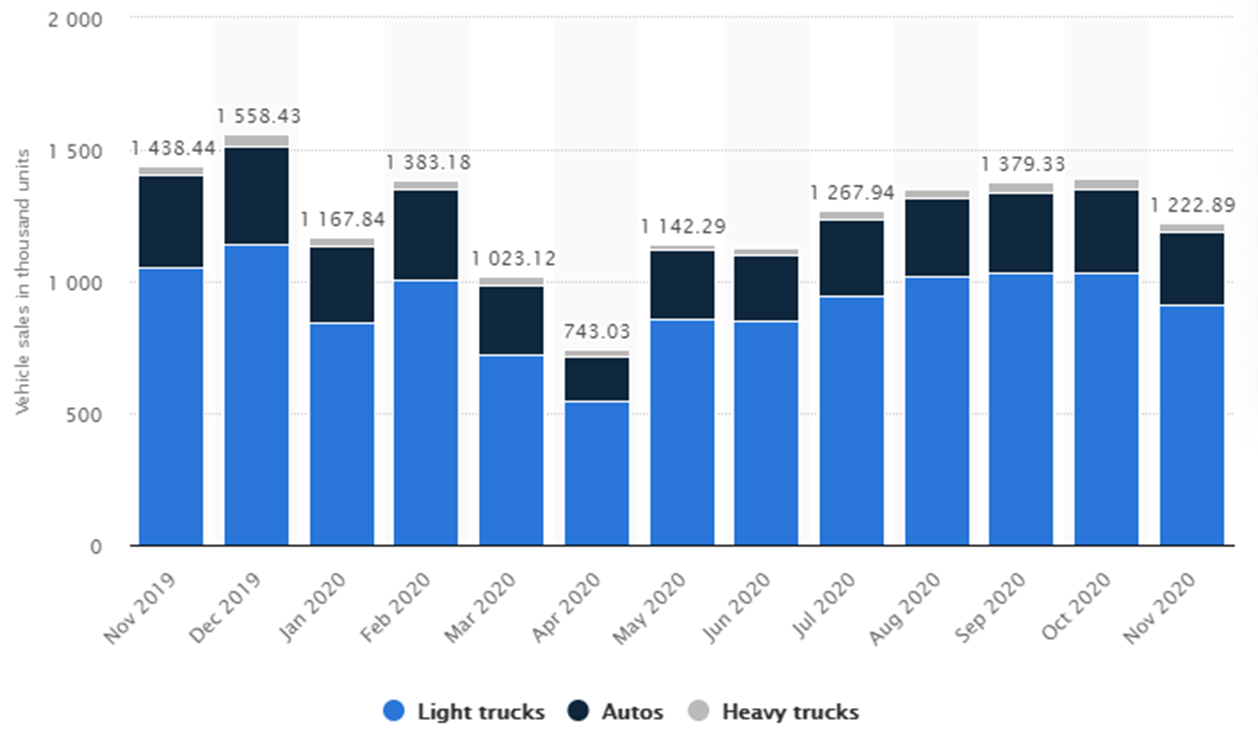
The dynamics of car sales have been unstable in recent years, and the data for 2020 shows a decline in the sales of vehicles of all body types without exception. In Figure 6, a chart is presented in which the sales level of ordinary cars, light trucks, and heavy trucks is given. Based on these official statistics, one can note that despite the downturn in the midst of the COVID-19 pandemic in 2020, light trucks were sold in higher volumes than other body types. Closer to 2021, the situation improved slightly, but the correlation remained almost identical. This means that the constant demand for these types of vehicles prevails. The supply of engines and other components for these cars is a potentially profitable solution since the demand for them is higher than for other models.
Trends in the Motorcycle Industry
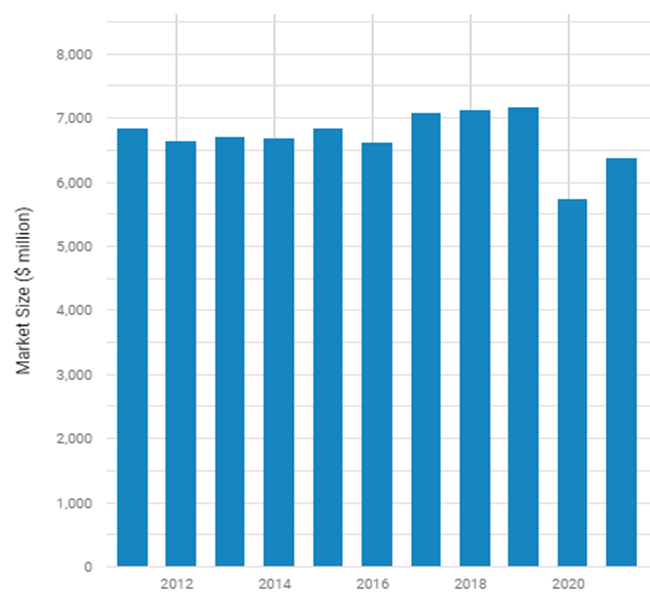
The motorcycle industry, despite its traditions and history, is inferior to the automotive industry both in terms of sales and growth dynamics. At the same time, according to the chart in Figure 7, roughly similar sales ratios across regions remain: Americans buy motorcycles more frequently on the West Coast than elsewhere in the country. This factor should be taken into account since, in the case of cars and motorcycles, promoting a business in the west is a potentially profitable solution, and the statistics confirm this. From a growth perspective, Figure 8 shows the situation in the motorcycle industry, and one can note that 2020 was the worst in the last decade concerning the number of sales. Nevertheless, on the same graph, growth in 2021 is observed, which may mean positive dynamics and an increase in consumer interest in vehicles of this category.
Types of Products
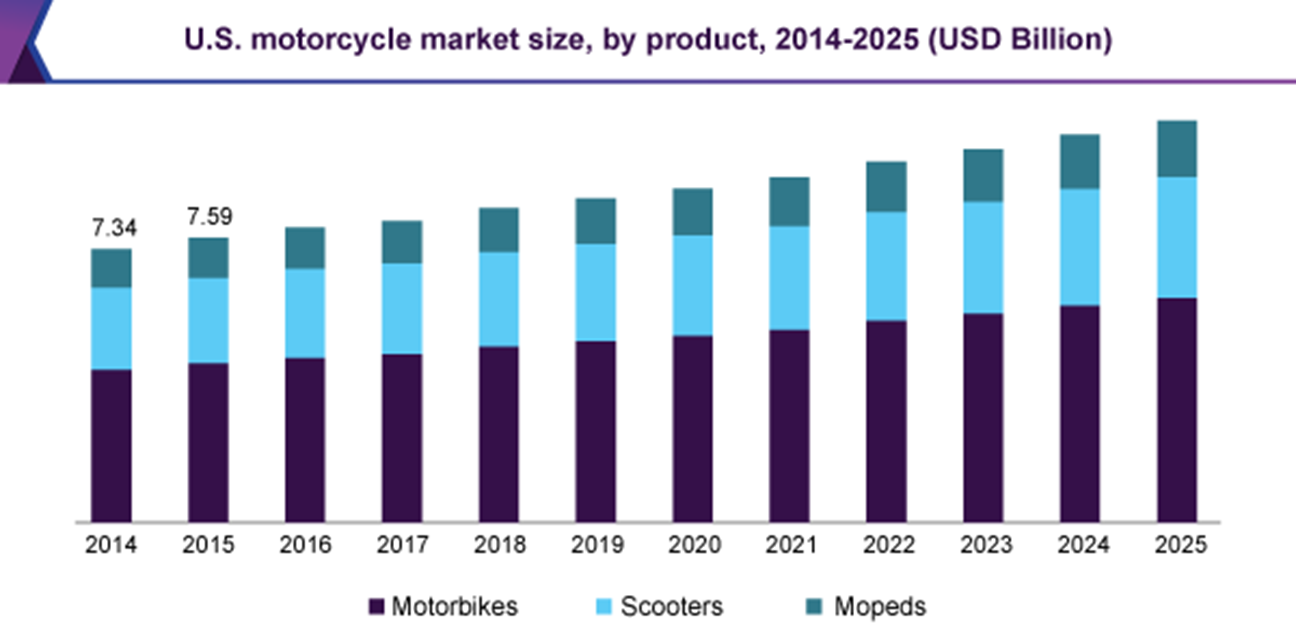
Despite the fact that the motorcycle market lags behind the automotive market in terms of the number of vehicles sold, this industry is developing steadily, although not quickly. At the same time, as well as among cars, in this area, there are sales leaders, in particular, by type of design and purpose. According to the diagram in Figure 9, in the modern United States, motorbikes are the most popular of all types of products in this industry. Further, scooters follow, which are also sold successfully, and based on the official statistics, their share of sales has grown in recent years. Mopeds make up the smallest group of motorcycle products, and from the chart, the demand for them has not been very high in recent years. When taking these statistics into account, one can note that working with motorbikes can be associated with potential profit.
Trends in Customer Demands
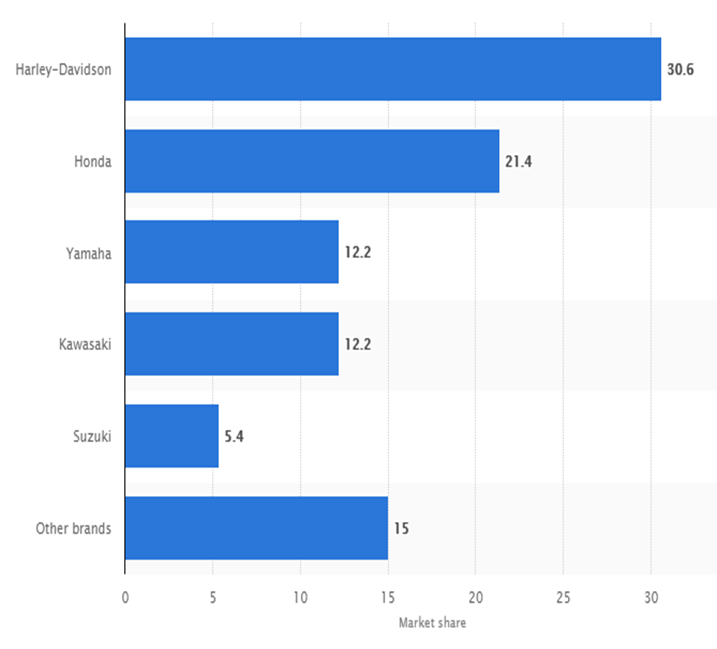
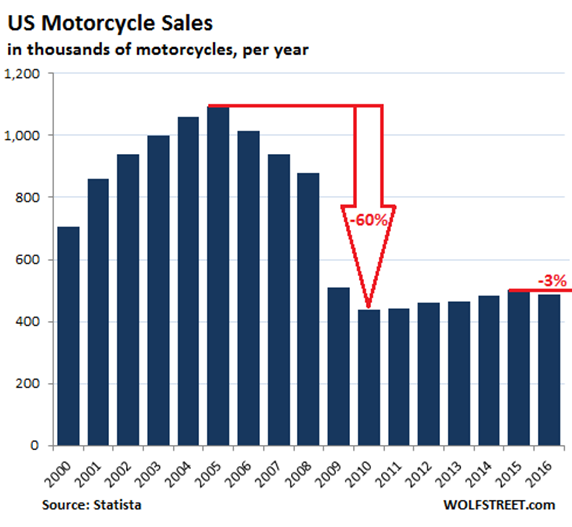
Due to its history and the preserved traditions of quality, individual models of modern motorcycles enjoy wide customer demand and are the bestsellers. For instance, based on the official statistics from the chart in Figure 10, Harley-Davidson, the world-renowned brand, accounts for over 30% of the US motorcycle market. However, among the leaders, this model is the only one of American origin. The models by Honda, Yamaha, Kawasaki, and several others form a significant market share and represent serious competition for Harley-Davidson. Moreover, as the chart in Figure 11 shows, in 2010, Harley-Davidson’s share of sales fell to a record 60% in 10 years. This means that consumers trust Eastern vehicles and value Japanese motorcycles significantly. Therefore, when entering this industry, this may be reasonable to pay particular attention to these brands.
Summary
Both industries examined are dependent on external factors, including social hardships, in particular, the COVID-19 pandemic. The share of sales has decreased since the beginning of the epidemic, but at the moment, the situation is improving. Of all the parameters considered, one can highlight specific indicators that have been formed due to client preferences, for instance, body types or models. In the west of the country, people are more likely to buy both cars and motorcycles. At the same time, when analyzing the motorcycle industry, the data does not allow obtaining information on sales by region or comparing pricing policies between the two industries to highlight the corresponding proportions.
Decision-Making Models
The Rational Model
The Rational model is a decision-making methodology that allows finding specific solutions based on the aspects of objectivity and logic. In this model, there is no place for subjective assumptions, and any steps are taken in turn and on the basis of preliminary research and reflection on their potential results. This algorithm assumes operating with accurate data that helps choose the best decision-making path in accordance with calculations or other measurement tools. Intuitive decisions are unacceptable since they carry potential bias and/or a subjective context, which, in turn, may be irrational.
The Intuitive Model
The Intuitive model is a convenient and, at the same time, controversial decision-making algorithm from the standpoint of the accuracy of the decisions made. The absence of research background and evidence base makes it easier to work on a specific topic and speeds up all operational solutions. Objective reasoning is not welcomed, and affective perception plays a major role. Due to this model, members of the same group can exchange ideas freely and be constantly looking for new solutions. An informal style prevails over a formal one, which reduces subordination and increases mutual trust.
The Recognition-Primed Model
A Recognition-Primed Model is a decision-making approach that is based on finding adequate solutions through the application of accumulated experience. This framework is relevant to situations when the time for making a decision is limited, and a suitable work algorithm is needed as soon as possible. By combining existing knowledge, a decision-maker relies on the similarity of scenarios in different problems and contexts and operates on specific patterns. The data for analysis is usually incomplete, which, nevertheless, does not preclude drawing up an action plan based on the available information.
The Most Appropriate Decision-Making Model
Based on the specifics of the project and the industries under consideration, the Rational Model is an optimal decision-making methodology. The data on automotive and motorcycle sales are detailed and accurate, and any subjectivity in the assessment can lead to negative consequences due to calculation errors. In addition, the time for making decisions is not limited, and at any stage, careful analytics is crucial to predict the potential outcomes of entering a new industry. Therefore, the Rational Model makes the most sense for this project.
References
Breakdown of light vehicle sales in the U.S. in 2019, by fuel type. (2020). Statista. Web.
Chi, C. (2018). Rational decision making: The 7-step process for making logical decisions. HubSpot. Web.
Market share of major motorcycle brands in the U.S. as of March 2020, based on unit sales. (2020). Statista. Web.
The most popular cars by state. (2021). Insurify. Web.
Motorcycle, bike & parts manufacturing in the US – Market size 2003-2026. (2020). IBISWorld. Web.
Okoli, J. O., Weller, G., & Watt, J. (2016). Information processing and intuitive decision-making on the fireground: Towards a model of expert intuition. Cognition, Technology & Work, 18(1), 89-103. Web.
Orlandi, L. B., & Pierce, P. (2020). Analysis or intuition? Reframing the decision-making styles debate in technological settings. Management Decision, 58(1), 129-145. Web.
Richter, W. (2017). Harley-Davidson spirals down, announces US layoffs, builds factory in Thailand. Wolf Street. Web.
U.S. automobile registrations in 2018, by state. (2019). Statista. Web.
U.S. motorcycle registration estimates in 2019, by state (in units)*. (2020). Statista. Web.
U.S. vehicle sales between November 2019 and 2020, by vehicle type. (2020a). Statista. Web.
U.S. vehicle sales dashboard. (2020b). Diesel Technology Forum. Web.
Which car color is most popular in your state? (2019). Carmax. Web.