Introduction
The present report was commissioned by the Chief Financial Officer of Alaska Air Group with the purpose of assessing the company’s current financial position. This paper aims at providing insights that will help the company’s development in the future. The report was guided by the question: “Will Alaska Air Group be financially viable over the next two to three years, and which steps should be done to improve its financial stability?” The current financial performance of the company is evaluated against the historical data and the performance of the competitors to provide recommendations for further actions.
Trend Analysis
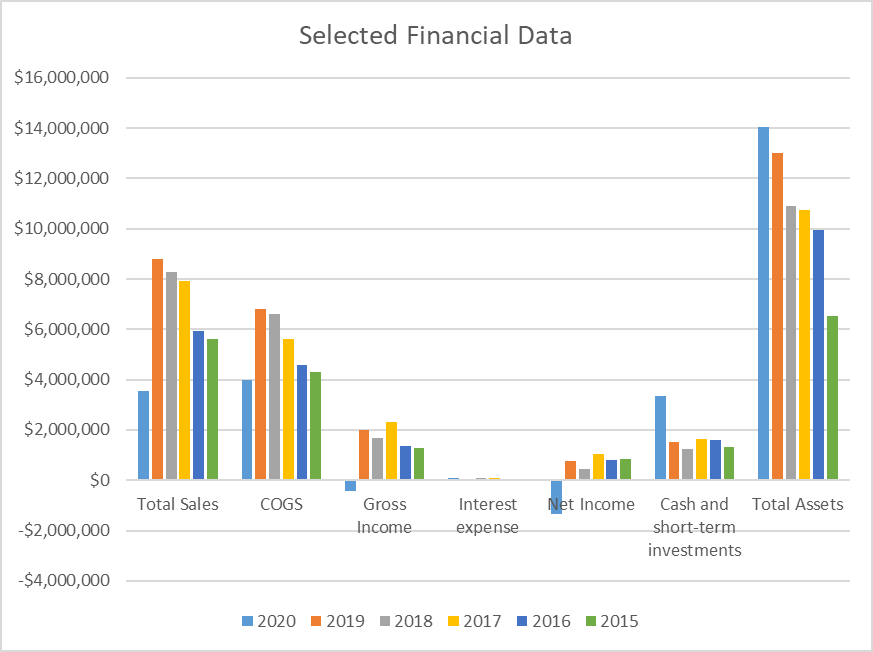
The present section provides the analysis of key indicators of financial performance, including total sales, cost of goods sold (COGS), gross income, interest expense, net income, cash and short-term investments, and total assets. The values of these performance indicators between 2015 and 2020 are provided in Appendix A using data from Yahoo Finance (2021a) and Alaska Air Group’s (2017) annual report for 2017. Figure 1 below visualizes these values to facilitate the trend analysis.

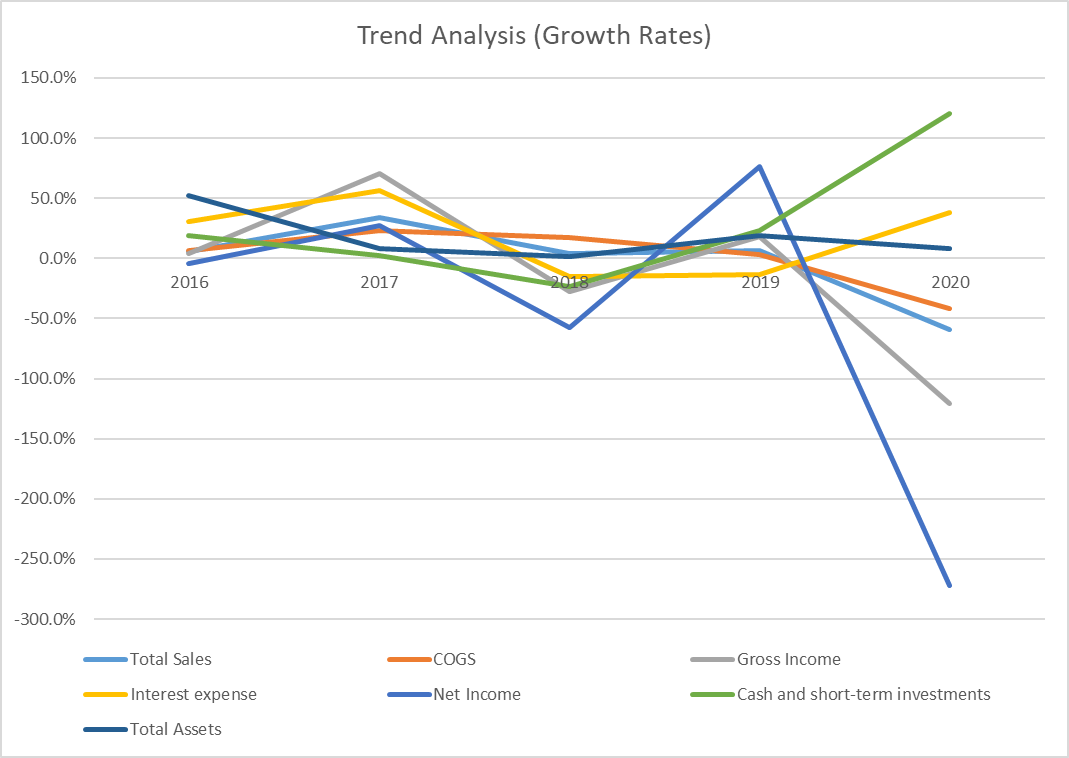
The growth rates for the selected indicators are provided in Appendix B. Figure 2 below visualizes the growth rates with graphs to understand the trends.

The trend analysis demonstrates that Alaska Air Group experienced a significant decline in total sales in 2020. In particular, the total sales in 2020 were $3,566 million in comparison with $8,781 million in 2019. This implies that the company experienced negative growth at -59.4% in 2020. Before 2020, the total sales growth rate was always positive, demonstrating the company was developing at a steady pace. The primary reason for a drastic decline in sales is the COVID-19 pandemic, which resulted in a significant drop in demand in 2020 (Alaska Air Group, 2021).
As a response to the uncertainties associated with the pandemic, US-based airlines reduced domestic capacity when compared to 2019 by 75% (Alaska Air Group, 2021). Such measures helped to reduce COGS by 41.5%, which was not enough to make any profit in 2020. Thus, in 2020, gross profit was -$414 (-120.9% growth) and Net Income was -$1,324 (-272.2% growth). However, in 2020, the company managed to increase its total assets by decreasing its non-current assets (selling property and equipment) and increasing its cash and marketable securities. Interest expenses also grew by 38%.
In general, before 2020, Alaska Air Group demonstrated a stable performance in the majority of indicators. The company was always able to make a profit regardless of outside influence. In 2017, the company experienced significant growth in revenues, gross profit, and net income without drastic increases in total assets. This implies that the efficiency of managing assets improved and remained high in 2018 and 2019. However, the volatility of performance was high, which can be seen in Figures 1 and 2 above.
Financial Ratio Analysis
The present section provides an analysis of financial ratios to evaluate the performance of the company in terms of liquidity, efficiency, profitability, and return on investment. Calculated financial ratios are provided in Table 1 below.
Table 1. Financial Ratios (Morning Star, 2021).
Liquidity
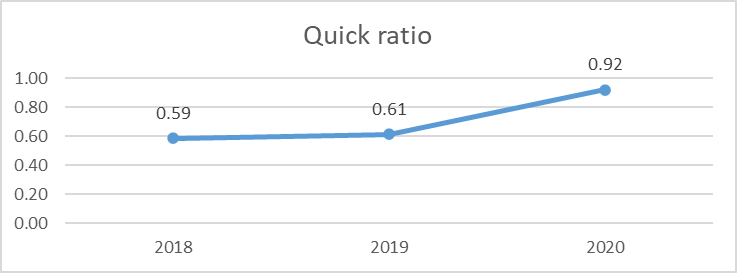
Liquidity ratios demonstrate if a company has enough current assets to cover its current expenses without raising additional capital. Two ratios used for liquidity analysis are current and quick (acid-test) ratios. The quick ratio was used for the analysis, as it does not consider inventories, which may be difficult to turn into cash. However, there is not much difference between the ratios due to low inventories (see Table 3). The trends in the company’s liquidity for the past three years are demonstrated in Figure 3 below.

The analysis demonstrates that the company had low liquidity before the COVID-19 pandemic. In 2020, the liquidity of the company increased by 0.31 in comparison with 2019. Such an increase in liquidity is attributed to the increased amounts of cash and equivalents stored by the company. These cash reserves were created by selling property and equipment as a reaction to the increased uncertainty of the outside environment. However, it should be noticed that the liquidity of the company remains below 1, which implies that Alaska Air Group does not have enough current assets to cover its current liabilities.
Efficiency
The efficiency ratios demonstrate how well the company manages its resources to generate sales. In other words, these ratios measure the ability of the company to use its assets and liabilities effectively short term. The analysis of the company’s efficiency demonstrated that its ability to use its assets effectively decreased drastically in 2020 due to the pandemic. However, before 2020, Alaska Air Group was able to keep a stable performance in terms of assets turnover, which can be seen in Figure 4 below.

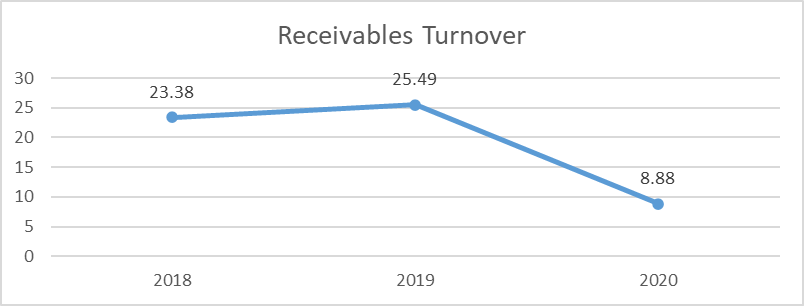
Additionally, the company’s ability to collect receivables decreased drastically. Figure 5 below demonstrates that receivables turnover decreased by 65% in 2020. Additionally, the company needed 41 days to collect the receivables in 2020, while it only needed two weeks in 2019. This implies that the company’s efficiency in terms of managing receivables decreased drastically.

Profitability
As it has been mentioned in Section 2 of the present report, the company experienced a significant drop in revenues in 2020 due to the pandemic, which negatively affected gross profit, operating profit, and net profit. The trends in profitability as measured by net profit margin are presented in Figure 6 below.

Return on Investment
The analysis of return on investment demonstrates how much profit a company makes by investing in assets. In other words, these ratios demonstrate how much net income a company can expect from its investments. As seen from the changes in return on assets (ROA) in Table 1, the company had high returns (almost 10%) before 2018. In 2018, ROA deteriorated to 4.04%, grew to 6.43% in 2019, and fell to -9.79% in 2020. The problem was that the company had low net income despite the growth of revenues in 2018. As for 2020, the decline was associated with negative net income.
Recommendations for Improvement
Currently, the primary problem of the company is the lack of sales that can cover the expenses of the company. Even though the market started its rebound in 2021, there is an increased competition that aims at capturing new clients from the slowly growing demand. Thus, the company needs to focus on attracting new clients to increase sales. However, careful attention should be given to the COGS, as currently, they are higher than costs.
Experience demonstrates that the management of the company already had problems with high COGS in 2018, which resulted in a decline in net profit despite the growth of revenues. Additionally, the analysis revealed that the company needs to improve its ability to collect receivables to ensure that management efficiency. Finally, the company may consider selling some property and equipment to increase its liquidity and ROA. However, this decision may be associated with negative consequences long-term.
DuPont Analysis
The preset section provides a comparative analysis of Alaska Air Group and JetBlue using DuPont analysis. The utilized method is useful for decomposing the return on equity (ROE) ratio. It is a useful technique used to assess the operational efficiency of two or more companies in the same industry. DuPont analysis of the companies is provided in Table 2 below.
Table 2. DuPont Analysis.
DuPont analysis is similar to the ROE ratio, which implies that the values should be very close. The analysis demonstrates that ROE increased in 2019 and fell in 2020 due to the pandemic. Alaska Air Group experienced a significant decline in components of the DuPont Identity, as was mentioned during the ratio analysis. In particular, both net profit margin and asset turnover decreased drastically in 2020. At the same time, the level of financial leverage increased as indicated by the equity multiplier. Thus, the increase in total assets can be explained by the increased financial leverage, which is a negative factor due to the increased instability of the outside environment.
When compared to JetBlue, Alaska Air Group is more effective. Its net profit margin and asset turnover are higher, which implies that JetBlue is underperforming. However, it should be noticed that the equity multiplier (financial leverage) of JetBlue is lower. Thus, Alaska Air Group should focus on decreasing its level of financial leverage to become less sensitive to outside changes.
Recommendations
The current financial performance of Alaska Air Group is associated with a large degree of uncertainty. In 2020, the company experienced a significant decline in profitability, efficiency, and returns on investments. However, these changes were not associated with internal factors. As comparative analysis shows, competitors also experienced similar declines. In fact, Alaska Air Group adapted to the environment better than JetBlue, which was demonstrated by the DuPont Analysis. At the same time, the adaptation made by Alaska Air Group’s management was insufficient to prevent losses short-term. Based on the analysis, the company is recommended:
- The primary concern of Alaska Air Group is to increase its sales. Currently, the 59.4% drop in sales in 2020 is the central problem the company needs to solve. Market research needs to be conducted to assess the needs of potential clients, and every effort should be given to fulfilling these needs.
- The company needs to decrease its level of financial leverage to decrease interest expenses. As mentioned in Section 4, the current level of leverage is higher than that of the competitor. The capital can be raised by selling property and equipment, which will improve asset turnover. However, such action may lead to unfavorable outcomes long-term; thus, a risk assessment needs to be conducted.
- Alaska Air Group needs to decrease its COGS by close management of possible wastes. The increase in sales is not guaranteed to return the gross profit margin at the desired level, as it was demonstrated in 2018.
Reflections
The present assignment provided an opportunity to use the knowledge about the assessment of financial position in practice. In particular, I received a chance to search for relevant information utilizing different sources, such as annual reports and websites that accumulate information on the financial performance of many companies. I was able to search for the ratios and calculate them using Excel. Additionally, I used Excel for creating charts and graphs that reflected trends in financial performance. I also received experience in formatting formal reports to make them look neat and organized. I am sure I will be able to use all this experience in my workplace, as I often need to look for financial data, make relevant calculations in Excel, and create reports for higher management.
References
Alaska Air Group. (2017). Annual report 2016. Web.
Alaska Air Group. (2021). Annual report 2020. Web.
Morning Star. (2021). Alaska Air Group Inc. Web.
Yahoo Finance. (2021a). Alaska Air Group Inc. Web.
Yahoo Finance. (2021b). JetBlue Airways Corporation. Web.

