Introduction
The present case study features the assessment of the opportunity of GlaxoSmithKline (GSK) to increase the production of secured doses of the COVID-19 vaccine. In February 2021, GSK announced the start of the Phase 2 test of its vaccine against the novel coronavirus infection (GSK, 2021a). GSK also announced that Phase 3 of the tests would be launched in Q2 of 2021, and the start of the sales is planned in Q4 of 2021 (GSK, 2021a). At present, the European Commission (2021) secured 300 million doses of the Sanofi-GSK vaccine, which implies that GSK will produce at least 300 million doses if the trials are successful. However, there is a possibility that GSK will sell more doses of the vaccine due to the recent events with the Oxford-AstraZeneca vaccine. Several European countries stopped using the AstraZeneca vaccine due to several reports of blood clots and cardiac arrests after administering the vaccine (Meredith, 2021). If such a tendency in vaccine suspension continues, GSK may experience a significant rise in demand for its vaccine, as GSK has more time to test it.
While the World Health Organization, Europe’s drug regulator, and the International Society on Thrombosis and Hemostasis recommended continuing using the vaccine, Germany, France, Italy, Spain, Sweden, and Latvia suspended the use of the vaccine (Meredith, 2021). In other words, the AstraZeneca vaccine experiences a problem with PR rather than a scientific issue, as the trust in the vaccine keeps falling.
The primary purpose of the present report is to evaluate the opportunity of expanding the company’s production of the COVID-19 vaccine. The paper is subdivided into four major parts to ensure that the opportunity is evaluated from all angles. First, the report provides a thorough assessment of GSK using SWOT and financial ratio analyses. Second, the report provides an evaluation of the opportunity using breakeven, payback period, internal rate of return (IRR), and net present value (NPV) analysis. Third, the paper discusses the opportunity in light of the company analysis to assess the possibility of expansion. The paper is concluded with a summary of findings and recommendations for future development.
Company Analysis
Company Overview
GlaxoSmithKline (GSK) is a world-famous discoverer, developer, and manufacturer of healthcare products. The company operates in three areas, including pharmaceutical, vaccine, and consumer product businesses (GSK, 2020a). The company is valued for its intellectual property, as research and development (R&D) of pharmaceutical products is a significant part of the company’s business. Currently, the company is actively working on the creation and development of several vaccines against COVID-19 in a cooperative endeavor with Sanofi (GSK, 2020b). GSK uses its innovative technology of vaccine adjuvant, which is a substance that increases the effectiveness of vaccines helping to decrease the reduce the amount of vaccine protein required per dose, which is crucial during the pandemic (GSK, 2020b). Thus, the firm sees innovation as its business advantage over its competitors.
The number of employees in GSK has been around 95 thousand people for the past three years, which implies that the company managed to maintain its number of employees despite the world economic crises associated with the COVID-19 pandemic (GSK, 2019; 2020a; 2021b). The company values its employees and applies strict regulations to the selection of new employees. In particular, all the employees are evaluated based on Innovation, Performance, and Trust (Mondol, 2019).
In 2020, the company set ambitious sustainability goals to adhere to Goal 3 of the UN Sustainable Development Goals. This is a crucial contribution to the company’s strategy, as growing environmental concerns are considered one of the major threats of trust to in the company.
- Purpose: “To improve the quality of human life by helping people do more, feel better and live longer” (GSK, 2021b, p. 01).
- Goal: “To become one of the world’s most innovative, best-performing and trusted healthcare companies” (GSK, 2019, p. 01).
- Strategy: “To bring differentiated, high-quality, and needed healthcare products to as many people as possible, preventing and treating disease and keeping people well with our scientific and technical know-how and talented people” (GSK, 2021b, p. 01).
SWOT Analysis
SWOT stands for Strengths, Weaknesses, Opportunities, and Threats, which are the crucial aspects of the business. The technique helps to reduce the chances of failure of a project by acknowledging all the possible facilitators and obstacles. SWOT analysis considers both internal and external factors, which makes it a flexible tool for business analysts. Below is the SWOT analysis of GSK using the data from the annual reports and the outside sources.
Strengths
- The company has a dynamic research and development (R&D) culture, which helps to promote innovation on all levels. In 2020, the company spent £5,098 million on R&D, which is almost 15% of its total revenue (GSK, 2021b). Moreover, the R&D budget increased by £530 million in comparison with 2019, which was a response to the COVID-19 pandemic (GSK, 2021b). The main areas of focus are HIV, respiratory, and cardiovascular medications (GSK, 2021b).
- GSK has a wide distribution network, which helps the company’s product to be present in any part of the world on-demand with a limited lead time (Mondol, 2019).
- The company has a strong global presence, as it operates in more than 100 countries around the globe (GSK, 2021b).
- GSK established completed a transaction with Pfizer to create one of the world’s largest joint ventures, which allowed the company to gain access to new markets, increase its capacity, and receive new resources (GSK, 2020a).
- Dedication to a sustainable supply chain improves the corporate image and decreases the chance of liability associated with new environmental laws.
Weaknesses
- The company’s image was affected by fraud, misbranding, and scandals. In particular, the company pleaded guilty during the court proceedings in the US in 2012. The company illegally marketed Paxil as an antidepressant to treat depression in children (Drug Watch, n.d.). Moreover, the company did not report any problems with Aveda to FDA, even though there were significant safety issues (Drug Watch, n.d.). Finally, the company was fined a $489 million fine for bribing doctors in China to advertise their products (Sullivan, 2018).
- The company has no access to cheap raw materials due to its policy of using only the raw materials produced by GSK to avoid quality problems. While this may be considered a strength, as the quality of the products is ensured, it also increases the price of the final products, which decreases the company’s competitive ability.
- Some of the blockbuster products are reaching their maturity, which may negatively affect the company’s profitability (GSK, 2021b).
Opportunities
- The company has demonstrated significant improvements in its performance after mergers and acquisitions (M&As). In particular, GSK partnered with Pfizer and Novartis to improve its distribution networks. Recently, the company started working with Sanofi to develop a COVID-19 vaccine (GSK, 2021b). The company can continue its M&A activity to improve its market share and penetration. The possible candidates for collaboration are Clover Biopharmaceuticals and the University of Queensland (Flynn, 2020).
- Society and political powers are becoming increasingly concerned about the environmental impact of the healthcare industry (GSK, 2021b). GSK can use its dedication to sustainability as a marketing strategy to improve the corporate picture and acquire a larger market share.
- Increased demand for pharmaceutical products due to the COVID-19 pandemic can be used to improve the company’s financial position and corporate image by providing high-quality drugs. In particular, Mahase (2020) points out that dexamethasone production and sales can increase as the World Health Organization considers it a life-saving drug.
- The COVID-19 vaccine developed with Sanofi can improve the current brand image and financial position.
- Recent suspensions of the Oxford-AstraZeneca vaccine can be beneficial for GSK, as it can increase its market share in the COVID-19 vaccine market (Meredith, 2021). However, PR associated with the vaccine distribution should be managed carefully to avoid the problems AstraZeneca is currently facing.
Threats
- Increased competition in the industry can be a significant threat to the company, as it may decrease the market share of GSK (GSK, 2021b).
- Government regulations, such as price controls and increased environmental liability, can decrease GSK’s profitability (GSK, 2021b).
- Generic drugs are a significant threat to substitution of the company’s products, which may cause significant market share and profitability issues (GSK, 2021b).
- Decreased trust in vaccines caused by the events associated with the Oxford-AstraZeneca vaccine can reduce the demand for vaccines in general (Meredith, 2021).
Financial Ratio Analysis
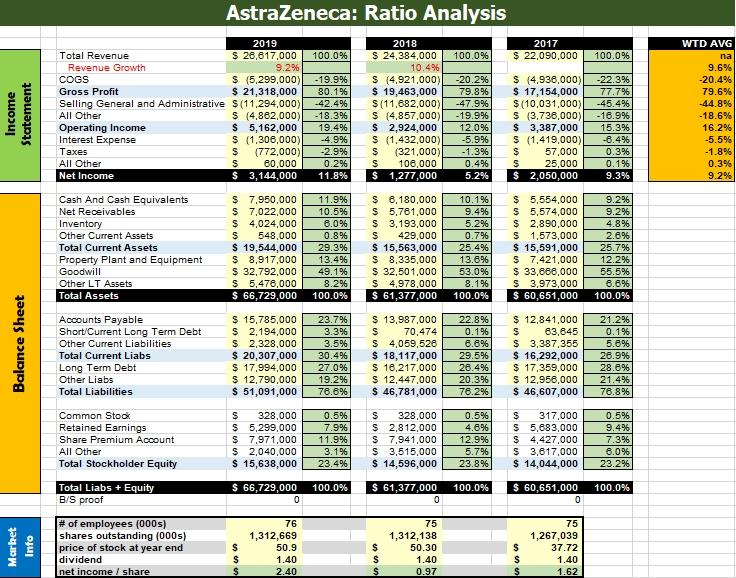
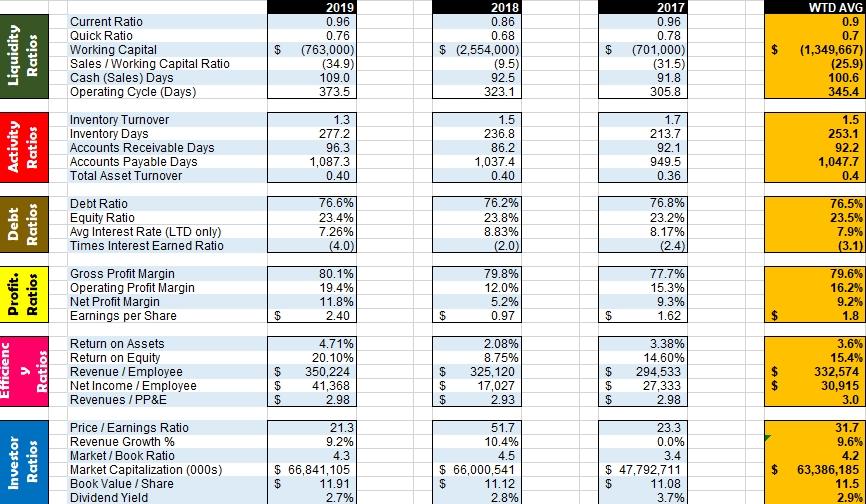
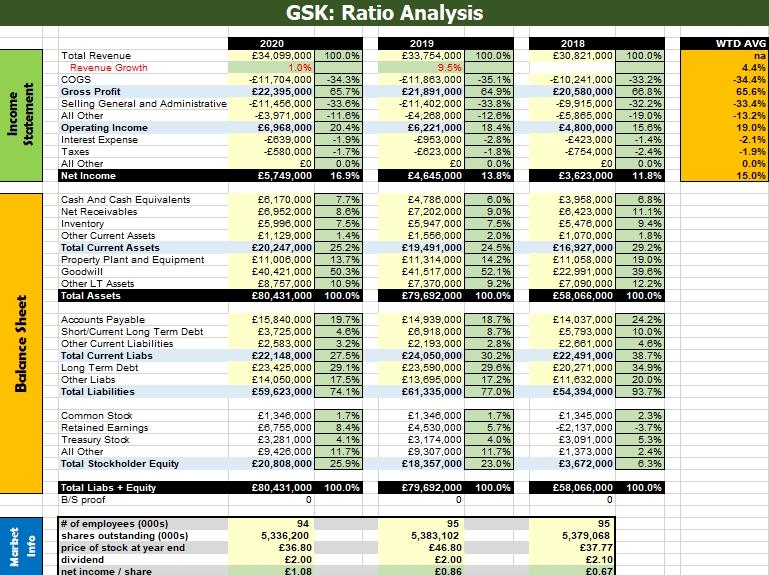
This section analyzes the financial performance of GSK during the past three years using financial ratios. The performance is assessed in terms of profitability, liquidity, long-term solvency (financial leverage), investment, and efficiency. The performance of GSK is juxtaposed to AstraZeneca for comparative analysis. The data used for the analysis was taken from Pro-forma financial statements in the annual reports of the two companies. The financial statements and ration analyses for three years for GSK and AstraZeneca are provided in Appendices A and B, respectively.
General Considerations
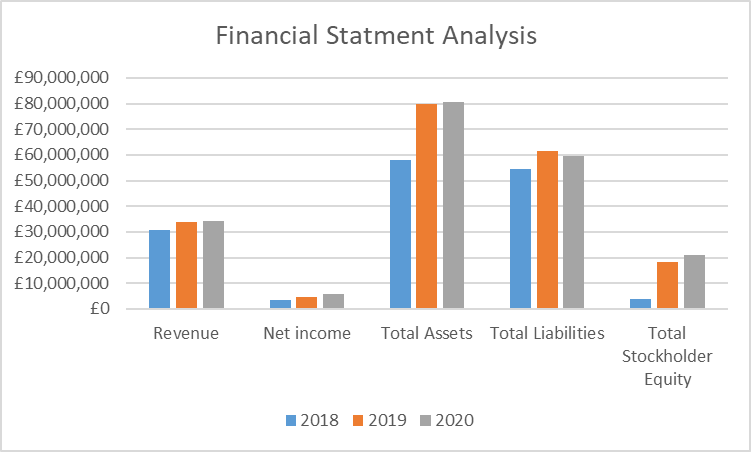
The analysis of financial statements revealed that the net profit of GSK was growing for the past three years, while the revenues stagnated at around £34 billion in 2019 and 2020 (see Figure 1 on Page 9). This can be viewed as both positive and negative. On the one hand, the company’s profitability has increased as GSK had increased profits with stable revenues. On the other hand, the lack of revenue growth is disturbing, as GSK purchased Pfizer in 2019, which affected the last five months of GSK’s financial performance. However, in 2020, the revenues did not increase, even though GSK had an enlarged distribution network and increased resources.
Another notable change in the financial statements is a 37% increase in total assets in 2019 in comparison with 2020. This increase is explained by closing the transfer with Pfizer. It is crucial to understand that the merger was financed with equity, as total liabilities experienced only a minor increase, as seen in Figure 1.
Profitability
Profitability ratios demonstrate the company’s ability to generate earnings. Appendices A and B include information on four profitability ratios, including gross profit margin (GPM), operating profit margin (OPM), net profit margin (NPM), and earnings per share (EPS). The results of the analysis demonstrate that GSK experienced a significant rise in profitability in 2019 in comparison with 2018 according to all metrics. This can be attributed to the merger with Pfizer, as it was the only major change in 2019. In 2020, NPM continued to grow, which can be explained by decreased interest and tax expenses.
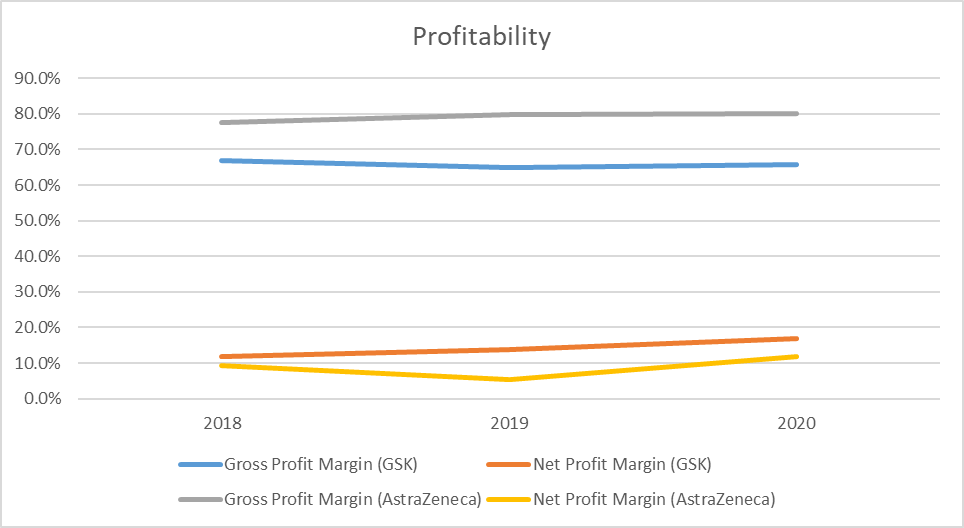
The selected profitability ratios of GSK are presented in Figure 2 in comparison with the same ratios of AstraZeneca. The analysis demonstrated that AstraZeneca had a high GPM in comparison with GSK, as the latter does not have access to cheap raw materials. However, GSK’s NPM was generally higher than that of AstraZeneca, which is a significant strength of the company.
Liquidity
Liquidity ratios demonstrate if the company has enough funds to cover its current expenses without using additional debt. Liquidity was measured using a total of six ratios, which can be seen in Appendix A (for GSK) and Appendix B (for AstraZeneca). The results demonstrate that GSK’s liquidity was improving during the past three years. However, it remained low. Figure 3 demonstrates the changes in the current ratios of the two companies.
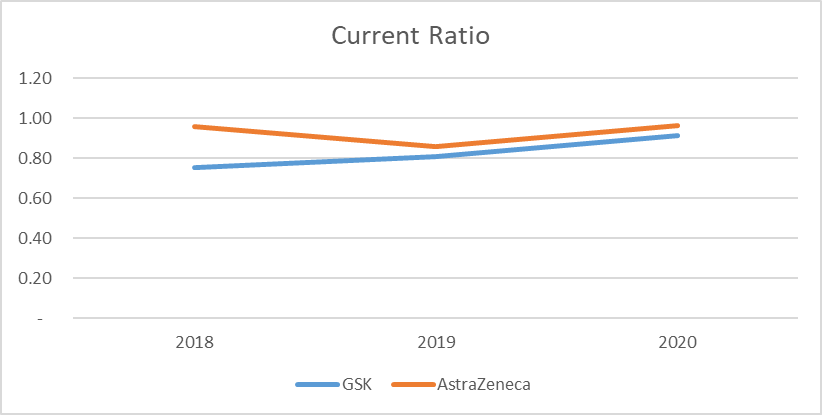
The analysis of the current ratio demonstrates that the company’s liquidity almost reached 1 in 2020, which was a significant rise in comparison with 2018 when it was only 0.75. AstraZeneca, however, outperformed GSK in terms of the current ratio, which implies that liquidity can be considered a weakness.
Leverage
The level of financial leverage demonstrates how much of the assets are financed using debt. High levels of financial leverage usually mean that companies need to pay large interest, which interferes with the company’s profitability. Additionally, high leverage ratios may mean that the company is more exposed to the changes in the outside environment. However, low levels of financial leverage may mean that the company does not use the opportunities of borrowed capital to an adequate extent. Appendices A and B include calculations of 4 debt ratios. The most explicit among these metrics is the debt-to-asset ratio, which demonstrates the percentage of debt from the total assets. The changes in the ratio of the companies under analysis are provided in Figure 4 below.
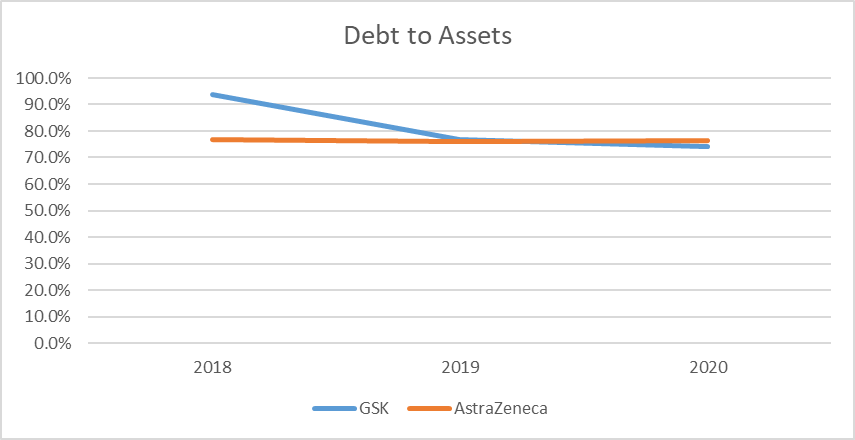
The analysis demonstrates that even though the weighted average of AstraZeneca’s level of financial leverage was lower than that of GSK, the latter has a favorable tendency of decreasing the importance of debt for financing the assets.
Efficiency
Efficiency ratios demonstrate how well the company uses its resources to generate income. Appendices A and B include five efficiency ratios, among which return on assets (ROA) is the most explicit one. The ratio demonstrates how much money the company earns from every dollar (or pound) of assets. The changes in ROA are provided in Figure 5 below.
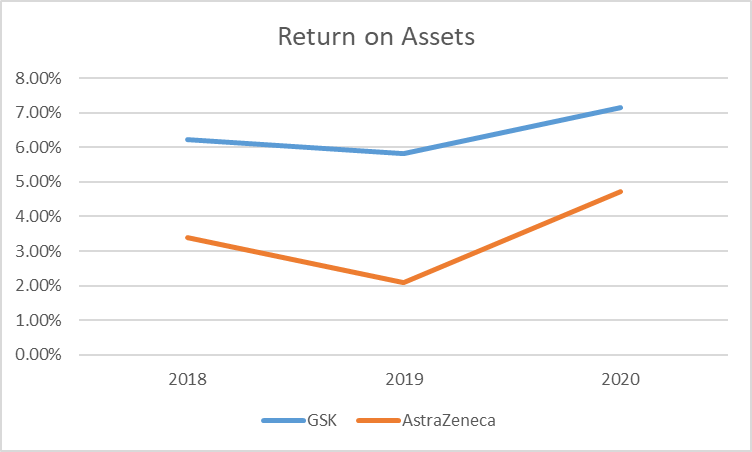
The analysis demonstrates that the efficiency of GSK and AstraZeneca had a similar pattern during the past three years. Therefore, the changes in ROA can be attributed to the changes in the industry in general. However, it should be noticed that GSK had lower overall volatility and an increased level of ROA during the three years under analysis. Thus, GSK’s efficiency is can be considered a strength.
Investor Ratios
Investor ratios help to evaluate how attractive the company is to the investors. These ratios help to understand how much profit an investor can make by buying the stock of the company. The appendices of the present paper include an analysis of five investor ratios, among which the price-to-earnings (P/E) ratio is the most frequently used one. Lower P/E ratios are usually more attractive to the investors, as they imply that the company is undervalued and the price of shares is expected to grow. The tendencies in the P/E ratio are provided in Figure 6 below.
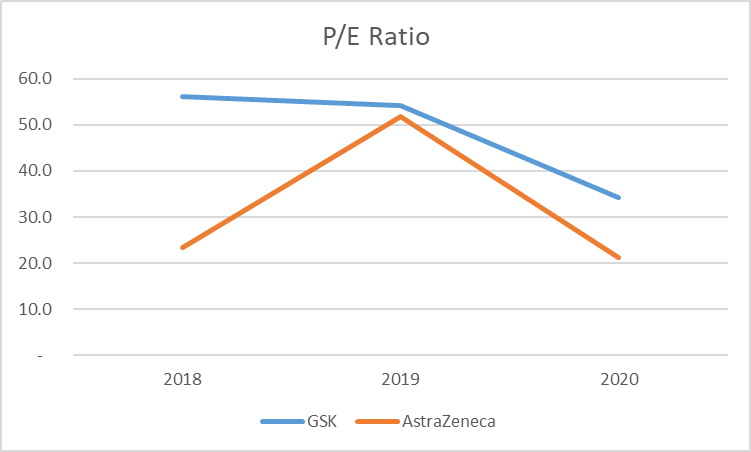
The analysis demonstrates that AstraZeneca had overall better performance in terms of the P/E ratio during the past three years in comparison with GSK. Thus, the P/E ratio is the company’s disadvantage. However, it should be noticed that GSK’s trend in the P/E ratio was more stable in comparison with AstraZeneca’s one.
Evaluation of an Opportunity
Opportunity Proposition
The present report proposes that the company expands its planned production of the COVID-19 vaccine at the end of 2021. The opportunity emerged due to significant issues with the Oxford-AstraZeneca vaccine, which was banned by several European countries (Meredith, 2021). In particular, AstraZeneca was able to sell less than a quarter of all the secured doses, as, in the middle of March 2021, only 70 million vaccines were delivered to the European Union (European Commission, 2021). This implies that at least 350 million vaccines secured by AstraZeneca can be dismissed and distributed among other producers.
GSK is suggested to start lobbying the idea that it is the most appropriate candidate for producing the vaccines instead of AstraZeneca. There are at least three advantages it can promote to increase its market share. First, GSK uses only self-made raw materials, which guarantees its high quality, which is crucial in the environment of decreased trust in vaccines. Second, GSK’s leverage decreased significantly during the past two years, which allows the company to take additional loans to finance the production of the vaccine. Finally, the company invests significant amounts into R&D and retention of valuable employees every year, which created a culture of safe innovation. This is also crucial in the current circumstances.
Assumptions
The evaluation of the opportunity employs several crucial assumptions listed below:
- The price of the COVID-19 vaccine will be £15 per dose;
- The company will be able to secure 60 million doses;
- The company will need to purchase additional equipment for £200 million to produce the vaccines;
- The company will spend £200 million on lobbying;
- The company will spend £2 on raw materials for the production of one dose of the vaccine;
- The company will spend £3 per vaccine on indirect labor costs;
- The vaccines will be produced for four years with 30 million doses during the first year and 10 million doses in the following three years;
- The company will spend £20 million annually on administrative costs;
- The company uses a discount rate of 12%;
- GSK will use its current distribution network, and no changes in the supply chain will be needed.
- GSK expects at least 5% in profits after applying the discount rate.
Breakeven Analysis
The breakeven analysis helps entrepreneurs assess the number of units that need to be produced in order to cover all the expenses (Hayes, 2020). In other words, the breakeven analysis helps to estimate the margin of safety for a business to consider a project (Hayes, 2020). In order to conduct the breakeven analysis, variable and fixed costs need to be calculated.
The fixed costs include the cost of equipment, the lobbying costs, and the administrative costs. The administrative costs can be calculated by multiplying the annual administrative costs by the number of years the project will operate. The variable costs consist of direct labor and direct material costs. The costs and revenues for the breakeven analysis are summarized in Table 1 below.
Table 1. Assumptions summary for breakeven analysis
The breakeven point can be calculated by dividing the total fixed costs by the difference between the price and the variable costs. The breakeven point is calculated below:
![]()
Thus, the company needs to sell at least 48 million doses to cover the associated fixed cost. Figure 7 below visualizes the breakeven point by placing the total cost and total revenue curves on the same graph.
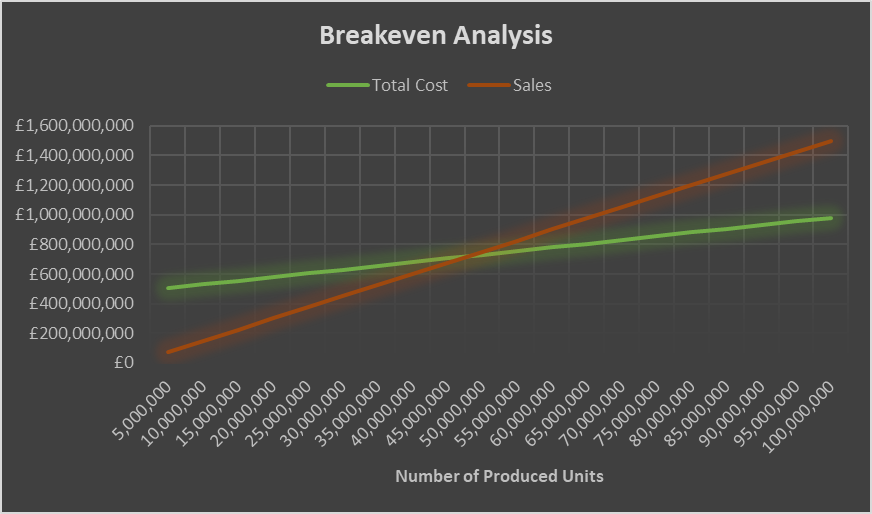
While the breakeven analysis is a valuable tool for understanding the minimal number of units that need to be produced for a project to be profitable, the method does not take into consideration the time value of money, which makes the method limited. Further analysis is needed to confirm the profitability of the investment.
Net Present Value, Internal Rate of Return, and Payback Period
The present section analyses the investment using several techniques. First, the investment is analyzed using the NPV methodology, which takes into consideration the time value of money. NPV helps to understand how much money the company will make at the end of the period taking into consideration the cost of capital. NPV is helpful when assessing a single investment possibility, as it tells the stakeholders how much money the company will make after considering the discount rate.
Second, IRR methodology was used to compare the received rate with the return rate the company uses for calculations. IRR is beneficial for comparing several investment opportunities, as it gives relative benefits regardless of the initial investment. However, IRR cannot tell how much money the company will make in absolute values. Finally, the Payback period methodology was used to help the stakeholders understand how much it will take the project before it starts bringing profit. The Payback Period methodology does not take into consideration the time value of money. Therefore, Discounted Payback Period technique was used to complement the disadvantage. The results of the analyses are presented in Table 2 below.
Table 2. Multi-method assessment of the opportunity
The results of the analysis revealed that the project would need 2.5 years to pay for itself without considering the time value of money. If the discount rate is taken into consideration, GSK will start receiving real income close to the end of the project after 3.5 years. The net present value of the investment is £28,375,835, which is 7.1% of real profits after applying the discount rate. The IRR is 15%, which is above the discount rate of 12% the company uses for calculations.
Discussion
Final Recommendations
The assessment of the opportunity revealed that the investment in increased production of the COVID-19 vaccine is an attractive investment opportunity for the company for several reasons. The SAF (Suitability, Acceptability, and Feasibility) model was used to arrive at the final conclusion.
First, the investment is suitable for the company, which implies that it adheres to the company’s goals and utilizes the company’s strengths. Production and distribution of the COVID-19 vaccine are coherent with GSK’s purpose to improve the quality of people’s lives, providing them with the opportunity to feel better and live longer. Additionally, the proposal is coherent with the company’s strategy to provide people with high-quality needed products. It is clear that the COVID-19 vaccine is among the most needed pharmaceutical products in the world, and GSK can produce the best quality vaccines, as it utilizes self-made raw materials and uses the latest technology, such as vaccine adjuvant. The proposal utilizes the company’s strengths, such as dynamic R&D and dedication to a sustainable supply chain. Thus, the described opportunity is a suitable investment option for the company.
Second, the option is acceptable for the company, as it meets the set investment criteria. The GSK will break even if it manages to sell 48 million doses, which is acceptable, as the company is expected to sell 60 million doses. The NPV analysis demonstrated that the investment would provide a profit of £28,375,835 (7.1%) after applying the discount rate, which is above the threshold of 5% set by the company. The IRR (15%) was above the utilized discount rate, which implies that the investment is profitable, and it will pay for itself in 3.5 years (according to the discounted payback period analysis). Since there were no significant concerns found about the profitability, the option is acceptable for GSK.
Finally, the investment opportunity is feasible for GSK. The company will not need to invest in the development of the vaccine, which reduces the associated costs. GSK has decreased its financial leverage during the past three years, which implies that it can utilize debt to finance capital investments. Finally, GSK may be the only company in Europe that can adhere to the increased requirements of society regarding the quality of vaccines due to its high-quality raw materials, latest innovations, and high-skilled personnel.
Thus, it is recommended that GSK accepts the option of increasing the production of the COVID-19 vaccine, as it is a suitable, acceptable, and feasible option.
Limitations of the Analysis
Even though the present report demonstrated that the opportunity is beneficial for the company, there are some limitations that should be acknowledged. First, the analysis is based upon assumptions that may be flawed for a wide variety of reasons. For instance, it is unclear how much the company will spend on production in raw materials and indirect labor costs. The estimations were made based on gross profit margin analysis and a critical review of the annual reports.
Second, the analysis does not take into consideration possible risks. For instance, the company will lose at least £200,000 million if lobbying fails, and the continuation of the project will be impossible. At the same time, it may be possible that the Euro Commission will buy more vaccine doses from GSK than the assumed 60 million. Thus, the results of the analysis can be improved by applying relevant risk assessment techniques.
Finally, the assessment does not take into consideration the depreciation of the new equipment that will be used to produce the vaccine. Moreover, it fails to acknowledge the depreciated value of this equipment as part of the profitability analysis. Thus, the calculations can be improved using additional assumptions.
Conclusion
The present report revealed that GSK has a strong strategic and financial position in the European healthcare industry. However, it faces significant threats from the outside environment due to growing sustainability concerns and distrust of vaccines in society. The breakeven, NPV, IRR, and payback period analyses demonstrated that GSK should consider using the opportunity to increase its market share by producing additional doses of the COVID-19 vaccine. The option was found to be suitable, acceptable, and feasible. However, the limitations of the analysis should be acknowledged before making the final decision.
References
Drug Watch. (n.d.). GlaxoSmithKline (GSK)
European Commission. (2021). Safe COVID-19 vaccines for Europeans. Web.
Flynn, M.K. (2020). M&A wrap: AstraZeneca, Sanofi, J&J, GSK, Blackstone, Carlyle, TA, Centerbridge, AEI, Genstar, Alera, Race for vaccines. The Middle Market. Web.
GSK. (2019). Annual report 2018. Web.
GSK. (2020a). Annual report 2019. Web.
GSK. (2020b). GSK actions to support the global response to COVID-19. Web.
GSK. (2021a). Sanofi and GSK initiate new Phase 2 study of their adjuvanted recombinant protein-based COVID-19 vaccine candidate. Web.
GSK. (2021b). Annual report 2020. Web.
Hayes, A. (2020). Breakeven analysis. Investopedia. Web.
Mahase, E. (2020). Covid-19: Demand for dexamethasone surges as RECOVERY trial publishes preprint. BMJ, m2512.
Meredith, S. (2021). Doctors baffled as countries suspend use of AstraZeneca vaccine over blood clot fears. CNBC. Web.
Mondol, P. (2019). Performance analysis of GlaxoSmithKline Bangladesh Limited. Web.
Sullivan, T. (2018). GSK Chinese bribery scandal ends in $489 million fine, executive sentenced. Policy Med. Web.
Appendices
Appendix A: GSK’s Pro-Forma Financial Statements and Financial Ratios

Appendix B: AstraZeneca’s Pro-Forma Financial Statements and Financial Ratios