Introduction
In efforts to maximize profits, organizations need to be grounded on factors such as costs, factors that are seminal in determining the profitability of the firm. Costs are generally categorized into two; fixed and variable costs. Variable costs are those that vary with production while fixed costs are constant. Examples of fixed costs are rent and salaries while those for variable costs in a firm’s operations include fuel and power costs. Fuel costs are vital in most firms, given that transport is a necessary component indispensable to most firms’ operations. Fuel is also used when the firm is involved in production activities such as the generation of electricity.
Transport companies utilize fuel depending on the size of their fleet and the rising demand for their services. In this essay, the author will graphically analyze the output or quantities transported and costs incurred by the company. The output will be taken as the number of trips or the number of vehicles that are in transit against the costs incurred to carry out the operation. All of these factors contribute to the average and total costs of the firm. They thus influence the cost structure curves in the long run and the short-run (Granderson, 2001).
Short Run Cost Structure Curves
The short-run is a period in a firm during which no major changes in resources can be implemented apart from adjustments to improve production. During this period, at least one facet of input is fixed while the others are variable. To understand the cost structure when the cost of fuel depreciates in the short run, one needs to consider the different costs that vary in tandem with output and how they influence the cost structure (Nuclear Energy Institute, 2010).
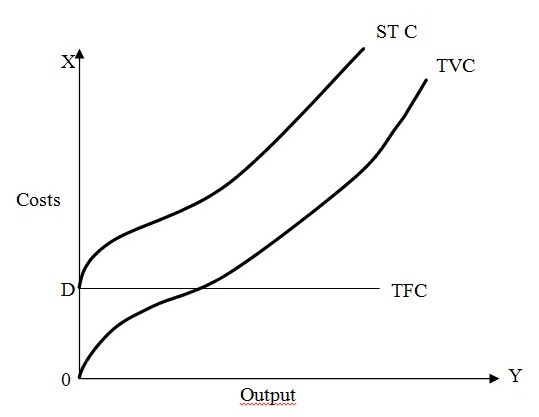
The graph above explains the behavior of costs in the short run when production is zero. Output is zero but the firm has already incurred set-up costs. This explains the Total Fixed Costs (TFC) at “D” and the Total Costs (TC). The Total Variable Costs (TVC) stands at zero since the costs begin to vary when production starts.
When the market price of fuel decreases, it is clear from the graph that there will be a corresponding decrease in the cost of fuel for the firm in the short run which will vary with production. Thus, there might be an increase in production marked by an increase in total output. The formula below captures this vividly:
STC= STVC+ TFC
Where:
- STC = Short Term Costs,
- STVC = Short Term Variable Costs, and
- TFC = Total Fixed Costs
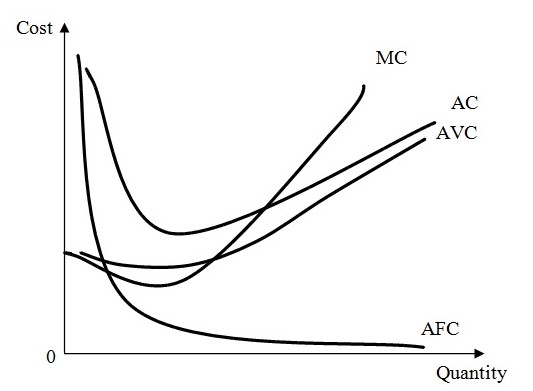
The graph above also depicts the behavior of short-run average costs and short-run average variable costs. This is together with marginal costs in the short run. When the marginal costs incurred through an increase in production fall, what results is a decrease in average costs. Likewise, an increase in marginal cost leads to an increase in average cost (Transtutors, n.d). The formula below highlights this relationship:
- Short-run AVC is the variable cost/output.
- AVC = short run TVC/output.
- Short-run AFC is the fixed cost/output.
- AFC = TFC/ output
Given that total fixed cost (TFC) is constant throughout the short run, AFC will decrease with an increase in output. This accounts for the slope of AFC in the graph above.
- Short-run ATC is the total cost/output.
- Short run ATC = short run TC/output = (STFC + STVC)/OUTPUT = SAFC +SAVC
Average Variable Cost (AVC) will decrease with an increase in output. The law of diminishing marginal product dictates that Average Variable Cost (AVC) will increase after a certain value of production is attained. It is pertinent to note at this juncture that AVC is a mirror image of the average product curve. A decrease in the price of fuel will result in minimal changes in the short run. Only the variable costs may increase; costs such as AVC and ATC (Transtutors, n.d).
Long-Run Cost Structure Curves
The long run is a period in the firm when all the inputs can be varied. All costs can likewise be varied during this period. A decrease in the price of fuel, in the long run, will result in increased levels of production. This will lead to an increase in other inputs to cater to the increased output. This is especially so because the other factors of production such as labor and capital are related such that a change in the quantity of one is reflected in the others. As such, if for example there is an increase in the quantity of labor, this will affect the other factors of production. However, the marginal costs will not increase at the same rate since one of the inputs (fuel), has reduced in cost (Transtutors, n.d).
This will increase AVC, ATC, and Marginal Costs. Using the graph below, the behavior of the different costs can be shown when there is a decrease in the fuel price.
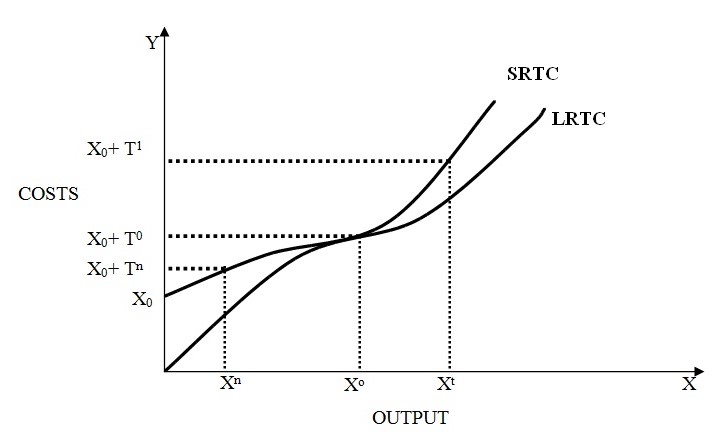
The short-run cost curve above depicts a production firm that has one variable only. However, the long-run cost curve depicts a situation where all inputs are variable in the long run. There are some costs that are not fixed; they can be varied without any constraint. This behavior in cost structure curves implies that the decrease in the price of real energy leads to a new total cost curve which is directly below the original one (Mixon & Tohamy, 2009).
The lower curve represents the long-run total cost while the one above shows the short-run total cost. The appearance of the curves is an indication that the cost of fuel influences other factors of production and in extension, can be viewed as dependent on these other factors of production.
In the long run, a firm may desire to make use of the reduction in fuel costs to increase output. For example, the firm may increase the size of its fleet. In the short run, the firm concentrates on maximizing its profits and thus only minimal changes are carried out in the fixed factors of production. Only variable costs are altered considerably to intensify output levels (Mixon & Tohamy, 2009).
The graph above shows that a decrease in real energy prices, in the long run, will have greater impacts on the output and costs incurred by a firm. A company will increase its output but at a marginally lower cost. The AVC and ATC will increase but the AFC will remain constant in the short run. In the short run, reduction in fuel costs will not have a great impact since the firm is focused on the maximization of profits (Production and Cost, n.d).
In the long run, the AFC might increase. This can be attributed to the reduced spending on fuel, increase in asset portfolio, and expansion of the firm. The marginal costs, in the long run, will hence increase.
Comparison of a Firm’s Short-Run Input Price Elasticity of Fuel and its Long Run Input Price Elasticity of Fuel
The firm’s long-run response to the decline in energy prices will be higher than the response in the short run. This implies that in the short run, the input price elasticity is very low while it is moderately lower in the long run. The cost of fuel may not influence the demand for transport significantly. This is because demand for transport does not respond significantly to changes in the prices of fuel. The firm’s costs may increase in the long run as a result of increased fixed and variable factors of production (Granderson, 2001). This will be attributed to the increase in fuel costs. The firm will then focus on costs of production to maximize profits. This will lead to more output, increased transport and as a result, increased average and total average costs. The firm may achieve all of this at a relatively lower marginal cost.
The firm can incur costs of adding new fleets and disposing of old ones. This greater effect can also be observed when a firm expands business to other regions that it was hitherto not operating in. This is what is likely to be achieved in the long run (Granderson, 2001). There will be a heightened desire to utilize transport as a result of the reduction in the cost of fuel. The firm may not post an increase in many of the costs incurred in the short-run (Granderson, 2001). The variable costs are the only ones that are likely to increase as a result of increased output, and this will call for more inputs. The marginal cost will fall in the short run but increase in the long run (Granderson, 2001).
Why the Short-Run Cost Curve Lies Above the Long Run Curve
The aim of firms in the short run is to maximize profits while minimizing costs at the same time. The firms are faced with constraints in selecting capital since this factor of production is constant. But they can select labor with no constraint. In the long run, firms have no constraint on capital and aim at maximizing short-run profit by making choices in the capital. The long-run average costs are less than those in the short run. When multiplied by the quantity, it reveals that the long-run costs are less than the short-run costs. This explains why the short-run cost curve lies above the total cost curve (Granderson, 2001).
References
Granderson, G. (2001). Cost structure and the measurement of economic performance: Productivity growth, utilization, cost economies and related performance indicators. Web.
Mixon, J. & Tohamy, S. (2009). Cost curves and how they relate. Web.
Nuclear Energy Institute. (2010). Costs: Fuel, operation and wasted disposal. Web.
Production and Cost. (n.d.). Production and cost. Web.
Trans Tutors. (n.d). Costs of production and the organization of firms. Web.