Industry: Machine Tools & Accessories
Flow International Corp.
Highlights
- Economic performance of the industry flow international has the highest market capitalization among the industry players such as Kennametal incorporated, and Mag Giddings and Lewis. The industry is performing very well economically as their products are in high demand. However, the entry of some competitors into the industry is reducing the profits of the company. The cost of materials to manufacture equipment is going up and it is affecting the profitability of industry players. Many companies in the industry have opted to increase the prices of their goods for them to perform well.
- The cost of doing international business has changed drastically because of the financial crisis, which affected various economies. In economies where the financial crisis had not taken root, the industry players in that country are performing well.
- The environment of doing business for the industry players has changed because of the increase in cost of production, which they should strive to reduce. If the cost remains high then the company will be forced to increase prices something which will affect the company profitability in long run. The company needs to engage in cost-cutting strategies thus helping the company grow.
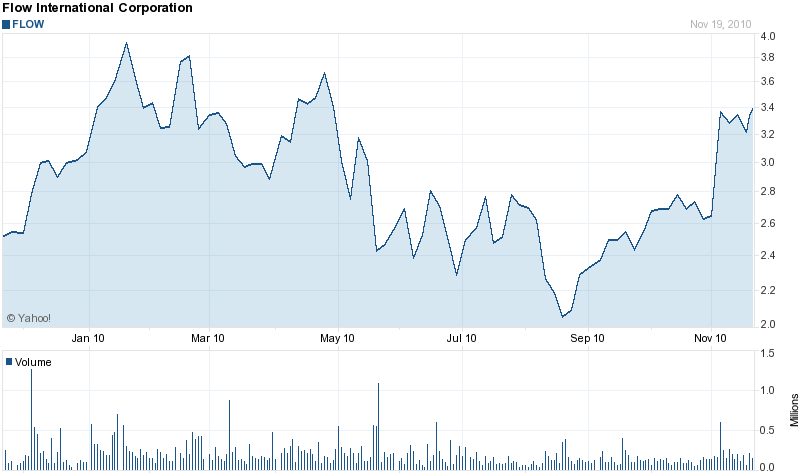
- Target price: From our investment analysis, we are targeting a price of 3.5, which is above the market price currently as shown in the chart below.

Investment Summary
The price we are expecting at the end of the investment period is $ 3.50 that is above the market price today and the free cash flow valuation rate. The main reason why our price we expect it to be higher is because of the trend we are observing in the market especially in the manufacturing sector where our products are heavily used. The trend in the financial crisis has also given us hope that the share of the company will be very high. Rapid fluctuations in their prices could complicate the firm’s operations and minimize its short-term liquidity. There is a cost of production, which is another risk that the firm is fighting. Inflation is highly felt in the domain of capital expenditure, which in essence limits the rate of investment on other projects. The company has therefore put more emphasis on minimizing the cost of production through optimization and prioritization.
The firm closely monitors changes in the interest rates, especially for the European countries so as a hedge. To address liquidity, Flow International has got a developed management structure designed to maintain an appropriate solvency level. The liquidity risk comprises all the risks brought about by the firm’s lower purchasing power usually resulting from cost escalation, energy price fluctuations, taxes, and customs payments.
In some circumstances, the company demands prepayment for all the products supplied. All these strategies are put in place to minimize credit risks in cases where counterparties are unable to pay for the commodities supplied by Flow International.
Flow International Company currently boasts of its global market position due to its adoption of proper corporate and strategic management strategies. These strategies help it in identifying its strengths, weaknesses, opportunities, threats, and react to them to suit the prevailing situation. Its profitability especially in America has been attributed to the fact that it enjoys a large market share. These factors coupled with its established market niche act as barriers to entry for any other company wishing to explore the American machinery and tools sector. To make the American community feel a sense of ownership in the firm, it actively participates in corporate social responsibility activities for societal benefit (Shapiro, 523).
The company has been the major exporter it is been affected by the inflation rates that are taking place in various parts of the world. It is important to note that the exchange rate between Europe and USA plays an important role in determining the value of this company. It means that our investment will not in any way be affected. Considering the price changes that have taken place in the company shares, it is clear that the trend of the upward trend will be maintained. The prices of the shares of the company have been compared with the others in order to come up with this decision.
Valuation
The free cash flow approach has been used in this case to find the valuation of the company in question. Free cash flow, when the valuation objective is the firm, is defined as the cash available to debt- and equity holders after investment. As the dividend model is essentially equivalent to the earnings model, the FCF model that follows is equivalent to the earnings-based model where the valuation objective is the value of the firm. To illustrate the free cash flow approach.
The problem with this definition in the general case is that, as previously noted, the breakdown between new and replacement investment is rarely provided. Only the total cash for investment is given in the statement of cash flows. Upon reflection, however, the total investment is really the amount we want. There is no need to use depreciation expense, or any other surrogate for that matter, to estimate the cost of replacing depreciated assets. Using the dividend growth model the price will be as
P= DIV (1+g)/KE-g
Whereas P is price, DIV is the dividend, g is growth and Ke is the company cost of capital.
Thus, the dividend expected in period n is equal to the most recent dividend times the compound growth factor (1+g) n.
The critical assumption in this valuation model is that dividends per share are expected to grow perpetually at a compound rate of g. for some companies; this assumption may be a fair approximation of reality.
Converting this to Earnings per share with a growth model, one can easily go from dividend valuation to price/earnings ratio valuation. Suppose a company retained a constant portion of its earning each year, call it b. the dividend-payout ratio also would be constant:
1 – b = D1/E1
Where E1 is earnings per share in period 1
P0 = ( 1 – b) E1/Ke – g
Where P0/E1 is the price/earnings ratio based on expected earnings in period 1.
However, in our case the b is zero leaving the model as
P0 = ( 1 – 0) E1/Ke – g
We can find Ke using Capital Asset Pricing Model.
Ke = R + bsRm-R
Where
Ke = Estimated on the stock
R = estimated return when the market return is zero
Bs = Measure of stock’s sensitivity to the market is zero
Rm = return on the market portfolio.
Assuming a risk-free rate of 2.75% and from finance yahoo the beta is 2.08 and the market of the S & P 500 is 9%. Therefore it will be
Ke = 2.75% + 2.08 (8%- 2.75%)
Ke = 2.75% + 2.08 (8%- 2.75%)
= 13.67%
Retained Earnings and Dividend Growth
Without external financing, the source of dividend growth is the retention of earnings and the return on this retention, namely the return on equity (REO). By retaining earnings, a company can invest the funds and, as a result, would be expected to earn more than it did the year before. In turn, a higher dividend would be expected to be paid. If there were no retention and all earnings were paid out as dividends, there would be no net investment. In our idealized world, we implicitly assume that an amount equal to depreciation is invested to maintain the earnings of the company. Net investment is an investment over and above depreciation, and it is possible only with retention.
Growth can be estimated using profitability as 6%
Thus
P0 = ( 0.2)(1+0.06)/ 0.1377 – 0.06 = 2.73
G = b X ROE
As before, 1-b is the dividend-payout ratio.
It depends on the opportunities available for investment and their likely return. For most companies, a perpetual growth model is inappropriate. Typically, both the rate of return on equity and the retention rate change over time. The import of the above, however, is that the retention of earnings growth; external financing and increased returns on equity through better capital investment opportunities also are sources.
The advantage of the FCF approach is that many of the issues relating to differences in accounting policies and of income versus cash flows disappear. Whether or not the accounting method defines something as CFO or cash from investment does not make any difference treated as principle or interest also does not matter as all payments to creditors are excluded from free cash flow.
The remaining problems relate to whether or not to treat an item as operating/investment or financing.
Risks to Your Price Target
The risks, in this case, are classified into several categories namely strategic risks, financial risks, legal risks, operational risks, environmental risks, and finally the geological risks. Several precautionary measures have been put in place to minimize the effects of risks on the entire business and its cash flow.
These include macroeconomic, country risk, inadequately qualified staff, and competition, access to transport and related infrastructure, and marketing and manufacturing risks. The macroeconomic risk is brought about by the ongoing global financial crunch and the extremely slow recovery rate. If not checked, the macroeconomic risk may greatly affect Flow International Incorporated’s liquidity level, business transactions and incapacitate its capability to implement scheduled programs.
To mitigate the probable effects of macroeconomic risks, Flow International Incorporated regularly reviews its product prices, exchange rates, inflation margins, etc to suit the prevailing macroeconomic situation. To minimize exposure to such risks, the firm intends to diversify and maximize its operations through acquisitions in otherwise safe nations to compensate for the losses suffered through operations in unstable regions (Fischer and Jordan, 86).
Other strategic risks are caused by the growing shortage of highly qualified and experienced personnel at the global level. Such threats have forced Flow International Incorporated Company to increase the salaries for such personnel at the expense of its financial performance to retain them.
The regulation has been imposed on machines and tools companies to cater to issues revolving around rigid anti-trust laws and associated enforcement practices. The American government has defined legal procedures that act as guidelines to regulatory agencies and address incidences of violation and non-compliance.
The government of America has with time developed strategies to regulate the market prices for machines and tools products within the local market. This is aimed at harmonizing the prices to be in tandem with the variations in the world market. Such government policies have the general effect of lowering Flow International Incorporated’s manufacturing margin and in turn affect its performance. In this regard, Flow International Incorporated has established an internal committee to request the government to reconsider this aspect.
The current level of customs control coupled with high customs duties has negatively affected Flow International Incorporated’s profitability and financial performance. The high export duties for machine and tools products are attributed to the current deficit level of America’s national budget caused by the bailout program by President Obama. Based on the firm’s current liquidity level, any changes in the current laws governing exchange control could complicate export transactions and affect its present liquidity level.
The other risks that are associated with the business of the company are the entrance of new multinationals from the Middle East such as petrochemical industries from Saudi Arabia. A company that is currently enjoying the international market because of government support and availability f resources from petroleum.
Industry Overview and Competitive Positioning
The machines and tools industry to which Flow international belongs will be significantly influenced by several external trends namely the continuing practice of maintaining off-shore facilities to take advantage of cost benefits and emerging markets; the use of industry-standard platforms; and growth of alliances. Subsequently, another significant external development is the robust worldwide demand growth forecast for products in the next five years. In terms of threats, the most compelling is the global economic recession that continues to wreak havoc in economies and intense competition from companies fighting for market shares. In addition, Flow international had identified several other external threats that could significantly affect its business operations and these are:
- Political factors and government regulation – as an international company, Flow international remains vulnerable to political risks coming from the governments in different countries and regions;
- Changes in tax provisions – the U.S. government exerts a strong influence over the company in matters about income tax provisions;
- Technology threats and terrorist events – as a global company with a highly reputable brand name, Flow international considers international terrorist activities and technology security threats as challenges to its sustainability;
- Patent infringement – Flow international is careful of protecting intellectual property and patent issues since the company has various technology and R&D collaborations with other technology firms;
Given the external factors identified above, the external factor matrix can be constructed as seen in Table below. Because of its potential to provide substantial income to Flow international, the robust forecasted demand for company is rated among the highest opportunities. Consequently, the opportunity to establish and maintain offshore design facilities; developing emerging technologies and industry-standard platforms are also vital for technology companies to remain competitive. On these aspects, Flow international has performed well since the company operates facilities in Asia:
Table: External Factor Matrix for Flow international.
On the threat side, the global economic recession and intense competition remain among the most important factors.
Porter’s Five Forces Model
Michael Porter of the Harvard Business School developed a framework to analyze the competitive nature of industry namely the Five Forces Theory. In this framework, the industry is examined concerning the bargaining power of suppliers, the threat of entrants, the bargaining power of buyers, the threat of substitutes, and intensity of rivalry. In the industry to which Flow international belongs, each of the five forces exerts a strong influence that further intensifies the rivalry in these industries. For example, since buyers are susceptible to economic turbulence, they tend to choose companies that could offer products with the best value and cost.
However, manufacturing companies in these industries rely on critical supplier inputs and technologies to produce their products, and hence, companies would need to negotiate and strike good relationships with suppliers to gain the best quality products possible and the lowest costs feasible. Although these industries tend to have high entry barriers due to the capital-intensive nature and immense technological specialization required to operate in them, the existing players continue to rapidly churn out products and services such that buyers have a lot of product substitutes and options to choose from. Given this scenario, companies that intend to succeed and thrive in these industries should develop the capability to produce high-value, yet affordable products and services.
Internal Factor Evaluation
Internally, Flow international is strong in several aspects. For one, the company has shored up sufficient financial resources to develop new products and expand into new markets. Flow international also has very strong brand recall and recognition, thus allowing it to gain customer loyalty. Furthermore, the company adheres to a strong culture of product development and R&D initiatives, which allow it, create innovative products customers want. Subsequently, the company enjoys strong supplier relationships, having established ties with many technology inputs and raw material providers.
However, on the downside, the company needs to improve on its cost-cutting measures and production efficiencies, particularly after the company undertook massive mergers and acquisitions beginning in 2002. The acquisition severely strained the company’s operating capabilities; resulted in overlapping products; and drained the company of funds due to excessive marketing. Fortunately, the chief executive officer (has already started instituting cost-cutting and product consolidation strategies when he took over.
Given the company’s strengths and weaknesses, an internal factor evaluation matrix can be constructed as seen in Table below:
Table 6: Internal Factor Matrix for Flow international.
Strengths, Weaknesses, Opportunities, and Threats (SWOT)
Given the strengths and weaknesses of Flow international, one can already plot generic entry strategies using the SWOT Matrix. Essentially, the SWOT matrix addresses four strategic issues or concerns namely:
- The Strengths-Opportunities Matrix: This matrix addresses the issue of how can Flow international use or maximize its strengths to generate strategies to take advantage of opportunities in the environment.
- The Strengths-Threats Matrix: This matrix addresses the issue of how can Flow international use its strengths to generate strategies to counteract threats in the environment?
- The Weaknesses-Opportunities Matrix: This matrix addresses the issue of how can Flow international eliminate or minimize its weaknesses to generate strategies to take advantage of opportunities in the environment.
- The Weaknesses-Threats Matrix: This matrix addresses the issue of how can Flow international eliminate or minimize its weaknesses to neutralize the threats in the environment.
In particular, the Table below details the strategies that Flow international can implement given its strengths and weaknesses in relation to the opportunities and threats in the industry. For the strengths-opportunities (SO) matrix, the company can implement the following: a) penetrate and expand into current and emerging markets; enter into strategic alliances to take advantage of shared resources and expertise, and develop new technologies.
For the Strength-Threats (ST) matrix, the company may do well by developing new products and concepts; strengthening ties with commercial and institutional clients; strengthening patent protection; and implementing financial audits. Consequently, for the Weaknesses-Opportunities (WO) matrix, Flow international can conduct an organizational audit and implement new production management techniques to address its cost-efficiency concerns. Lastly, for the Weaknesses-Threats (WT) matrix, the company should streamline business processes and focus on markets and clients that offer the most rewarding financial return.
Flow international SWOT Analysis.
Recommended Strategy
The SWOT matrix yielded 11 possible strategies that Flow international can implement. To determine, the best corporate-level strategies, it would be proper to refer to Michael Porter’s Three Generic Strategies of Differentiation, Cost Leadership, and Focus. Under the prevailing economic environment and given the company’s strengths and weaknesses, the most appropriate strategies for Flow international are the ones that will allow it to derive immense customer loyalty and these could be accomplished through differentiation and cost leadership. Differentiation requires Flow international to develop products and services superior to the competition and that customers truly want. Consequently, cost leadership requires that Flow international undertake efficient production and operational practices. Thus, of the 11 possible strategies, three alternative strategies were chosen namely:
- develop new products and services,
- apply new production techniques, and
- trengthen ties with clients.
Using the Quantitative Strategic Planning Matrix (QSPM), the most compelling strategy to implement among the three identified strategies is the application of new production techniques with a total attractiveness score (TAS) of 6.92. Consequently, the second-most appropriate strategy to undertake is developing new products and services with a TAS of 5.97, while the third most compelling strategy to initiate is strengthening ties with clients with a TAS of 4.38. The decision to place the most importance on implementing the application of new production techniques is due to the following reasons:
- The company needs to first address its cost issues to compete effectively in the industry. The company has already developed a culture for creating quality, innovative products and this has allowed it to establish strong brand recall. However, the unstable economic environment has weakened demand, thus buyers have come to prioritize more on cost and value, rather than technological sophistication in purchasing technology items;
- Flow international has spent enormous amounts of money through its acquisitions over the last decade. Thus, it has become more compelling for the company to focus on financial stability in the long term;
- The competitive environment in the industry has changed. Instead of focusing on proprietary technologies and capital-intensive technology developments, the trend is now towards creating open platforms, sharing resources with other firms; and operating offshore facilities to gain cost advantages.
Financial Analysis
Financial ratios can be grouped into five types: liquidity, debt, profitability, coverage, and market value ratios. No one ratio gives us sufficient information by which to judge the financial condition and performance of the firm. Only when we analyze a group of ratios are we able to make reasonable judgments. We must be sure to take into account any seasonal character of a business. Underlying trends may e assessed only through a comparison of raw figures and ratios at the same time of year.
Although the number of financial ratios that might be computed increases geometrically with the amount of financial data, we concentrate only on the more important ratio. Computing unneeded ratios add both complexity and confusion to the problem. One can use the balance sheet and income statements of Flow international. A third accounting of cash flows is taken up in the presentation of audited financial results, a statement of cash flows, is taken up in.
Liquidity ratios are used to judge a firm’s ability to meet short-term obligations. From them, much insight can be obtained into the present cash solvency of a company and its ability to remain solvent in the event of adversities. Essentially, we wish to compare short-term obligations with the short-term resources available to meet these obligations.
Current ratio
The higher the ratio, supposedly, the greater the ability of the firm to pay its bills. The ratio must be regarded as a crude measure of liquidity, however, because it does not take into account the liquidity of the individual components of the current assets. A firm having current assets composed principally of cash and current receivables are generally regarded as more liquid than a firm whose current assets consist primarily of inventories. Consequently, we must turn to “finer” tools of analysis if we are to evaluate critically the liquidity of the firm.
Quick Ratio
A somewhat more accurate guide to liquidity is the quick, or acid test, ratio:
This ratio is the same as the current ratio, except that it excludes inventories – presumably the least liquid portion of current assets – from the numerator. The ratio concentrates on cash, marketable securities, and receivables about current obligations and thus provides a more penetrating measure of liquidity than does the current ratio.
Debt Ratios
Extending our analysis to the long-term liquidity of the firm, we may use several debt ratios. The debt-to-equity ratio is computed as shown below
Total debt/Shareholders’ equity
For Flow International, the ratio is
$ 1,454,859/$ 1,796,621 =.81
When intangible assets are significant, they frequently are deducted from shareholders’ equity.
The ratio of debt to equity varies according to the nature of the business and the volatility of cash flows. An electric utility, with very stable cash flows, usually will have a higher debt ratio than will a machine tool company, whose cash flows are far less stable. A comparison of the debt ratio for a given company with those of similar firms gives us a general indication of the creditworthiness and financial risk of the firm.
In addition to the ratio of total debt to equity, we may wish to compute the following ratio, which deals with only the long-term capitalization of the firm.
Long-term debt/Total capitalization
Where total capitalization represents all long-term debt, preferred stock and shareholders’ equity. For Aldine, the ratio is
$ 630 ,783 /$ 2,427,404=.26
This measure tells us the relative importance of long-term debt in the capital structure. The ratios computed here have been based on book-value figures; it is sometimes useful to calculate these ratios using market values. Debt ratios tell us the relative proportions of capital contribution by creditors and by owners (Brealey, Myers and Marcus, 53).
Cash flow to debt and capitalization
A measure of the ability of a company to service its debt is the relationship of annual cash flow to the amount of debt outstanding. The cash flow of a company often is defined as the cash generated from the operation of the company. This is defined as earnings before interest, taxes, depreciation, and amortization (EBITDA). The cash flow –to-total-liabilities ratio is simply.
Cash flow (EBITDA)/Total liabilities
For Flow International, the ratio is
$ 511,065 /$ 1,454,859 =.35
The cash flow is composed of earnings before taxes, $ 341,282, plus interest, $ 85,274 and depreciation, $ 111, 509. This ratio is useful in assessing the creditworthiness of a company seeking debt funds.
Cash flow (EBITDA)/Long-term debt
Here we have the following for Flow International
$ 4=511,065/$ 630,783 =.81
This ratio is used to evaluate the bonds of a company. The two cash-flow ratios just described have proven useful in predicting the deteriorating financial health of a company.
This is particularly helpful in corporate restructuring, where heavily levered transactions occur. Another ratio sometimes used in this regard is total interest-bearing debt and equity about operating cash flows.
Total borrowings + Equity/Cash flow (EBITDA)
For Flow International, this ratio is
$ 2,875,912 / $511,065= 5.63
Where bank loans, notes payable, and long-term debt represent total borrowings. The higher this ratio, the greater the value that is being placed on the securities. Lenders in highly levered transactions become concerned when the ratio exceeds eight, as the possibility of default is significant at this point.
Market–Value Ratios
Several widely used ratios relate the market value of a company’s stock to profitability, to dividends, and to book equity.
Price/Earnings Ratio
The price/earnings ratio of a company is simply
P/E ratio = Share price/Earnings per share
Where earnings per share (EPS) usually are the trailing 12 months of earnings. However, security analyst sometimes uses estimated EPS for the next 12 months. Suppose Flow International has a share price of $ 32. With a par value of $ 2 per share at 2010 fiscal year-end.
The P/E ratio was described as one measure o relative value. The higher this ratio, the more the value of the stock that is being ascribed to future earnings as opposed to presents earnings. That is to say, likely future growth is what is being valued. During the last 20 years, the P/E ratio for standard & poor’s 500 stock index has ranged from 8 to 24. The ratio reflects several things including interest rates, growth expectations for stocks in general and investor risk aversion, all of which were taken up.
Works cited
Brealey, Richard, Myers, Steward, & Marcus, Alan. Fundamentals of Corporate Finance. New York: McGraw-Hill Irwin, 2007.
Fischer, Donald. & Jordan, Ronald. Security Analysis and Portfolio Management. New Delhi: Prentice-Hall of India Private Limited, 2007.
Shapiro, Alan. Foundations of Multinational Financial Management. New York. John Willey & Sons, Inc, 2002
Figure 1: Income Statement in millions. Source: Company Documents, Student Estimates.
Figure 2: Balance Sheet in thousands. Source: Company Documents, Student Estimates.
Figure 3: Statement of Cash Flows in millions. Source: Company Documents, Student Estimates.