Abstract
This paper analysed the relationship between Stock Returns and three ratio variables that include the Price Earnings ratio, Dividend Price ratio, and the Payout ratio. In this case, Stock Return is the dependent variable while Price Earnings ratio, Dividend price ratio, and Payout ratio are the independent variables. The analysis was based on the Hong Kong Stock Market. Besides, the research paper reviewed existing relationships between individual industries trading in the Hong Kong Stock Market and their own financial data. The analysis established the investors’ behaviour from the findings in the analysis of each accounting ratio. The analysis was based on the regression with a sample of 31 firms from the Hong Kong Stock Market. For ease of analysis, the sample firms were grouped into Banking and Finance, Trading and Logistics, Real Estate, and Tourism and Retail sectors. The study was not a magic bullet in the relationship between accounting ratios and Stock Return in the Hong Kong Stock Market. Rather, other factors and market dynamics were incorporated in making the eventual investment decision. The research methodology for this study involved the use of quantitative research approach and statistical study design in order to gain a rich understanding of financial ratios and how they relate with Stock Returns. Secondary data was gathered from financial statements of these 31 companies. The researcher adopted a convenient sampling design as it was deemed the most appropriate sampling design for this study. Data was analysed using SPSS and was presented in tables and graphs. Throughout this study it was found that there was no relationship existing between accounting ratios and stock returns. This resulted from the statistical analysis that was done. This research has also revealed other research
Introduction
Introduction
This chapter basically introduces the entire research. It gives the entire dissertation a theoretical background with regards to ratio analysis. This chapter also gives an overview of the Hong Kong Stock Market, indicates the research problem, the research purpose, the research questions, the significance of this research and the limitations to this research.
Research Background
Ratio analysis can be defined as a qualitative financial analysis of a company’s financial statements (Aivazian, Booth & Sean 2003, p.371). Essentially, financial statements are prepared at the end of a certain trading period. These periods may be annually, semi-annually or even quarterly-based (Alexander & Britton 2005). Such financial statements include the balance sheet, the trading profit and loss account (the income statement) and the cash flow statement (Burns et al. 2013). The items and sub-items listed on these financial statements are used for analysis. Ratio analysis reveals the relationship between items that are listed in the financial statements (mostly the balance sheet and the income statement); this is foreseen by combining and comparing some ratios over others (Allen & Ivo 2000, p. 2499). These calculations are then used to indicate the various aspects of the operations of a business and also its performance (Al-Malkawi 2005). The main objective for conducting ratio analysis in companies is to evaluate liquidity, profitability, solvency and the efficiency of these companies (Jain 2006). Liquidity is defined as the ability of a company to settle its obligations as they fall due to the company’s current assets (Antonio & Ivo 2000, p. 2536). Profitability, on the other hand, refers to the ability of a business to continue generating profits from its operations over a particular trading period; this basically refers to the viability of that particular business (Astrid & Giancarlo 2006, p. 41). Efficiency is defined as the ability of a company to finance its operations given the operating expenses (Davids & Forest 2014). Solvency of a firm means the ability of a firm to continue operations without winding up (Bolton & Xavier 2000, p. 234). Ratios are compared across companies operating in the same industry or sector in order to gain comparative insights on the relationship between the accounting ratios and returns (Bratton 2002). The calculated financial ratios “are used to indicate the trend towards a company’s financial performance and its operations- whether it is deteriorating or improving” (Capar & Kotabe 2003, p. 345). Comparative valuations of firms operating in the finance industry cannot be without ratio analysis. There exist numerous financial ratios but users of financial information are particularly interested in the ratios they are familiar with and are able to calculate (Contractor 2002). Such ratios include the current ratio, the price earnings ratio, the debt to equity ratio, the return on equity ratio and the dividends payout ratio. These are most preferred by investors since they are easy to calculate (Coyne et al. 2010, p.631).
Different industries have ranges for these ratios. Financial analysts in these industries will consider a company to be either overvalued or undervalued if the calculated financial ratios of that particular company fall out of the range established within its industry (Demarzo & Yuliy 2006). For example, if in a certain company the acceptable price earnings ratio lies at the range of 30-40, but the calculated P/E ratio is 25, the company would be declared as being undervalued. On the other hand, if the calculated P/E ratio is way above the range (that is 30-40), the company may be regarded as being overvalued. It is important to note that comparative valuation of ratios is only possible for companies operating in the same industry since the range in one company might be high for another company due to the differences in ratios such as debt to equity ratio across the sectors (Deshmukh 2003, p. 351). Ratio analysis can signal warning and impeding dangers in the financial operations and performance of a company. Financial analysts always do an extensive analysis of financial statements of the respective companies they are hired to analyse in order to gain insights on the situations that may drastically affect the operations of a company (Dodd & Graham 2010).
Established companies have solidified ratios in all areas of their operations. As such, hints of weakened operations in one aspect or area of such companies may lead to a change in the investment decisions such as selling of stake or stock. As such, ratios are relevant within industries and sectors (Erhardt 2008, p. 27).
Financial ratios indicate comparisons between financial accounts or statements. This information is important as it is used by the management, investors, employees, lenders and stockholders to understand how a particular business is performing (Fama 2002). This enhances the company to make viable investment decisions and also to rectify areas that require improvements in order to avert losses that may be as a result of inefficiencies. Ratios are commonly used to analyze businesses as they are easier to compute and understand (Farinas & Lourdes 2000). Financial ratios are used by analysts for comparison of financial information for companies operating across different sectors. It is also important to note that financial tools do not consider the size of a company as well as the size of the industry while calculating ratios since financial ratios are basically fundamental computations meant to ascertain the financial position and performance of a company (Fishman 2007). Ratios are used to compare both big and small companies across different industries. Such comparisons help to identify the weaknesses and strengths of these companies and, therefore, can be used for other aspects of analysing a business. A good example for the aforementioned scenario is when the ratio analysis is applied in the study of the SWOT analysis (French 2001). Apart from the four aforementioned subdivisions of financial ratios, there are other two categories of ratios and these are the investment leverage and the market prospect ratios (Maskell & Baggaley 2003).
Ratio analysis is a vital tool for analysing financial performance of a firm. In financial analysis the most common financial ratios include the liquidity ratios, profitability ratios and the investment ratios. Series of past research studies have been carried out to focus on the relationship between the stock returns and the accounting ratios as primary variables (Fulghieri & Dmitry 2001, p. 43). Most of these studies have focused on the Western stock market. However, there is no past study on the relationship between returns in stock within the Hong Kong Stock Market and the accounting ratio variables such as the Price Earnings ratio, Dividend Price ratio, and the Payout ratio.
This study focused on stocks of companies within the banking and finance, trading and logistics, real estate, and tourism and retail sectors trading in the Hong Kong Stock Market. It was critical to carry out an analysis in these sectors since they have direct impact on the Hong Kong Stock Market and contain the major companies trading in this stock market.
Project Research Problem
It was important to review the relationship between stock returns and the three variables (Price Earnings ratio, Dividend Price ratio, and Payout ratio) within the Hong Kong Stock Market. The findings may reveal the actual reasons motivating investment decisions in the companies trading in the Hong Kong Stock Market.
Purpose of the Research
The purpose of this research project was to establish the underlying motives prompting investors to invest in different stocks within the Hong Kong Stock Market as influenced by the Stock Returns.
Objectives of the Study
The general objective of this study was to analyze the relationship between accounting ratios and returns.
Specific Objectives of the Study
To analyze the relationship between the Stock Returns and the Price Earnings ratio of companies operating in Hong Kong within the three sectors of study.
To analyze the relationship between Stock Returns and the Dividend Price ratio for the three sectors of study.
To analyze the relationship between Stock Returns and the Payout ratio for the three sectors of study.
Research Questions
The research project was limited to the following questions:
- What is the relationship between Stock Returns and the Price Earnings ratio of companies operating in Hong Kong within the three sectors of study?
- What is the relationship between Stock Returns and the Dividend Price ratio for the three sectors of study?
- What is the relationship between Stock Returns and the Payout ratio for the three sectors of study?
Research significance
The findings of the research project are beneficial to investors within the Hong Kong Stock Market in making investment decisions based on Stock Returns over a period of time. Besides, the recommendations made may enable the companies trading in the Hong Kong Stock Market to adopt the most sustainable financial models to win the confidence of investors. The findings of this research are also useful to other users of accounting information such as the management of the firms which were studied (those that trade in the Hong Kong stock market), lenders, employees and the stockholders since it will enable them know the current success of these companies in terms of the profits generated and also the operating efficiency. Managers will, therefore, be able to make decisions that may help their corporations avert and mitigate risks that may be as a result of operating inefficiencies, which are indicated by the calculated financial ratios.
Limitations of the research
The study was not a magic bullet in the alteration of investor behaviour as related to Stock Returns. It only provides structures that must be combined with the values and goals of different investment options influenced by the performance of each of the accounting ratios. Therefore, the firms and investors cannot implement the recommendations of this study without reflecting on external and internal dynamics within the Hong Kong Stock Market. Also, in the research process, the researcher had difficulties in the data collection process due to vagueness of the data that was required and the scope of the data as well since the researcher was required to group the studied companies into four sectors. This may deter a clear understanding and illustration of the relationship between accounting ratios and return in the companies studied within Hong Kong market. The researcher was also faced by financial constraints and time constraints. In contrast to the proposed financial budget for this research, the actual budget for this research was high and costly as well since the data collection process was extensive and the researcher was required to study a total of not less than 50 companies. The researcher was also faced by time constraints in the sense that the process for data collection was lengthy and time consuming in contrast to the proposed time plan.
Literature review
Introduction
This chapter reviews the literature relevant to the topic of this study and is related to both the dependent variable and the independent variables of this study too. Therefore, the aim of this chapter is to give this study a theoretical literature review. Empirical literature relevant to the topic for this study is unavailable since no research similar to this has ever been conducted in the Hong Kong Stock Market. A total of 60 literature sources were reviewed in order to give this study a firm theoretical background. Several past researches have been carried out to establish the relationship between the Stock Returns and accounting ratio variables such as Price Earnings ratio, Dividend Price ratio, and Payout ratio within different stock markets across the world (Frank & Vidhan 2007). However, there is no study to establish this relationship within the Hong Kong Stock Market. This research, therefore, aimed at filling the above research gap. Literature review section is an indispensable part of a research project; this is due to the fact that it enables the researcher to have a rich background on the topic being studied (Gibbons 2004).
Theoretical Literature Review
Dividend Payout Ratio
This ratio basically states the value of profits or earnings that are distributed to the shareholders as dividends in a particular period of the year (Goldstein, Nengjiu & Hayne 2007, p. 483). It indicates the proportion of profits retained by the company for reinvestment purposes and the proportion of profits distributed by the company to shareholders as dividends. Users of financial information, more particularly the investors, are interested with Dividend Payout ratio as they would like to know to what extent a certain company is serving to fulfil the main objective for the investors to invest in otherwise the shareholders wealth maximisation (SWM) (Graham 2003, p. 1075). Companies in the earlier stages of start-up often do not pay dividends since such companies require lots of funds to finance their expansion and thus they would have no excess profits to give to shareholders as dividends. An example of such a company is the Apple Computers, a company operating in the computer line of businesses. Apple Computers was incorporated and formed in earlier 1970s but paid first batch of dividends to its investors recently in the year 2012. Conversely, there are companies that always like to attract and lure investor’s (Grullon & Bhaskaran 2002). Such companies pay higher dividends so as to appear as if being more profitable to potential investors. Investors will interpret such companies to continue to be profitable in order to sustain dividend pay-outs and pay higher dividends as a way of retaining and attracting investors. Dividend payout ratio is calculated by dividing the value of total dividends by the net income of a particular company (Gugler & Burcin 2003, p. 470). This simply means dividing the dividend per share (DPS) over earning per share (EPS). These formulae give the total dividend payout ratio which is then reported on the income statement. These two formulae give the same answer but the latter formula is the most preferred as it is easier to get these values from the income statement, to calculate it and also to understand it. A high dividend payout ratio indicates that the company is more profitable and that there will be stability of its earnings over a particular period. Users of financial information will be more interested in a consistent dividend payout ratio trend rather than the level of the dividend ratio, be it high or low (Graham & Campbell 2001, p.187). Investors will assume that the dividend payout ratio trend will continue for a number of years. For instance, investors may take it that a company that has been issuing 15 percent of dividends to its shareholders will continue issuing dividends at 15 percent for the next ten years. To this end, they will use it to interpret that the company is not profitable, and they may shun from investing in such companies. Conversely, investors will assume that a company that has been paying higher dividends to its investors such as 40 percent of its earnings will continue to pay dividends as such and thus they will be attracted to this company as opposed to the latter as it seems to be more profitable. Paying of high dividends indicates high operating performance, while declining dividend ratio indicates low and poor performance. Dividend payout ratio is guided by the dividend policies adopted by a company (Hart & Bengt 2002). Some companies adopt dividend policies that are based on the rule that no profits are to be distributed to the shareholders as dividends; rather, these profits are to be reinvested in the operations of the company. An example of such dividend policy is the residual policy that is mostly seen as a policy meant to increase shareholders wealth. Dividends are either paid inform of cash or stock (Harte 2001, p. 1079). When paying dividends inform of stock, it means that the retained earnings are converted into ownership stake or shares. Stock payment is basically undertaken in the form of bonus or rights issue. With bonuses, the stockholder is awarded extra shares which are capitalized from the retained earnings. On the other hand, a rights issue gives a shareholder the freedom to purchase extra shares at a discounted price from the normal selling price. The number of shares an investor is given to purchase at a discounted price are the rights (Hennessy & Whited 2007).
Dividend Payout Decision
Generally, a company is obligated to pay dividends inform of cash, but if it is constrained by finances, a company may opt to pay stock dividends. Payment of dividends inform of cash involves a book-keeping transaction. In the balance sheet the value indicated as retained earnings is transferred to ordinary share capital (Hennessy 2004, p. 1717). Another important dividend decision is that a company may also decide to buy back its outstanding shares in cash instead of issuing cash dividends. Such a decision in financial terms is referred to as stock repurchasing. The shares purchased back by a company are referred to as treasury stock. If only a portion of these outstanding shares are bought back by a company, a portion of the outstanding shares will remain un-purchased. Assuming that this kind of transaction has no adverse effects on the retained earnings of a company, the EPS (earning per share) of the remaining outstanding shares will increase (Kieso & Weygandt 2007). Such an increase in The EPS may lead to an increase in the market price per share (MPS) and, therefore, the dividends will substitute the capital gains. A company can use stock repurchasing to undertake crucial decisions such as restructuring of the capital structure by changing the proportion of equity to debt. However, there is a drawback to stock repurchasing in the sense that lack of perfect information may lead to selling of shares at a lower price than the market price (Morellec 2004, p. 270). Dividend decisions are the most important basis for making financial and investment decisions for companies. Dividend decision is a plan of action adopted by a company’s management in order to alter its capital structure (Labardin & Marc 2009, p. 1150). For instance, if a company pays high dividends to its shareholders, it will increase leverage in its capital structure as the company seeks to go to the market to borrow for more funds for reinvesting.
Dividend Policies
A company can adopt any of the following four dividend policies which are used to guide their dividend decisions. One of such policies is the residual dividend policy. With such a policy, the company issues no dividends at all but rather will reinvest all of its profits after financing its operations (Mocciaro et al. 2012, p. 87). The retained profits are used to finance and make new financing and investment decisions such as expansion of the existing line of business, acquisition of new business and restructuring of the existing capital structure of the business. Capital structure consists of a mixture of debt and equity that provide capital for financing a business. The other dividend policy is the fixed dividend policy. With this policy, a company has to issue a constant amount of dividends for a number of years regardless of the earnings generated. The other dividend policy is the constant payout ratio. This policy means that a company will have to pay a constant amount of dividend such as 15 percent of its total earnings. The dividend per share will change as the earning per share changes (Myra 2003). The last dividend policy that companies adopt to make dividend decisions is the constant dividend per share plus an extra. This policy is seen as a compromise between the constant payout ratio and the fixed amount of dividends policy. Here a company is given the freedom of flexibility to increase its dividend payout in periods of high profits. The extra dividend paid to the shareholders is perceived as not being a commitment to the part of the company to continue issuing the extra dividend to shareholders in the future as the profits fluctuate (Myers 2000, p.1005). To solve the dividend puzzle, managers of companies will have to have to adopt a relevant dividend policy which would optimize the shareholders wealth and in the long run increase the company’s share value (Oldroyd & Dobie 2008).
Price Earnings Ratio
This is a ratio that indicates the market prospects of stock. It values a stock in relation to its earnings. This ratio is calculated “by dividing market price per share (MPS) by the earnings per share (EPS)” (Ruigrok & Wagner 2003). In simple terms, this ratio indicates the value of stock in the market given its current earnings. Investors and other users of accounting information use price earnings ratio to evaluate and predict the value for fair market price of a stock using its earnings per share. It is most likely that companies with high future earnings per share will have stock with increasing value and will always pay high dividends. Investors will help to increase the stock’s value through speculation since they use current earnings per share to calculate the value they would pay for stock. Price earnings ratio is often seen as a multiple ratio as investors uses it to calculate the value of a share. Ideally, it is how many times its worth is. This ratio is calculated at the end of a trading period when financial reporting is done since financial statements will give the figures needed to calculate the price earnings ratio (Sheridan & Tsyplakov 2007). The market price value of shares is equal to the trading value of these shares as is reported in the financial statements. When analyzing companies with price earnings ratio, financial analysts are able to infer that a company with high price earnings ratio indicates a positive trend towards future performance. Conversely, a company with low price earnings ratio indicates a deteriorating future performance (Shliefer & Vishny 2003, p. 12). Investors will shun from investing in companies with low price earnings ratio.
Dividend Price Ratio
The Dividend Price ratio is also referred to as the dividend yield. It indicates the value of the dividends distributed to shareholders who hold ordinary shares; this is expressed relatively to the market price value of shares (Strebulaev 2007, p. 1747). Investors use dividend yield to indicate the returns generated by their investment. These returns may either be in form of stock or cash. Investors are always interested with maximization of their wealth (Tchisty 2005). Payment of dividends is guided by the respective dividend policies as discussed above. Stocks that attract regular dividend payments are referred to as income stocks while stocks that have no dividend payments are referred to as growth stocks (the earnings that ought to be distributed as dividends are reinvested to the business). Dividend yield is calculated by dividing the dividend per share (DPS) with the market price per share (MPS) (Virginia & Reed 2010, p. 5).
Methodology
Introduction
This chapter will consist of the methodology that the research used to conduct this study while trying to determine the relationship between accounting ratios and return on 31 companies listed in the Hong Kong Stock Market. A research methodology is basically a way to systematically solve a research problem (Virginia & Reed 2010). This chapter also stipulates the systematic research approach, procedure and techniques that the research used in collecting, gathering and analyzing data and the expected findings.
Research approach
This research was carried out courtesy of quantitative approach. Use of the quantitative research approach facilitated the understanding of the dynamics surrounding the ratios and the Stock Returns. This approach created room for further analysis using different and divergent tools for checking the degree of error and assumption limits. Quantitative research approach involves the generation of data for a rigorous quantitative analysis (Kotabe & Srinivasan 2002, p. 79). This can take three forms; inferential approach, simulation approach and experimental approach. Inferential approach involves formation of database from a sample and making of inferences of characteristics or relationships in a given population (Kundu 2003, p. 5). Experimental approach has a greater control of the research environment vital in in manipulating certain variables (Sannikov 2007, p. 25). The simulation approach will involve construction of an artificial environment within which relevant information and data will be generated (Powell 2001, p. 890). Following this is the creation of mathematical models to represent a dynamic process. A research approach will systematize the entire research and give directions (Kundu 2003). The research approach chosen affects the results generated, giving the solution to the research problem and the conclusion for the research findings (Kundu 2003). After adopting a quantitative research approach, the research adopted a statistical study design. Sannikov (2007) suggests that this design is in accordance to the scope of the study whereby it involves the identification of a few samples from a population. The sample analysis would help in making inferences or estimates of the population parameters. This requires the use of statistical techniques in order to test the hypothesis (Rhodes-Kropf & Viswanathan 2003)
Sampling Frame
According to Sannikov (2007), a sampling frame is basically a list of the target population arranged in a predetermined order before sampling is done. In this study, the researcher arranged the target population according to the industries where the companies operate in order to make the sampling frame for sampling (Powell 2001). To conform to the sampling procedure that was adopted by the research for this study, the researcher calculated the sample size as a percentage of the target population which is illustrated below by the sampling frame table following the 1972 formula. This calculation has been illustrated below in the sampling size subsection.
Table 3.2 Sampling Frame
Sampling Procedure
Throughout this study the researcher used convenient sampling in selecting the 31 firms within the three sectors. The main reason behind the use of convenience sampling technique was that it was the most convenient sampling design to the researcher in terms of time, distance and finances (Jain 2006). Powell (2001) suggests that convenient samples are a form of non-probability samples that are unrestricted. Convenience sampling is the least reliable sampling design among all the other sampling designs, but is normally adopted since it is the cheapest and the easiest sampling design among all others (Powell 2001). It is referred to as convenience sampling since the researcher has the freedom to choose the source of data provided that this data serves the purpose of the study and also fulfils the objectives of the study. It is important to note that convenience sampling is still a useful sampling procedure though there are no controls to ensure precision while using it (Sannikov 2007). Such a procedure is often adopted to either test the ideas of a certain subject under study or even to gain ideas of an area of interest. Convenience sampling may also be used in the initial stages of exploratory research especially when the researcher is seeking guidance in order to gain insights of the topic under study (Myra 2003). This is owed to the fact that the data collected might be overwhelming and, therefore, unnecessary to adopt complicated sampling procedures such as stratified sampling and multi-stage sampling among others.
Sample Size
To generate the sample size for this study population, the research adopted the following formula created in 1972.
n=N/ (1+N (e2))
Where:
- N= Target population
- e= Degree of freedom
- n=31/ (1+31*0.052)
- n=31/1.0725
- n= 29
According to the Central Limit Theorem (CLT), if the sample size is large than 30 percent of the population, as is the case in this study, X-bar is approximately normally distributed, regardless of the shape of the population. This suggested sample population is, therefore, suitable for the study (Sannikov 2007).
After comparing the number of companies in each industry studied in the Hong Kong Stock Market, the research noted that the real estate industry had more companies than all the other industries. The target population had a total of 31 companies, but this had to be reduced to 29 companies to make the sample size according to the calculation above. Therefore, two companies in the real estate sector were not studied as determined by the use of convenience sampling since this was the sampling design for this study. These companies were CK Hutchison Holdings Company Ltd and Hang Lung ppt Company.
Table 3.4 Sample Size
Data Collection
The research opted to use data sources from the internet since the data was readily available (Jain 2006). The source of data had certain advantages over primary data. First, the required information was obtained with speed and at a less cost as compared to primary data. Secondly, the source of data was efficient as there was no need for going to the field and having investigators to acquire the necessary information. Tchisty (2005) indicates that the researcher has to adopt great care while using secondary data to enhance accuracy particularly for statistical analysis and the manipulation of data. It is also important for the researcher to know the reason for the compilation of such data, the source and the objectives of why the original information was gathered (Powell 2001). Secondary data provides an alternative source of information especially when it is impractical to gather primary data (Sannikov 2007).
Data analysis
The collected data was coded and passed through Statistical Package for Social Sciences (SPSS) (version seventeen). In the process, cross tabulation was used to compare and contrast the relationship between the ratios and Stock Returns. In order to quantify the relationship between the independent and dependent variables, regression analysis was essential besides figures, charts, and tabular representation of the investigation (Fama 2002). In order to aid the regression analysis, software such as Google Docs, Excel, SPSS, and EViews were used.
In the regression analysis, the following assumptions were considered.
That the regression line was fitted to data at R2=>60%; that the individual significance of the variable (most of the independent variables was individually significant) uses t-test and set the reject level for p-value at 5%; that the independent variables can jointly explain dependent variable with the reject level for p-value was at 5%; that the sign of the coefficients followed economic theory or experiences of others (literature review) or intuition; that no serial or auto-correlation in the residual (serial correlation is a statistical term used to describe the situation when the residual is correlated with lagged values of itself); that the variance of the residual was constant (Bruesch- Pegan-Godfrey test were employed here); and that the residuals were normally distributed (this was verified by use of Jarque Bera Statistic and if the p-value was less than 5%, the researcher rejected null hypothesis and accepted the alternative hypothesis).
Regression model
In order to review the correlation between Stock Returns and ratio variables, ordinary least square regression was used. Below is the formula for the model:
Y = α + β1X1 + β2X2 + β3X3
Where:
- Y = Stock Return (dependent variable).
- α =Value of Y at the point where explanatory variables’ values are zero.
- β =Parameter indicating average alteration in Y; associated with each unit alternation in variable X.
- X= Independent Variable.
In relation to the Hong Kong Stock Market, X1 will represent the Dividend Price ratio, X2 will represent the Price Earnings ratio, and X3 will represent the Payout ratio. Statistically, regression analysis is defined as a process of estimating the relationship between research variables (Davids & Forest 2014). When analysing the influence of the independent variables over the dependent variable, several techniques for regression analysis are adopted. With the above equation, regression establishes the value of the dependent variable (Y), when the independent variables (X) are fixed (Sannikov 2007).
Other models and formulas
Formulae for calculating the Stock Return, Price Earnings ratio, Dividend Price ratio, and the Payout ratio are summarized below.
Dividend Price Ratio
In order to calculate this ratio, the research obtained prices for the sampled firms on a monthly basis for a period of 12 months running concurrently. Data was obtained from the Hong Kong Stock Market website (Whited 2005, p. 1001). The formula for calculating this ratio is:
- Dividend Price Ratio = Dividend per Share / Price per Equity Share
Payout Ratio
Payout ratio is a reflection on the annual earnings that companies pay shareholders (Williams 2010). A Low payout ratio means that the company might have adopted residual dividend policy whereby no earnings are distributed to shareholders as dividends but rather funds are retained for reinvestment purposes. On the other hand, a high ratio means that a company is consistently paying out earnings to shareholders as dividends following the dividend policy adopted by that particular company (Williamson 2002). Data that was used was obtained from the Hong Kong Stock Market website. The formula for calculating this ratio is:
- Payout Ratio =Dividend per share/ Earnings per share
Stock Return
Stock return represents the return on a unit of investment. In this case scenario, calculation of investment ratio was done through the dividend adjusted approach (Williams 2010). Data was obtained from the Hong Kong Stock Market website. The formula for calculating this ratio is:
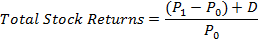
Where; P0 is the initial stock price, P1 is the ending stock price, and D is the dividends.
Price Earnings Ratio
High Price Earnings ratio is an indication of growth in the expected earning in future while low price earnings ratio indicates the opposite (Alexander & Britton 2005). Data for this was obtained from the Hong Kong Stock Market website. The formula for calculating this ratio is:
- Price Earnings Ratio = Market Value per Share / Earning Per Share (Sannikov 2007).
Data Presentations
While explaining the relationship existing between accounting ratios and Stock Returns in the Hong Kong stock market, the research presented the data collected in tables and graphs in order to explain the correlation and regression between dependent and independent variables for this study.
Results
It was expected that the ratios have direct but different relationships to Stock Returns within the Hong Kong Stock Market.
Data Presentation, Analysis & Interpretation
Introduction
The research used secondary sources of data to conduct this study. Data was collected from the Hong Kong’s Stock market website with an aim of finding out the relationship between the accounting ratio and return. This chapter presents data from a total of 31 companies that were targeted as listed on table 4.2, but data analysis was done for 29 companies which were included in the sample. The data that the research collected revealed the relationship existing between accounting ratios and return (Harte 2001). This was after conducting an extensive analysis of the variables of this study, both dependent and independent. The dependent variable was Stock Return while the independent variables were the Dividend Price ratios, the Payout ratios and the Price Earnings ratios. Following the formulae illustrated on chapter 3, SPSS was used to analyse the obtained data for the sampled companies. Excel enabled the researcher to calculate the three aforementioned ratios, and SPSS was used to establish the relationship between the Stock Return and the variable ratios courtesy of the correlation and regression analyses (Whinston 2002, p. 17).
Data Analysis for the Period ending 2014
Dividend Price Ratio
Dividend price ratio = (Dividend per share or DPS)/ (Price per equity or PPE)
Therefore, taking the Bank of China SS as our firm of interest for analysis, the below calculations were computed.
DPS = Dividends/Number of shares, and Dividends = Net income x Dividend ratio (Dividend yield)
Thus, from the income statement, the net income for this firm is equivalent to $169.595 billion.
Therefore, the Dividends = 169,595×0.046 = $ 7.801 billion. On the other hand, the number of shares is given as 410.5984 billion. Therefore, the DPS = 7.801/410.5984 = 0.19
The PPE is shown in the Bank of China SS’s financial statement as 4.13.
Therefore: Dividend price ratio = 0.046 or 4.6%
The results of the calculations for the other firms are shown in the table 4.2 below.
Payout Ratio
Payout ratio= (Dividends per share)/ (Earnings per share) (Sannikov 2007)
Therefore, taking the Bank of China SS as an example, DPS = 0.19, and the Earnings per Share (EPS) = 0.0059 or 0.59%.
Thus, the Payout ratio = 0.19/0.59
= 32.26
The results for the other firms are shown in table 4.2 below.
Price Earnings Ratio
The price earnings ratio (PE) was calculated using the equation below:
PE= (Market Value per Share)/ (Earnings per share) (Tchisty 2005)
While taking the Bank of China SS as an example for computation, EPS = 0.0059 and the Market Value per Share stands at 0.042.
Therefore, the PE = 0.042/0.0059
= 7.13
The results for the other 29 firms are shown in the table 4.2 below.
Stock Returns
To obtain the stock returns, the formula below was applied.

From the balance sheet, P0 = $360.476 billion, P1= $ 279.365 billion and D = $7.80137 billion.
Therefore,
Total Stock Returns = [360.476-279.365)+7.80137]/279.365
= 0.25
The results for the other firms are obtained from the table 4.2 below.
Dividend Price Ratio, Payout Ratio, Price Earnings Ratio and Stock Returns Values
Table 4.2 below shows the firms found in the Hong Kong Stock Market including their Dividend Price ratio, the Payout ratio, the Price Earnings ratio and Stock Returns values. These values for these companies were calculated from the financial statements and more so from the income statement of the 29 companies that were sampled.
Table 4.2 Dividend Price Ratios, Payout Ratio, Price Earnings Ratio and Stock Returns Values
4.3 Correlation between Stock Returns and Ratio Variables
The correlations between the Stock Return and the ratio variables for the firms were determined using the regression model below.
Y = α + β1X1 + β2X2 + β3X3
In relation to the Hong Kong Stock Market, X1 represented the Dividend Price ratio, X2 will represented the Price Earnings ratio, and X3 will represent the Payout ratio. When variables are correlated, it means that these variables are interdependent. Correlation coefficients are used for the computation of correlation. These correlation coefficients range between +1 and –1 as suggested by Weber and Stevenson (2000, p. 596). When the correlation of certain variables is perfectly positive, it means that if one variable has an upward trend, the other variable will also have an upward trend. Ideally, the variables move towards the same direction (Jain 2006). When the correlation of certain variables is perfectly negative (-1), it means that if one variable moves up, the other variable automatically moves down. In a synopsis, the variables move in opposite directions. It is important to note that when the variables have zero correlations, these variables are declared to have no correlation between them. It is important to note that variables that have perfect correlation are rarely found in applicable the real life situations (Myers 2000).
Interpretation
From the summary analysis in table 4.3 above, it is evident that there is no correlation between Stock Returns and the Dividend ratio of the studied companies operating in the Hong Kong Stock Market since the correlation (-0.003) is way less than -1 or 1. This is echoed by the p-value (0.99) which is big (>0.05), meaning that the correlation is insignificant. Similarly, the correlation between the Stock Returns and Payout ratio is insignificant (p-value = 0.182 and correlation coefficient = -0.265). Also, there is no correlation between Stock Returns and the Price Earnings ratio since the p-value (0.311) is much greater than 0.05, and the correlation coefficient is -0.195 (nearly zero and hence no relationship).
Regression Analysis to Predict Relationship between Stock Returns and Ratio Variables
For the regression analysis, three graphs were plotted in order to predict the kind of relationship that exists between the Stock Returns and the variable ratios. These graphs are as presented below. These graphs helped to indicate, if any, the kind of relationship existing between the dependent variable (the Stock Returns) and the independent variables (the Dividend Price ratio, Payout ratio and the Price Earnings ratio) for this study.
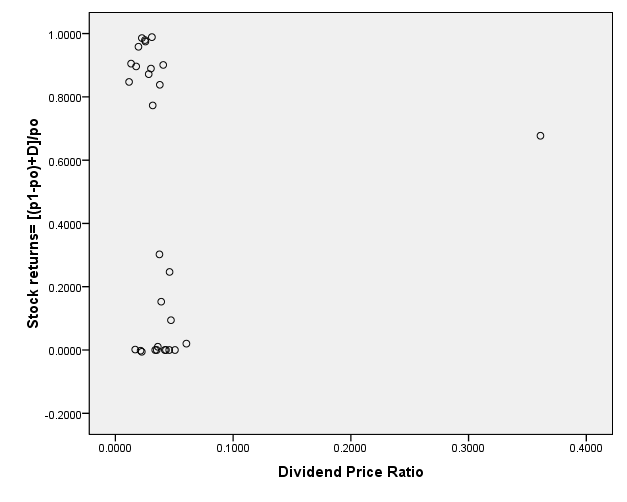
Relationship between Stock Returns and Dividend Price Ratio
In order to gain an understanding of the relationship existing between the Stock Returns and the Dividend Price ratio, regression analysis for these variables was conducted. Stock Returns was the dependent variable and thus plotted on the Y-axis while the Dividend Price ratio was the independent variable that was plotted on the X-axis. This is illustrated as shown in the graph 4.4.1 below.
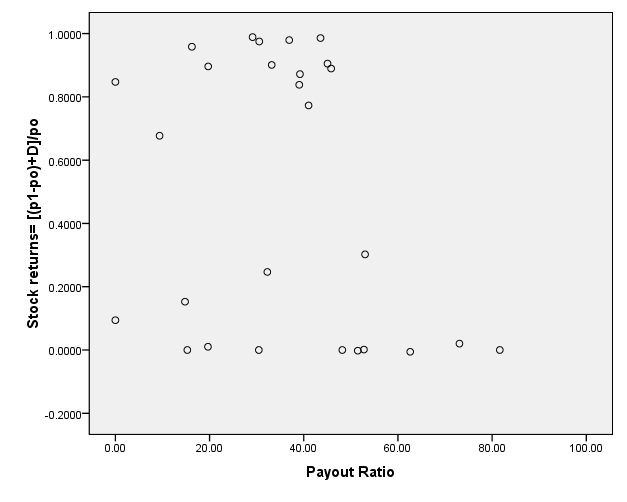
Relationship between Stock Returns and Payout Ratio
In order to gain an understanding of the relationship existing between the Stock Returns and the Payout ratio, regression analysis for these variables was conducted. Stock Returns was the dependent variable and thus plotted on the Y-axis while payout ratio was the independent variable, plotted on the X-axis. The result of the plot is indicated in the graph 4.4.2 below.
Relationship between Stock Returns and Price earnings Ratio
In order to gain an understanding of the relationship existing between Stock Returns and the Payout ratio, a regression analysis for these variables was conducted. Stock Returns was the dependent variable and thus plotted on the Y-axis while Price Earnings ratio was the independent variable plotted on the X-axis. The result of the analysis is illustrated in the graph 4.4.3 below.
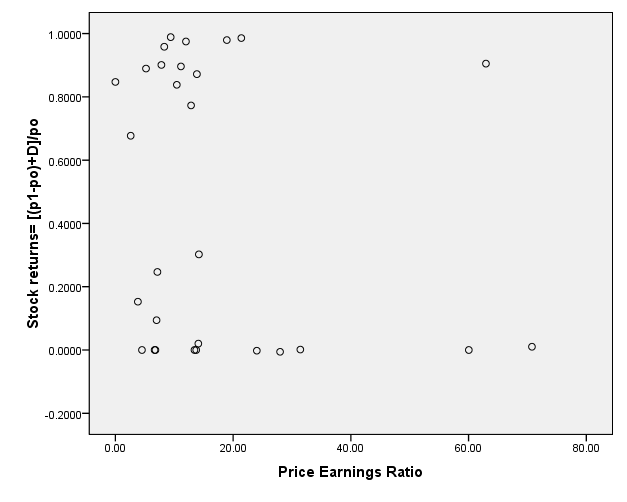
From the graphs above, it is evident that we cannot draw any relationship between the Stock Returns and the variable ratios. This echoes our initial findings on correlations analysis.
Summary of the Regression Analysis
Table 4.5 below gives a summary of the regression analysis for the variables above (table 4.2), revealing the coefficients for the regression model above (Y = α + β1X1 + β2X2 + β3X3 ).
As such, α = 0.757, β1=-0.544, β2= -0.006 and β3= -0.003.
Therefore, on replacing the coefficients to the model we get;
Y= 0.757-0.544X1-0.006X2-0.003X3.
Interpretation of analysis
Correlation and regression were used to establish the relationship between accounting ratios and returns. From the financial statements of the companies that were sampled, the Dividend Price ratio, Payout ratio and Price Earnings ratio and the Stock Returns were calculated. These are as summarised in table 4.2 above. This data was gathered from secondary sources that were obtained from the website. The research then conducted statistical analysis using regression and correlation of the variables of this study. This was done in order to gain insights of the influence of the independent variables for this study. Therefore, the findings of this study will be based on these analyses.
It is important to note that the research variables for this study had a near-null correlation; this means that there is no relationship between the Stock Returns and the variable ratios. The regression analysis also echoed the fact that there is no relationship between the analysed parameters as indicated by the graphs above (4.4.1, 4.4.2 and 4.4.3). Ideally, from the graphs, it is clear that there is no relationship that can be drawn from the analysed variables. The regression model, Y= 0.757-0.544X1-0.006X2-0.003X3, is important for forecasting, an important information for potential investors; nonetheless, this model cannot be adopted since there are no correlations existing between the Stock Returns and the variable ratios.
The researcher was, however, satisfied with the Hong Kong Stock Market since more research gaps were revealed by this study as no such study has ever been conducted on Hong Kong Stock Market previously.
Key Findings, Conclusion and Recommendations
Introduction
This chapter discusses the key findings from this study, the conclusion and also gives recommendations that are related to the topic for this study which is the relationship between accounting ratios and Stock Returns (Myra 2003). The research also suggests areas for further research since a few research gaps were revealed when studying the Hong Kong Stock Market. The findings, conclusion and the recommendations have also been discussed as per the objectives while at the same time trying to answer the research questions that prompted this study.
Key Findings
Objective 1
The first objective that prompted this study was to analyze the relationship between the Stock Returns and the Price Earnings ratio of companies operating in Hong Kong Stock Market within the three sectors of study. Through the analysis of data collected from the Stock Market website and presented on table 4.3 above, it was found that there is no correlation between Stock Returns and the Price Earnings ratio of the studied companies operating in the Hong Kong Stock Market since the correlation (-0.195) is way less than -1 or 1. This was echoed by the p-value (0.311) which is bigger (>0.05), meaning that the correlation is insignificant. When using correlation coefficients and analysis to determine the relationship that exists between variables of study, correlated variables exhibit correlation coefficients that range between +1 and -1. In this scenario, it means that there is no correlation between Stock Returns and Price Earnings ratio. The research also used regression analysis to establish the relationship between Stock Returns and the Price Earnings ratio. From regression analysis graph (4.4.3) illustrated above, it is clear that there is no relationship between Stock Returns and Price Earnings ratio. The graph consists of values of Stock Returns and Price Earnings ratio that cannot be plotted on a straight line after which extrapolation would follow to indicate the relationship between these variables.
Objective 2
The second objective that prompted this study was to analyze the relationship between Stock Returns and the Dividend Price ratio for the three sectors of study. Through the analysis of data collected from the Stock Market website and presented on table 4.3 above, it was found that that there is no correlation between the Stock Returns and the Dividend Price ratio of the studied companies operating in the Hong Kong Stock Market since the correlation (-0.003) is way less than -1 or 1. This was echoed by the p-value (0.99) which is bigger (>0.05), meaning that the correlation is insignificant (Huergo & Jordi 2004). If the correlation between Dividend Price ratio and Stock Returns indicated values that were skewed towards either positive 1 or negative 1, then it could have been concluded that the two variables, the Stock Returns and the Dividend Price ratio, are related. If the correlation was positive it would mean that Stock Returns and Dividend Price ratio relationship was in the same direction and if the correlation was negative it would mean that the relationship existing between Stock Returns and Dividend Price ratio is an inverse relation. The research also used regression analysis to establish the relationship between Stock Returns and Dividend Price ratio. From the regression analysis graph (4.4.2) illustrated above, it is clear that there is no relationship between Stock Returns and Price Earnings ratio. This is owed to the fact that the graph consist of values of Stock Returns and Dividend Price ratios that cannot be plotted on a straight line after which extrapolation would follow to indicate relationship between these variables.
Objective 3
The third and last objective that prompted this study was to analyze the relationship between Stock Returns and the Payout ratio for the three sectors of study. Through the analysis of data collected from the Stock Market website and presented on table 4.3 above, it was found that there is no correlation between Stock Returns and the Payout ratio of the studied companies operating in the Hong Kong Stock Market since the correlation (-0.265) is way less than -1 or +1. This was echoed by the p-value (0.182) which is bigger (>0.05), meaning that the correlation is insignificant. If the correlation between Dividend Price ratio and Stock Returns indicated values that were skewed towards either positive 1 or negative 1, then it would have been concluded that the two variables, the Stock Returns and the Payout ratio, are related (Ehrhardt 2008). The research also used regression analysis to establish the relationship between Stock Returns and Dividend Price ratio. From the regression analysis graph (4.4.3) illustrated above, it is clear that there is no relationship between the Stock Returns and the Payout ratio. This is owed to the fact that the graph consist of values of Stock Returns and the Payout ratios that cannot be plotted on a straight line after which extrapolation would follow to indicate a relationship between these variables
Conclusion
Following the key findings, the researcher was able to draw the conclusion for this study. These conclusions are also based on the research objectives for this study.
Objective 1
There is no relationship between the Stock Returns and the Price Earnings ratio for the sampled 31 companies presented for this study. High Price Earnings ratio is an indication of the growth in the expected earning in future while low price earnings ratio indicates the opposite (Strebulaev 2007, p. 1747).
Objective 2
There is no relationship between the Stock Returns and the Dividend Price ratio for the sampled 31 companies presented for this study. Dividend Price ratio is also referred to as the dividend yield (DY). Dividend yield indicates the value of dividend returns for every pound or equity in form of cash invested in the company (Myers 2000).
Objective 3
There is no relationship between the Stock Returns and the Payout ratio of the studied companies following the data collected for the 31 companies that were sampled for this study. Payout ratio is a reflection of the annual earnings that companies pay shareholders (Williams 2010). A Low Payout ratio means that the company might have adopted residual dividend policy whereby no earnings are distributed to shareholders as dividends, but rather funds are retained for reinvestment purposes. On the other hand, a high ratio means that a company is consistently paying out earnings to shareholders as dividends following the dividend policy adopted by that particular company (Myers 2000). Dividend Payout ratio shows the proportion of profits that was paid out to shareholders as dividends and also the proportion of profits that was retained by the company for reinvestment purposes (Jain 2006). Dividend decisions are guided by the respective dividend policies adopted by different companies (Graham & Campbell 2001). A dividend policy is basically a rule that is followed in order to determine the amount of profits to be paid to shareholders as dividends and the amount of profits to be retained by the company, if any, for reinvestment purposes (Kundu 2003). A dividend policy outlines when to pay dividends and also how much is to be paid out (Creswell & Miller 2000). It is important to note that dividends can either be paid inform of cash or stock. The latter is meant to increase shareholders wealth in the company thus serving to fulfill the shareholders main goal for investing in any company. To this end, the main goal is to enhance SWM (shareholders wealth maximization) (Kieso & Weygandt 2007). The different dividend policies include the residual dividend policy, fixed dividend per share policy, and ‘constant’ plus extra dividend policy or surplus (Harte 2001, p. 1079).
Recommendations
The researcher, through the review of data from the financial statements and also from the findings, recommends that in order to gain insights concerning the relationship between accounting ratios and Stock Returns it is important to consider the following highlighted points.
More ratios ought to be used for analyzing the financial information of companies in order to gain an understanding of the financial ratios and their influence over Stock Returns. These other ratios include the liquidity ratios, efficiency ratios, profitability ratios and the solvency ratios.
From a financial perspective, it is also recommended that analysts ought to use ratios that are simpler and easier to calculate and understand. This is due to the fact that users of financial information such as managers, investors and financiers would like to know the financial performance of companies that they have interests in investing in.
It is also recommended that an investigation of the relationship existing between accounting ratios and Stock Returns such as this one to use both historical information and projected financial information; this will allow simulation of mathematical models that will give room for manipulation of research variables and will also enable financial analysts to predict events related to financial ratios (Gugler & Burcin 2003, p. 740). Moreover, this will enable financial analysts to adopt appropriate course of action that will help improve performance, and in the long run increase a firm’s profitability (Labardin & Marc 2009).
Finally, this study has revealed two research gaps that are suggested for further research. One of these gaps is the influence of dividend policies over dividend ratios while the other is the relationship between financial ratios and the dividend decisions. Importantly, since the analysis was done irrespective of the industries where the firms operate, there is a high chance that this influenced the analysis. As such, there is need to group companies with regards to the industries where they operate in the future analysis so as to obtain the true picture of the relationship that exists between the analysed variables.
References
Aivazian, V, Booth, L & Sean, C 2003, “Do Emerging Market Firms Follow Different Dividend Policies From U.S. Firms,” The Journal of Financial Research, vol. 26, no. 89, pp. 371-387.
Alexander, D & Britton, A 2005, International Financial Reporting and Analysis, MC-Graw Hill/Irwin, Boston MA.
Allen, F & Ivo, W 2000, A Theory of Dividends Based on Tax Clientele, Journal of Finance, vol. 55, no. 45, pp. 2499-2536.
Al-Malkawi, H 2005, Dividend Policy of Publicly Quoted Companies in Emerging Markets: The Case of Jordan, University of Western Sydney, Sydney.
Antonio, B & Ivo, W 2000, “A Theory of Dividends Based on Tax Clienteles,” Journal of Finance, vol. 55, no. 12, pp. 2499-2536.
Astrid, A & Giancarlo, I 2006, “A Market Proposal for Auditing the Financial Statements of Public Companies,” Journal of Management of Value, vol. 3, no. 56, pp. 41.
Bolton, P & Xavier, F 2000, Marketing, Journal of Political Economy, vol. 4, no. 71, pp. 234-235.
Bratton, W 2002, “Enron and the Dark Side of Shareholder Value,” St. Martin’s, New York.
Burns, T, Quinn, F, Warren, G & Oliveira, M 2013, Management Accounting, MC-Graw Hill/Irwin, Boston MA.
Capar, N & Kotabe, M 2003, The relationship between international diversification and performance in service firms, Journal of International Business Studies, vol. 34, no. 4, pp. 345.
Contractor, F 2002, International expansion strategies: International paper of Business and Management, International Thomson Business Press, London.
Coyne, G, Scott, S, Williams, B & Wood, D 2010, “Accounting Program Research Rankings by Topical Area and Methodology,” Issues in Accounting Education, vol. 25, no 4, pp. 631–654.
Creswell, J & Miller, L 2000, Determining validity in qualitative inquiry, Theory into Practice, vol. 39, no. 3, pp. 124-130.
DeMarzo, M & Yuliy, S 2006, Optimal Security Design and Dynamic Capital Structure in a Continuous-Time Agency Model, Review of Financial Studies, vol. 20, no. 6, pp. 2079-2128.
Davids, F & Forest, D 2014, Investing in the Hang Seng Stock Market, St. Martin’s, New York.
Deshmukh, S 2003, “Dividend Initiations and Asymmetric Information: A Hazard Model,” Financial Review, vol. 38, pp. 351-368.
Dodd, D & Graham, B 2010, Security Analysis, John Wiley & Sons, New York.
Ehrhardt, M 2008, Corporate Finance: A Focused Approach, Random, New York.
Fama, E 2002, “Testing Trade-Off and Pecking Order Predictions About Dividends and Debt,” The Review of Financial Studies, vol. 15, pp. 1-33.
Farinas, C & Lourdes, M 2000, “Firms’ Growth, Size and Age: A Nonparametric Approach,” Review of Industrial Organization, vol. 17, no. 88, pp. 249-265.
Fishman, J 2007, Optimal Long-Term Financial Contracting, Review of Financial Studies, vol. 20, no. 56, pp. 2079-2128.
Frank, Z & Vidhan, G 2007, Trade-off and Pecking Order Theories of Debt, The Handbook of Empirical Corporate Finance, Elsevier, Amsterdam.
French, K 2001, “Disappearing Dividends: Changing Firm Characteristics or Lower Propensity to Pay,” Journal of Financial Economics, vol. 60, no. 1, pp. 3-43.
Fulghieri, P & Dmitry, L 2001, Information Production, Dilution Costs, and Optimal Security Design, Journal of Financial Economics, vol. 61, no. 4, pp. 43-42.
Gibbons, R 2004, Four Formali(izable) Theories of the Firm?, Journal of Economic Behavior and Organization, vol. 9, no 5, pp. 6.
Goldstein, R, Nengjiu, J, & Hayne, L 2001, An EBIT Based Model of Dynamic Capital Structure, Journal of Business, vol. 74, no. 68, pp. 483-512.
Graham R & Campbell, H 2001, The Theory and Practice of Corporate Finance: Evidence from the Field, Journal of Financial Economics60, 187–243
Graham, J 2003, Taxes and Corporate Finance: A Review, Review of Financial Studies, vol. 16, no. 32, pp. 1075-1129.
Grullon, G & Bhaskaran, S 2002, “Are Dividend Changes a Sign of Firm Maturity?, Journal of Business, vol. 75, no. 98, pp. 387-424.
Gugler, K & Burcin, Y 2003, “Corporate Governance and Dividend Pay-Out Policy in Germany, European Economic Review, vol. 47, no. 56, pp. 731-758.
Hart, O & Bengt, H 2002, A Theory of Firm Scope, MIT Department of Economics, London.
Harte, O 2001, Financial Contracting, Journal of Economic Literature, vol. 39, no. 71, pp. 1079-1100.
Hennessy, C & Whited, T 2007, Financial analysis of Firms, Journal of Finance, vol. 60, no. 87, pp. 1129-1165.
Hennessy, C 2004, Debt Overhang, and Investment, Journal of Finance, vol. 59, no. 98, pp. 1717-1742.
Huergo, E & Jordi, J 2004, “Firms’ Age, Process Innovation and Productivity Growth,” International journal of Industrial Organization, vol. 22, no. 45, pp. 541-545.
Jain, S 2006, Managerial Economics, International Thomson Business Press, London.
Kieso, E &Weygandt, J 2007, Intermediate Accounting, John Wiley & Sons, New York.
Kotabe, M & Srinivasan, S 2002, Multinationality and firm Performance: The moderating role of R&D and marketing capabilities, Journal of International Business Studies, vol. 33, no. 1, pp. 79.
Kundu, K 2003, A three-stage theory of international Expansion: The link between multinationality and performance in the service sector, Journal of International Business Studies, vol. 34, no. 1, pp. 5.
Labardin, P & Marc, N 2009, “Accounting and the Words to Tell It: An Historical Perspective,” Accounting, Business & Financial History, vol. 19, no. 2, pp. 149–166.
Maskell, V & Baggaley, D 2003, Practical Lean Accounting, Idea Group Publishing, London.
Mocciaro, L, Destri, A, Picone, M & Minà, A 2012, Bringing Strategy Back into Financial Systems of Performance Measurement: Integrating EVA and PBC, Business System Review, vol. 1, no. 1, pp. 85-102.
Morellec, E 2004, Can Managerial Discretion Explain Observed Leverage Ratios? Review of Financial Studies, vol. 17, no. 29, pp. 257-294.
Myers, C 2000, Outside Equity, Journal of Finance, vol. 55, no. 41, pp. 1005−1037.
Myra, S 2003, The Financing of Corporations, Handbook of the Economics of Finance, Elsevier, Amsterdam.
Oldroyd, D & Dobie, A 2008, Themes in the history of bookkeeping, Routledge, London.
Powell, C 2001, “Competitive advantage: logical and philosophical considerations”, Strategic Management Journal, vol. 22, no. 9, pp. 875–888
Rhodes-Kropf, M & Viswanathan, S 2003, Market Value and Merger Waves, Journal of Finance, vol. 9, no. 7, pp. 34-45.
Ruigrok, W & Wagner, H 2003, Internationalization and performance of Firms, IDP Education Australia, Sydney.
Sannikov, Y 2007, Agency Problems, Screening and Increasing Credit Lines, Working Paper, Berkeley Department of Economics, Product Market/Industry Competition Journal, vol. 45, no. 4, pp. 23-24.
Sheridan, T & Tsyplakov, S 2007, Dynamic Model of Optimal Capital Structure, forthcoming Review of Finance, IDP Education Australia, Sydney.
Shliefer, A & Vishny, R 2003, Company Assets and Finances, Journal of Financial Economics, vol. 4, no. 45, pp. 12-13.
Strebulaev, A 2007, Do Tests of Capital Structure Theory Mean What They Say, Journal of Finance, vol. 62, no. 5, pp. 1747-1787.
Tchisty, A 2005, Security Design with Correlated Hidden Cash Flows: The Optimality of Performance Pricing, Working Paper, New York University Press, New York.
Virginia, C & Reed, M 2010, Using Monte Carlo simulation for a capital budgeting project, Management Accounting Journal, vol. 2, no. 34, pp. 5-6.
Weber, R & Stevenson, W 2000, “Evaluations of Accounting Journal and Department Quality,” The Accounting Review, vol. 56, no. 3, pp. 596–612.
Whinston, M 2002, On the Transaction Cost Determinants of Vertical Integration, Journal of Law, Economics, and Organization, vol. 19, no. 12, pp. 1-23.
Whited, T 2005, Debt Dynamics, Journal of Finance, vol. 34, no. 45, pp. 1001.
Williams, L 2010, Practical Financial Management, South-Western College, New York.
Williamson, O 2002, The Theory of the Firm as Governance Structure: From Choice to Contract, Journal of Economic Perspectives, vol. 16, no. 23, pp. 171-195.