Interest rate
The interest rate is a significant variable in the economy because it shows the number of returns that are due to financial instruments. It also determines the amount of saving and borrowing. It also influences other key variables such as investment and inflation among others.
Literature review
From a theoretical perspective, the interest rate is determined using the IS-LM model. This is a scenario where the determination of interest rate is entirely left to the market forces. In most economies, interest rates are not determined by the forces of demand and supply. The IS-LM model refers to the interest rate that is influenced by the central bank (Homer & Sylla, 2011). There are two major types of interest rates. These are nominal and real interest rates. Nominal is the rate that is laid down in a contract between parties while the real one is adjusted for inflation.
In New Zealand, the interest rates are managed by the Reserve Bank. One major interest rate in the economy is the bank interest rate. Banks offer interest on deposits and loans that they issue. In most cases, the banks in New Zealand refer to inter-banking interest rates, interest rates for refinancing, bond interest rates, and interest rates on deposits. Other than the bank interest rate, another vital interest rate in the economy is the rate that is paid on treasury bonds. This makes their interest rates to be determined by their prices (Brigo & Mercurio, 2007). Therefore, analysis shows that interest rates create a connection between banks and other players in the economy such as firms, households, state, other banks, bond markets, deposits, and the Reserve Bank.
In recent years, the changes in interest rates are influenced by factors that are both internal and external to financial markets. First, the different types of interest rates are interrelated and they influence the functioning of each other. Secondly, the performance of the economy also has a significant impact on the interest rate. Thus, to a greater extent, interest rates are set within institutional agreements and are determined through negotiations.
Under the institutional agreement, the policies of the Reserve Bank of New Zealand have a significant impact on the interest rates. Some of these policies are expansionary policies, anti-inflationary policies, revaluation of currencies, and policies that affect the exchange rate. Some of the other factors that affect the exchange rate in the economy are the profitability of firms, private investment, foreign capital, public expenditure, disposable income, and consumption of credit among others.
Comparison of interest rate
In most countries of the world, the central bank comes up with guidelines that give direction on the prevailing interest rate in the economy. Therefore, they are not entirely left for the forces of the market. A comparison of the interest rate of New Zealand and that of Australia and other countries of the world shows that New Zealand has one of the highest rates among developed economies. This has made the cost of borrowing to be high while deposits attract good returns.
However, in the recent past, countries across the globe have reduced the interest rates as an expansionary policy and also to curb inflation. For instance, in New Zealand, the interest rate was reduced by 0.25% to a low of 2%. In June 2015, the interest rate reached a high of 3.5% (Trading Economics, 2016b).
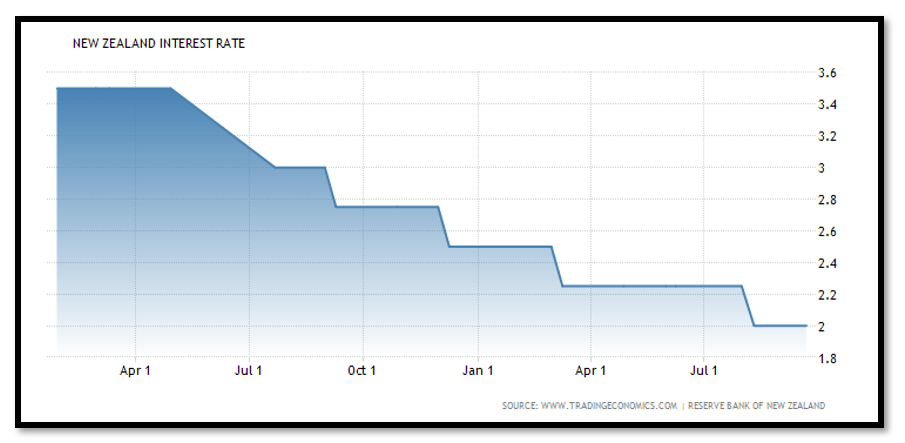
Figure 1.0 above depicts the trend of an interest rate for New Zealand. It shows that there has been a decline in interest rate over the past five years. In Australia, the Reserve Bank has maintained the interest rate at a steady rate of 1.5%. The highest rate that the country has experienced in the recent past is 2.5% (Trading Economics, 2016a).
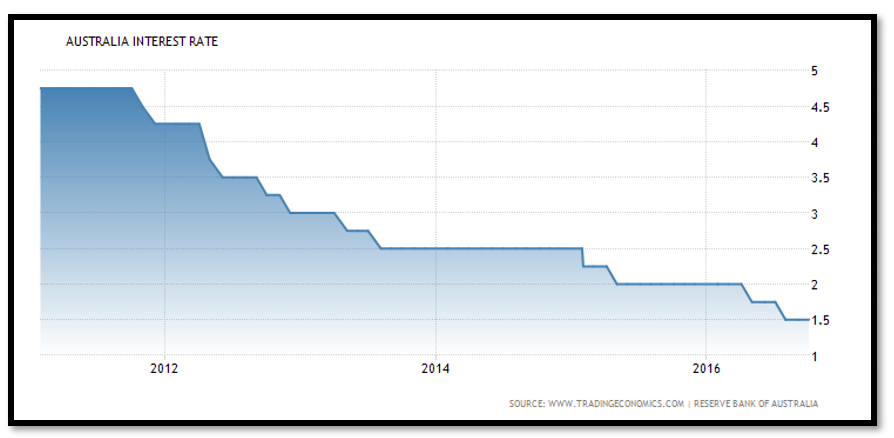
Figure 1.1 above shows the trend of the interest rate of Australia over the past five years. There has been a significant decline over the years. In the United States, the mandate of coming up with interest rates is carried out by both the Board of Governors of the Federal Reserve and the Federal Open Market Committee. Since the beginning of the year, the interest rate of the country has remained unchanged at 0.5%. This was an increase from 0.25% (Trading Economics, 2016c).
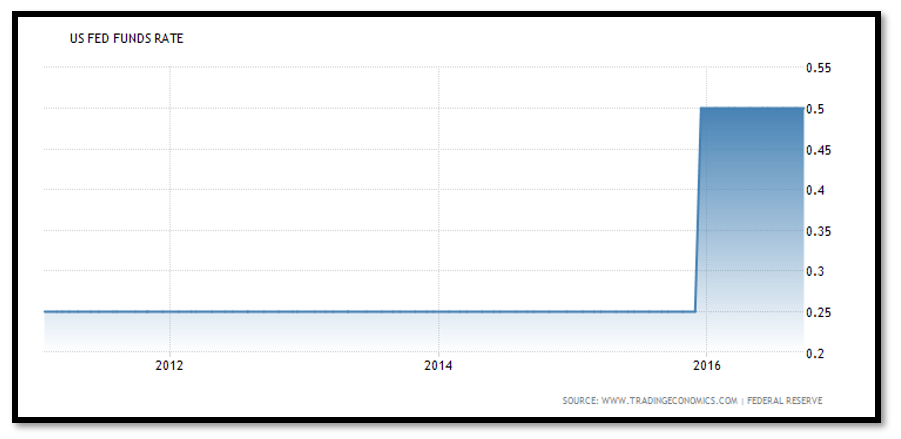
Figure 1.2 shows the trend of an interest rate for the US. The rate has been constant between 2012 and towards the end of 2015. Thereafter, there was an increase. It is expected that the central bank of New Zealand will put in place more monetary policies to reduce the interest rate and inflation rate.
Risk-return analysis
All investments that are made in financial instruments are exposed to some level of risk. Therefore, it is important to analyze some of these risks, measure them, and find ways of mitigating. The total risk of security is equivalent to the total variability. The main components of total risks are a systematic and unsystematic risk.
Literature review
Risk and return are two central concepts in the world of investing. This is based on the fact that different securities have different structures of risk and return. From a theoretical perspective, an investor is assumed to be risk-averse. Therefore, based on utility theory, they will prefer to invest in a security that has less amount of risk. Consider an asset that has normally distributed uncertain payoffs and cash flow the expected return of the asset will be the mean of the distribution while the standard deviation will measure the risks.
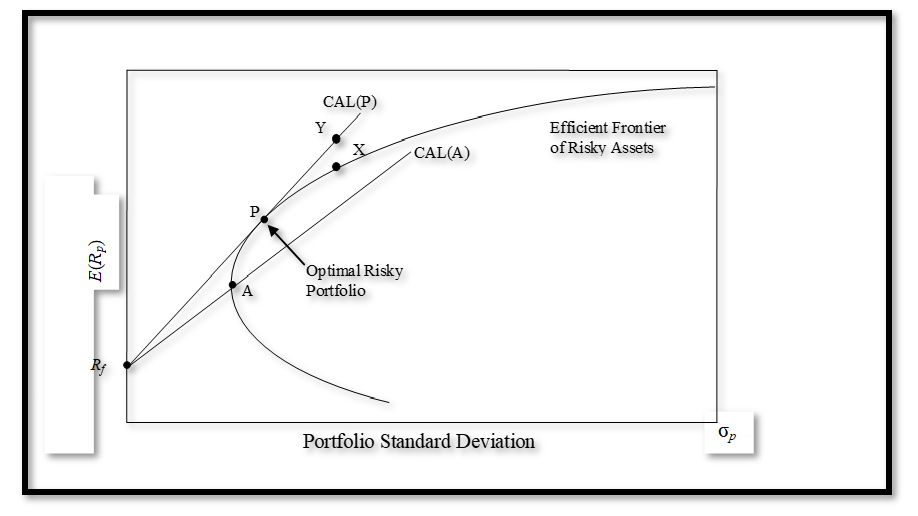
Therefore, a risk-averse investor will choose an asset that has the lowest value of standard deviation. Therefore, the choice of an asset to invest in depends on the risk profile of the investor. An investor can also choose among assets that have the same amount of risk and choose assets that have the highest expected return. A security market line captures the combination of assets that have different risks and returns (Markowitz & Blay, 2014). The relationship between risk and return of a portfolio is captured in a curve that contains three sections. The curve is illustrated below.
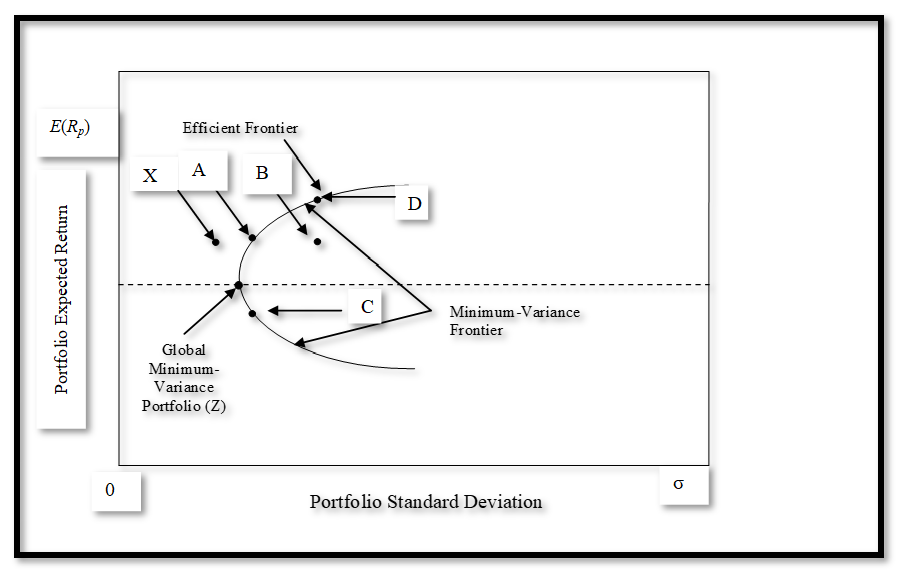
The three sections that are highlighted are minimum variance frontier, global minimum variance, and the efficient frontier. Out of the three sections, the most important part is the Markowitz efficient frontier because it contains the most rational combination of risk and expected return for a risk-averse investor. To come up with an optimal risky portfolio, it is important to draw a capital allocation line. Thus, the point of tangency between the capital allocation line and efficient frontier will yield the optimal risky portfolio as illustrated below.
From a theoretical perspective, it is believed that assets that have high risk offer high returns. However, an investor can reduce the risk exposure and increase return by diversifying. The total variance of a portfolio is lowered when many assets are held together than when dealing with individual assets.
Thus, portfolio theory is an important concept in investing. It outlines that the volatility of a portfolio is highly influenced by the correlation between stocks. Also, it is worth mentioning that diversification reduces unsystematic risks only. The analysis of mean and variance is quite significant in portfolio construction (Markowitz, 2016).
Ways of ranking investment options
There are numerous investment options that an investor can choose from. Thus, several criteria can be used to rank investments. The most common approach is the use of the Sharpe ratio. An investment with a high Sharpe ratio will be preferred to that with a lower ratio. The ratio is arrived at by subtracting the risk-free rate from the risk of the asset then dividing the result by the standard deviation. The Sharpe ratio is not sufficient, especially when constructing a portfolio of assets.
The second recommended approach is the Treynor measure. This measure follows the guidelines of the capital asset pricing model (CAPM). The model outlines that the return of an asset is the sum of the risk-free rate and risk premium multiplied by the measure of risk (beta). Beta is a significant element in CAPM and it only measures how responsive an asset is to the swings in the market. Therefore, the Treynor measure differs from the Sharpe ratio in the sense that it makes use of the beta of an asset instead of standard deviation.
Analysis of assets
In the analysis, four assets will be used. The first one is the company shares for Z Energy Limited. The second asset is the New Zealand government bond. This will represent the risk-free asset. The third asset is corporate bonds. The bond selected is for ANZ Bank New Zealand Limited (NZX Limited, 2016). The final asset is a commercial paper. The calculations are presented in the attached excel file. The four assets will be used to analyze the concept of risk and return. The table presented below shows a summary of expected returns and standard deviation of the securities (Stephens, 2012).
The calculations above show that commercial paper has the highest value of expected return followed by shares. On the other hand, corporate bonds had the least risk as measured by standard deviation followed by government bonds. Further, it can be noted that government bonds and corporate bonds have negative expected returns. This can be explained by the low yields of the assets. Further, the shares and commercial papers have slightly high values of expected return.
Further, the inverse relationship between risk and return is evident in the results above. The two assets that have high expected returns also have a high value of standard deviation (a measure of risk). A risk premium is required to compensate the investors for the high risk. On the other hand, government bond and corporate bond that have low expected returns. They also have low values of risk.
A portfolio can be constructed with the four assets. The calculations in excel show that the portfolio return will be 0.024% while the standard deviation of the portfolio will be 0.9665%. If the portfolio results can be compared with the results for each asset, it can be noted that the portfolio has the least amount of standard deviation (risk). The expected return is also a positive value of 0.024%.
Thus, it is evident that diversification reduces risk. Further, the results show that investing in more than two assets reduces the risk further and improves return than investing in two assets. The calculations show that the standard deviation of a portfolio that is made up of shares and government bonds is 1.3091% while that of a portfolio of corporate bond and commercial paper is 1.2081%. In the case of a portfolio of three assets (shares, commercial paper, and corporate bond), the standard deviation is 1.0761%. The expected return in this case is 0.0673%. The results of different combinations of assets yield unlike values of risk and return. Thus, it is important to come up with optimal values of risk and return that will suit the risk profile of an investor.
Time value of money analysis
The selected car dealer is Albany Toyota. The address of the company is 2 Gills Road, Albany, Auckland (Bauer Media, 2014). The vehicle selected for purchase is a Toyota Hilux 2016 model. The price of the vehicle is $45,990. The loan will be paid every week for over 5 years (60 months). Further, the interest rate on the loan is 13.5% per annum. The interest rate will be assumed to be constant throughout the 5 years. The calculations are based on the assumption that the price of $45,990 is inclusive of all the other transaction fees (Bauer Media, 2014).
There will be no additional payment to be made. If the car is bought on credit, the attached loan amortization schedule shows that the customer will have to make a weekly payment of $243.47. The total payment that will be made at the end of the 5 years is $63,302. The total interest will amount to $17,312. Thus, the customer will make a payment that is $17,312 over and above the cash basis (Bauer Media, 2014). Therefore, the concept of the time value of money is used to determine the periodic installments that will be made so that the total future value of $63,302 is equivalent to the present value of $45,990.
References
Bauer Media. (2014). Albany Toyota – new vehicles. Web.
Brigo, D., & Mercurio, F. (2007). Interest rate models – theory and practice with smile, inflation and credit. Berlin, Germany: Springer Science & Business Media.
Homer, S., & Sylla, R. (2011). A history of interest rates. New Jersey, NJ: John Wiley & Sons.
Markowitz, H. (2016). Risk-return analysis, volume 2: the theory and practice of rational investing. New York, NY: McGraw Hill Education.
Markowitz, H., & Blay, K. (2014). Risk-return analysis: the theory and practice of rational investing (volume one). New York, NY: McGraw Hill Education.
NZX Limited. (2016). NZX debt market (NZDX). Web.
Stephens, K. (2012). Reliability data analysis with excel and Minitab. New York, NY: ASQ Quality Press.
Trading Economics. (2016a). Australia interest rate. Web.
Trading Economics. (2016b). New Zealand interest rate. Web.
Trading Economics. (2016c). United States fed funds rates. Web.