Executive Summary
This paper aims to work out an activity-based costing system for such a company as Johnson Beverage Inc (JBI). In particular, it is necessary to investigate the expenses, required to fulfill the demands of each customer. Subsequently, this assessment will enable the evaluation of the profitability of various clients. The major findings indicate that Saver Superstore is one of the most convenient partners for JBI because the cost of the service, rendered to this retailer, is minimal. This is why the company should offer discounts to Saver Superstore.
In turn, some customers prove to be much more expensive for JBI, for example, Oscars OddLots, while their profitability is at the same level as that one of Saver Superstore. The loss of such a partner will not constitute a serious threat to JBIs income rates. The management of this organization should pay close attention to the results of activity-based evaluation because it gives deeper insights into the allocation of costs within this organization.
Introduction
This paper aims to develop an activity-based costing system for such a company as Johnson Beverage Inc (JBI). The key objective is to determine the customers profitability. This enterprise has recently faced severe competition from other firms, which specialize in the delivery of beverages to retailers. Some of its loyal customers require discounts; otherwise, they may accept the offers, made by other distributors. The management of Johnson Beverage Inc is rather reluctant to wage a price war because it can result in a significant decrease in significant profits. At this stage, they need to work out their future pricing policies which can help to retain customers at a minimal expense.
Although it is too early to jump to any conclusion, we should say that Johnson Beverage should give discounts to the partners on an individual basis, depending on the expenses, needed to fulfill their demands. They should not generalize while making decisions about the status of each client because the exact amount of effort varies depending on each retailer. Yet, this is just a hypothesis that can be either substantiated or refuted. It should also be noted that this analysis relies only on the information, available at the beginning of 2009 and the situation might have changed immensely over this period. So, the findings presented in this report cannot be treated as conclusive.
Customer Service Costs
First, it should be pointed that the customer service costs of JBI include the following aspects:
- sales visits,
- expediting rush orders,
- delivery,
- handling the product, and
- taking orders (Lynch, 2009, p 4).
The expenses, entailed by these activities, are dependent on such factors as a number of:
- cases sold,
- sales visits,
- purchase orders,
- expedited deliveries, and
- miles covered.
It is vital to determine how much of these cost drivers are attributable to each customer in order to evaluate their profitability. Certainly, there might be other parameters that can affect the total amount of effort needed for each delivery. Under some circumstances, the price may be shaped by other determinants like the urgency of delivery or scheduling problems, but the data have not been included in the case.
Activity-based costing system
Current Approach
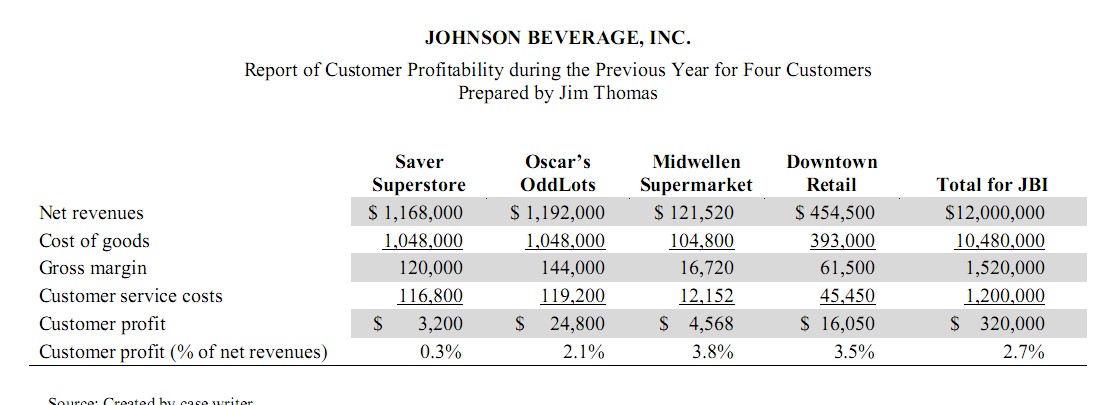
At the present moment, the company estimates costs per customer on the basis of their share in the companys total revenues. In other words, if a certain partner generates 5 percent of JBIs net revenue, the management allocates to this retailer 5 percent of service costs. Overall, these expenses equal approximately 1.2 million dollars annually. Under such a scenario, Saver Superstore (the retailer which demands discounts) is not the most advantageous client because its contribution is only 0,3 percent of JBI income. However, this assessment method does not seem to reflect the operations within the company.
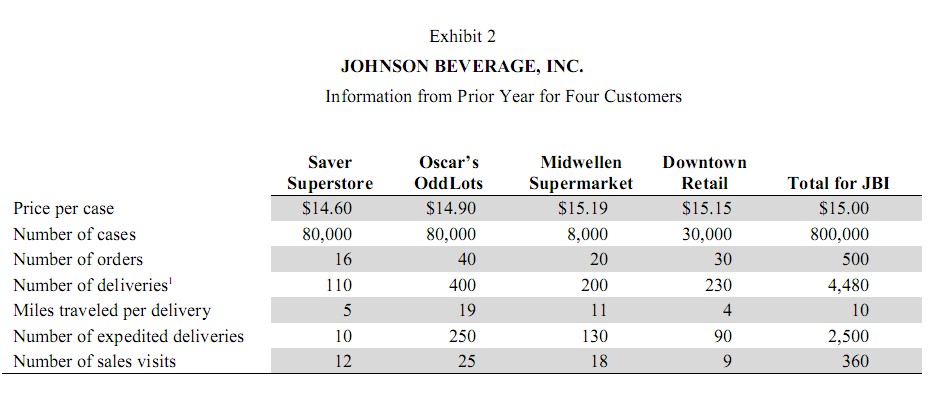
The thing is the amount of time and effort, spent on each partner varies. In some cases, the employees have to devote practically the entire day only to one of the firms. It should be borne in mind that distance also plays an important role in the distribution of costs. For example, JBI trucks have to travel five miles to make delivery to Saver Superstore, while they need to cover ten or even nineteen miles for other firms. This evidence indicates that under some circumstances, JBI has to develop an activity-based cost system to better estimate earning capacity of each client. We have to set stress on the idea that the amount of effort needed to achieve the same result varies from one customer to another. This is why it is critical to estimate the costs needed for the completion of each stage of the delivery process.
Activity-based assessment
In order to work out new strategies for assessment, we should first correlate major companys activities and expenses with its cost drivers. This information can be presented in the following table.
The second step is to determine the number of drivers for each customer (this information has been presented in the appendix). On the basis of this data, it will be possible for us to determine the percentage of the cost for each retailer. This information should be presented in table format.
At this point, it is of crucial importance for us to illustrate the line of reasoning. At first, we need to ascertain the total amount of money, spent on a certain type of service, for instance, delivery of the products. The number equals 140,000 $. In addition to that, the company’s trucks have traveled approximately 48 thousand miles. So, we know the price of customer service and the cost driver. The second, step is to estimate the share of each client. If we are speaking about Saver Superstore, we should say that the delivery of its products equals 550 miles: this is approximately 1.145 percent of 48.000 miles.
Therefore, the fourth step is to determine what is 1.145 percent of 140.000 $. This figure equals one thousand six hundred and four dollars. This procedure has been employed for the estimation of costs per activity. There are other examples, which may better illustrate this point, namely when calculating the cost of expediting we have taken into account the total amount of expedited deliveries, which is 2,500. The cost was 198.000 $. Given these data, we can determine the contribution per each client.
On the whole, it is quite possible to argue that these numbers differ significantly from those of the previous report, made by the executive officers of JBI. In particular, the cost of customer service of Saver Superstore is significantly lower; it constitutes 77 thousand dollars, while the gross profit generated with the help of this retailer, 120.000 $. Judging from this information we can conclude that the profitability of this partner is significantly underestimated. In comparison, the deliveries to OddLots yield virtually the same income: the gross margin is 144.000, but this income is too rather expensive, it costs more than one hundred and twenty thousand dollars.
We need to explain the results of such discrepancies existing between two sets of calculations. In the first case, the price of services is set in accordance with the share which the retailer has in net revenues. As it has been noted earlier, this method is not adequate for the needs of Johnson Beverage Inc. The key issue is that the same result (or income to be more exact) can be achieved by different means (monetary assets). The previous approach is mostly based on the belief that customers requirements are relatively similar to one another. This is the major misconception of this technique because some customers are very demanding. For instance, Oscars OddLots wants JBI to expedite 60 percent of all deliveries (Lynch, 2009).
The activity-based costing system, proposed in this paper enables us to have a more objective idea of how the costs are allocated for each client. In some cases, the results may appear to be rather astonishing because the profitability status of each retailer may significantly change. In this respect, we need to discuss the so-called pain factor, or the efforts, needed for the fulfillment of the task. Occasionally, some of these tasks are time and resource-consuming. This is why there should be a more flexible compensation system. When providing bonuses to the partners, the management of JBI should pay careful attention to the data, furnished in this report.
Judging from this assessment, we can make the following recommendations to the management of JBI. They can provide a small discount to Saver Superstore because this company is one of the most convenient customers for Johnson Beverage Inc. Naturally, there is a great likelihood that discounts may be asked by other retailers but not all of them should receive them. Such a firm as Oscar OddLots is very extremely demanding, while the return on investment is not very large. In fact, if other competitors entice Odd Lots from JBI, the company will not lose much of its profits.
An activity-based costing system is an effective tool for the estimation of costs. It allows assessing the profitability of each client in the most precise manner. Furthermore, it enables the establishment of more productive relationships with the partners. In this paper, we have endeavored to demonstrate that different costing methods can yield different results. The management of JBI should not offer discounts to each customer, the decision should be made only on the basis of an activity-based evaluation of expenses.
Appendixes
Net Revenues
References
Coking G. (2001) Activity-based cost management: an executive’s guide. New York: John Wiley and Sons.
Lewis R. (1995). Activity-based models for cost management systems. New York Greenwood Publishing Group.
Lynch. L. 2009. Johnson Beverage Inc. Darden Business Publishing, pp 1-7.
Namazi, M.. 2009. PERFORMANCE-FOCUSED ABC: A THIRD GENERATION OF ACTIVITY-BASED COSTING SYSTEM. Cost Management, 34-46. Web.