Introduction
Investment is a common phenomenon in today’s business society. It is meant to create profits for the investors. From an economic viewpoint, the process entails procuring goods that are not used at the present. On the contrary, the purchases are used later to build wealth. In finance, investment entails purchasing monetary assets with the notion that the products will generate significant profits in the future. Salvatore thinks that in financial investment, benefits are made when the value of the assets appreciates (85).
In this paper, the author will provide a financial analysis of Samsung Electronics Company. The firm’s investments will be reviewed to determine its profitability. To this end, computations on the firm’s beta, as well as required and expected rate of stock return, will be made. In addition, a comparison between expected and required returns will be made.
Analyzing Investments in Samsung Electronics Company
Market Capitalization = Total number of shares outstanding × market value per share
Value of Samsung Electronics:
Price of stock on December 2015: $1100
Number of shares outstanding: 1,284,000.000
Market Capitalization= 1,284.000.00 × $1100 = 1,412,400,000 (“Samsung Electronics Co. Ltd.” Key Statistics 2).
Dividends
Samsung declared its dividends in December 2014. The annual amount was $0.86, which was to be paid on January 8, 2015. The ex-dividend date was on December 11, 2014. The Date of the Record was December 15, 2014 (“Samsung Electronics Co. Ltd.” MarketWatch News on SSNLF 2). As such, any stockholder who sold the stock on or after December 11, 2014 (ex-dividend date), will receive the dividend. However, if the stock was sold before the ex-dividend date, the new shareholder will not receive the dividend (Ross and Westerfield 44).
Beta
Beta is the evaluation of a stock’s volatility. According to Wang, the financial market has a beta of 1.0 (56). Investors’ stocks are grouped according to the rate at which they deviate from the market’s figure. A reserve, which appreciates over time, has a beta that is above 1.0. Stocks that fluctuate less than the prevailing trends in the market have betas that are lower than 1.0. According to McDowell, high-beta stocks are associated with increased risks (48). However, they tend to generate more returns in the future.
Samsung Beta 0.557884 (“Samsung Electronics Co. Ltd.” Key Statistics 2).
Calculating beta
Beta= SLOPE (D3: D131, E3:E131)
Risk Free Rate: 3 Month T-bill rate 0.24% (“Samsung Electronics Co. Ltd.” MarketWatch News on SSNLF 3)
Calculated beta: 0.557884
Market Rate of Return (S&P 500 Index) in
- We took the monthly average of S&P 500 index of 5 years starting from 2008 by using average (E13: E84), which equaled 0.1538
- Then, we multiplied 15.38 by 12 to find the annual market rate of return of S&P 500 index = 1.8456×100 = 184.56%
CAPM
The Capital Asset Pricing Model is used to calculate the required rate of return. It is achieved by adding the risk free rate (Rf) to the market risk premium (Km – Rf) that is multiplied by the Beta (B), which is a measure of the systematic risk (Wang 105).
![]()
K= 0.24+(1.8456-0.24)0.5579 = 1.1358×100 = 113.58%
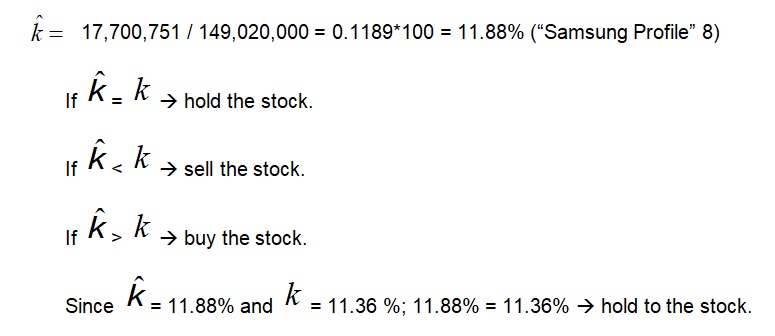
Expected rate of return
Return on Equity: Net Income after taxes / Shareholders Equity
Net Income after taxes = $17,700,751million
Shareholders Equity = $149,020,000 million
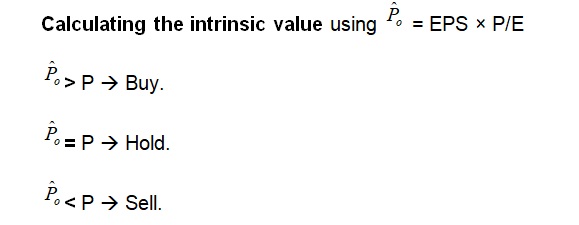
Price/Earnings Approach
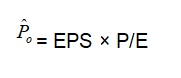
EPS: expected earnings per share for next year (2015).
P/E: justified P/E ratio for the company.
Expected EPS
- Published expected annual EPS for 2014: $138.85 (“Samsung Electronics Co. Ltd.” Key Statistics 3).
- Average of EPS for the last 5 years: $127.86
Using PV, FV to find the expected EPS
Growth Rate
Earnings per share in 2006: $56.35.
Earnings per share in 2014: $138.86.
=Rate(8, 0, -56.35, 138.86) = 21.20%
FV= PV(1+g)
FV of EPS in 2015 = 138.86(1.2120) = $167.26
Using historical trend adjusted approach to find estimated 2015 EPS : EPS = a + b(t)
Finding a & b
- 92.25= a + b(1) → b= 92.25 – a
- 77.64 = a + b(2)
Substitute b= 92.25 – a in equation 2 to find a
77.64 = a + b(2)
77.64 = a + 2(2.03 – a)
77.64 = a + 128.76– 2a
77.64 – 128.76 = –a
–51.12 = –a → a =51.12
Substitute a =51.12 in equation 1 to find b
92.25= a + b(1)
92.25 = 51.12 + b(1)
92.25 – 51.12 = b → b = 41.13
Use a=51.12 & b=41.13 to find expected EPS for 2015.
Estimated EPS in 2015 = 51.12+ 41.13(6) = $297.9
P/E Ratio
- Average Market Multiple S&P P/E= 8.82
- P/E of the Electronics industry: 41.67
- Forward P/E for the company= 10.60
- Average P/E for DIS for the last 5 years= 16.74
Using 15 < P/E < 25 to find the intrinsic ![]() value
value
Expected E 2015: 138.85
15 < P/138.85 < 25
15(138.85) < P < 25(138.85)
2077.5< P < 3471.25
According to this model if the price of DIS:
- is less than $2077.5 we would buy the stock because it would be underpriced
- is between $ 2077.5 and $3471.25 we would hold the stock
- is more than $3471.25 we would sell the stock because it would be overpriced
The actual price of DIS on December 26, 2014 is $1100; thus, our recommendation based on this model is to buy the stock.
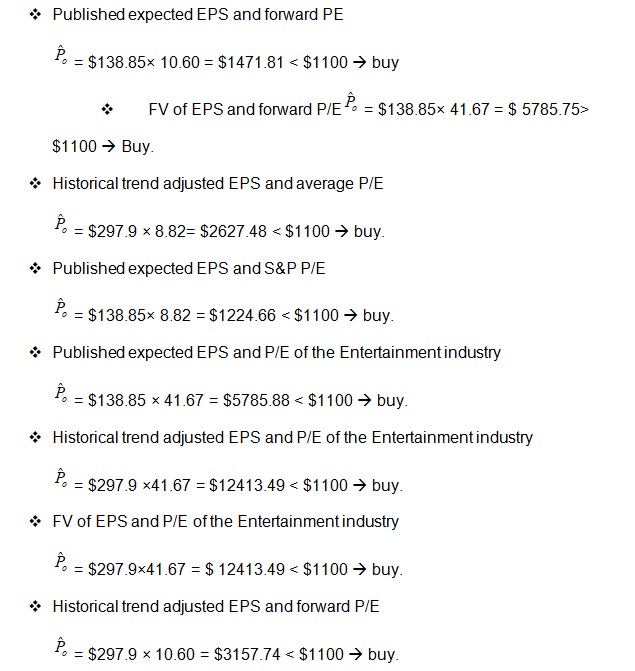
Average of the intrinsic value
=Average (A1:A8)= $1224.66 < $1100 → Sell Price/Earnings Growth Ratio (PEG): P/E → (Earnings Growth Rate) PEG > 1 = fully valued stock → Sell.
PEG = 1 = stock price in line with EPS growth → Hold.
PEG < 1 = undervalued stock → Buy.
P/E=10.60
G=167.26
PEG= 10.60/21.20= 0.5
Since the PEG of DIS is less than 1, the stock is not fully valued (Lee and Lee 8). As a result, investors should not sell the stock.
Recommendations
Investors should identify the goal they wish to achieve by investing in the stock market (Brealey and Myers 34). They can invest either to obtain a long position in stocks or to gain income from stocks dividends. People who buy stock and hold to them for long periods desire to gain huge profits after selling it. However, such investors may not be interested in dividend income. People who invest in stocks for income from dividends may not be aspiring to sell the shares since they provide them with the income they need. Samsung Electronics provides annual dividend income and the price fluctuates because of its continuous introduction of new goods and services. Investors can gain from holding a long position in Samsung Electronics.
Prudent investors often invest in stocks that provide them with an expected rate of return that is higher than the required rate of return. Through the calculations carried out in this paper, we were able to evaluate the stock price and provide recommendations on whether investors should buy, sell, or hold DIS stock. The expected rate of return (11.88%) is almost equal to the required rate of return (11.38%). As a result, it will be best to hold to the stock. Price earnings growth ratio is less than 1 (0.5). What this means is that the stock is underpriced.
Works Cited
Brealey, Richard, and Stewart Myers. Principles of Corporate Finance. 8th ed. 2006. New York: McGraw-Hill/Irwin. Print.
Lee, Cheng, and John Lee. Handbook of Financial Econometrics and Statistics, New York: Springer, 2015. Print.
McDowell, Moore. Principles of Economics. 3rd ed. 2012. New York: McGraw-Hill Higher Education. Print.
Ross, Stephen, and Randolph Westerfield. Corporate Finance. 7th ed. 2005. Boston: McGraw-Hill/Irwin. Print.
Salvatore, Dominick. International Economics: Trade and Finance. 11th ed. 2014. Hoboken, N.J.: Wiley. Print.
Samsung Electronics Co. Ltd. Key Statistics. 2015. Web.
MarketWatch News on SSNLF. 2015. Web.
Samsung Profile. 2015. Web.
Wang, Peijie. The Economics of Foreign Exchange and Global Finance. 2nd ed. 2009. Berlin: Springer-Verlag. Print.