Executive Summary
This report presents a financial ratio analysis focusing on the business risks and financial risks of the Rio Tinto. The company has approached the bank for a possible borrowing of $ 250 million – $ 550 million to meet its aggressive expansion of its core business. Based on a trend analysis and cross sectional analysis of the financial status of the company as disclosed by the annual report of the company for the year 2009, this report recommends a cautious approach in considering the credit proposal of the company in view of the moderate to high level of capital leverage and low short-term liquidity position.
Rio Tinto – Overview
Rio Tinto is a leading international organization engaged in the production of different stages of metals and minerals. The company produces “aluminium, copper, diamonds, coal, iron ore, uranium, gold and industrial minerals (borates, titanium dioxide, salt, talc, zircon).” (Annual Report, 2009) Production facilities of the company are located in Australia and North America. The company operates in more than 50 countries across the globe. There are about 102,000 employees working for Rio Tinto. The company has a strategic policy of investing and operating long-term competitive mines and businesses. In this context, the company has approached the bank for an expected financial assistance of an amount in the range of $ 250 million – $ 550 million. Being a significant amount of exposure, this report analyzes the financial status of Rio Tinto based on the annual report for the year 2009 and makes suitable recommendations.
Business Performance
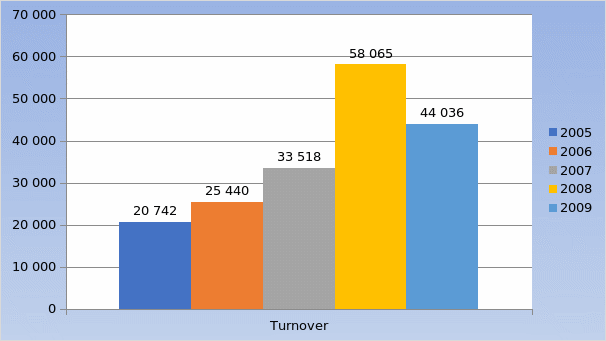
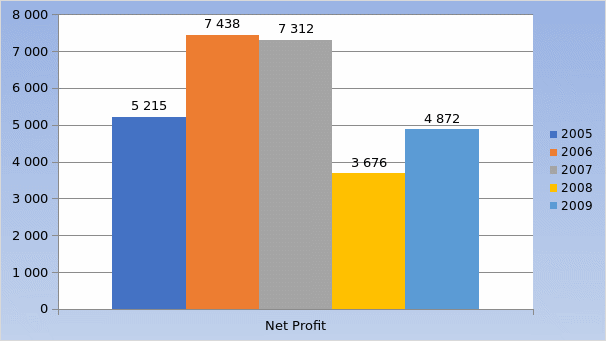
The business performance of the company can be analyzed based on the sales growth and profitability growth over the past five years. The trend in the sales and profitability will be able to indicate the direction in which the business of the company is heading and the ability of the company to meet its obligations towards various stakeholders including the bank. The business performance depends on the ability to add to the shareholders’ wealth through increased earnings. The following table and graphs indicate the position.


There has been a consistent increase in the turnover of the company from the year 2005 to 2008. However, the sales for the company show a declining trend for 2009, which is understandable in view of the global economic recession, which had affected the business of the company as well.
The net earnings of the company have been consistently good until the year 2007. The profitability of the company has gone down considerably in the year 2008 despite having a good turnover. The profitability shows an increasing trend for the year 2009, though not to the level of 2007.
Profitability Ratios
The profitability ratios for Rio Tinto are shown in the following table.
The Return on Equity (ROE) shows how efficiently the company has used the company’s funds to increase the profitability to increase the value of the company to the equity shareholders. Rio Tinto has performed to earn a return of 9.84 % in the year 2009, which is significantly less than that of the year 2008 (17.10%). The return on equity depends on the net earnings of the company. The global economic downturn has resulted in a reduced ROE for the company. The company has also not performed well in terms of its profitability because of economic factors.
Short-Term Liquidity
Despite reasonable profitability in the years, the company is unable to maintain a comfortable short- term liquidity position
Rio Tinto is not maintaining a sound current ratio for the past two-year period. Generally, a current ratio between current assets and current liabilities at 2:1 is considered healthy. Therefore, the company appears to be having a troubled short-term liquidity position during the period under analysis. For the year 2008, the company had still worse current ratio implying that the company had not enough liquidity to meet its short-term financial obligations. The company’s quick ratio is also not showing a healthy short-term liquidity position. Obviously, the company should be delaying the payments to its suppliers and other accounts payable.
Longer-Term Solvency
The long-term solvency of the company can be judged from the capital-gearing ratio, which shows the extent to which the company is using long-term borrowings (NetMBA, 2007). The company is leveraged enough as shown by the following ratios.
For the year 2008, the company’s long-term borrowings have been to the extent of 68.58%, which appears to be high. The ratio has come down in the year 2009, since the company has added reserves to the equity of the company. The income-gearing ratio indicates the ability of the company to meet the interest obligations. Though income-gearing ratio appears to be at an acceptable level, the company is geared to between moderate and high level.
Analysis of Cash Flow
Analysis of Cash flow statement for the year 2009 reveals that the company has generated a net cash flow of US $ 9,212 million (for 2008: US $ 14,883 million) from operating activities. The company appears to be in a comfortable cash-flow situation. Despite the net cash generation, the short-term liquidity position of the company is poor, in view of high level of current liabilities. This implies that the company should be using its cash generation on capital investments and expansion projects. This is evident from the capital expenditure for the company of US $ 5,388 million for 2009 and US $ 8,574 million for 2008. The company might be postponing the settlement of current liabilities and using the funds for investing in new projects. The financial feasibility of the capital expenditure projects that are recently undertaken needs to be investigated to ascertain their capabilities to generate positive cash flows and Net Present Values.
Financials that need to be Analyzed
In order to analyze the proposed exposure it is important to make a financial analysis of the company’s short-term liquidity and long-term solvency. These are the important indicators of financial soundness of a company apart from the profit earning capacity of the company. Sales growth is another pertinent metric that needs to be considered. A complete analysis of the cash flow statement of the company for the last three years showing the net cash generated out of the business is an important financial in the process of reviewing the loan proposal of Rio Tinto. If the company permits, the financial viability of the latest capital expenditure projects undertaken by the company may be reviewed to get first-hand knowledge of the proficiency of the company in investing capital expenditure projects.
Business Risk and Financial Risk
Business risk is caused by economic and global factors, which affect the cash flows of the business of every firm operating in the industry. “It is the variation in cash flow from one period to another that causes greater uncertainty and leads to the need for greater compensation for investors,” (Investopedia, 2010). For instance, the commodity prices and global demand for the products of Rio Tinto are expected to go down, which is a clear business risk for the company that will affect the cash flows from one period to another. Financial risk on the other hand is connected with the improbability on the part of the company to have an efficient management of the funding of its business activities. Financial risk is concerned with the ability of the company to service its debts and interest on them. With an increased financial obligation, the firm will be exposed to more financial risk. In general, companies financed with equity will be exposed to lower financial risk, since in the absence of debts there will be no obligations placed on the company. The actions of the firm in sourcing its funds for operations, arriving at the capital structure, its dealings in foreign exchange, purchasing policies or any other action might affect the ability of the company to meet its financial obligations and would therefore lead to financial risk. For example, due to its transactions in foreign currencies Rio, Tinto the company may suffer financial losses in case it the exchange rates move unfavorably to the business.
Conclusion
Rio Tinto is exposed to moderate to high level of financial risks in view of its leveraging. The company is depending more on borrowed funds than its equity. Moreover, the company has incurred more capital expenditure during the last two years. From the financial statements, it appears that the company has utilized the funds meant to meet the short-term financial obligations for capital expenditure. This is evident from the lower short-term liquidity position of the company. Therefore, Rio Tinto’s proposal need to be considered cautiously as the proposed exposure is too large.
Reference List
Annual Report, 2009. Rio Tinto. Web.
Investopedia, 2010. What are the components of the Risk Premium for Investments? Web.
NetMBA, 2007. Financial Ratios. Web.
